
|
|||||
|
 | |
| |
| |
| |
| |
| |
|
Gene: CELF2 |
Gene summary for CELF2 |
| Gene information | Species | Human | Gene symbol | CELF2 | Gene ID | 10659 |
| Gene name | CUGBP Elav-like family member 2 | |
| Gene Alias | BRUNOL3 | |
| Cytomap | 10p14 | |
| Gene Type | protein-coding | GO ID | GO:0000245 | UniProtAcc | O95319 |
Top |
Malignant transformation analysis |
| Identification of the aberrant gene expression in precancerous and cancerous lesions by comparing the gene expression of stem-like cells in diseased tissues with normal stem cells |
| Entrez ID | Symbol | Replicates | Species | Organ | Tissue | Adj P-value | Log2FC | Malignancy |
| 10659 | CELF2 | HTA11_3410_2000001011 | Human | Colorectum | AD | 1.19e-24 | -7.42e-01 | 0.0155 |
| 10659 | CELF2 | HTA11_2487_2000001011 | Human | Colorectum | SER | 2.36e-13 | -8.02e-01 | -0.1808 |
| 10659 | CELF2 | HTA11_1938_2000001011 | Human | Colorectum | AD | 2.87e-04 | -4.72e-01 | -0.0811 |
| 10659 | CELF2 | HTA11_3361_2000001011 | Human | Colorectum | AD | 2.75e-05 | -6.45e-01 | -0.1207 |
| 10659 | CELF2 | HTA11_83_2000001011 | Human | Colorectum | SER | 4.34e-02 | -5.47e-01 | -0.1526 |
| 10659 | CELF2 | HTA11_696_2000001011 | Human | Colorectum | AD | 3.42e-08 | -4.36e-01 | -0.1464 |
| 10659 | CELF2 | HTA11_866_2000001011 | Human | Colorectum | AD | 1.27e-06 | -4.27e-01 | -0.1001 |
| 10659 | CELF2 | HTA11_2992_2000001011 | Human | Colorectum | SER | 4.14e-03 | -7.96e-01 | -0.1706 |
| 10659 | CELF2 | HTA11_5212_2000001011 | Human | Colorectum | AD | 8.12e-03 | -6.72e-01 | -0.2061 |
| 10659 | CELF2 | HTA11_8622_2000001021 | Human | Colorectum | SER | 4.44e-04 | -7.27e-01 | 0.0528 |
| 10659 | CELF2 | HTA11_7696_3000711011 | Human | Colorectum | AD | 4.30e-05 | -3.72e-01 | 0.0674 |
| 10659 | CELF2 | HTA11_99999970781_79442 | Human | Colorectum | MSS | 1.25e-10 | -4.06e-01 | 0.294 |
| 10659 | CELF2 | HTA11_99999971662_82457 | Human | Colorectum | MSS | 2.74e-02 | -2.22e-01 | 0.3859 |
| 10659 | CELF2 | HTA11_99999974143_84620 | Human | Colorectum | MSS | 6.61e-17 | -5.65e-01 | 0.3005 |
| 10659 | CELF2 | A015-C-203 | Human | Colorectum | FAP | 1.52e-27 | -3.33e-01 | -0.1294 |
| 10659 | CELF2 | A014-C-040 | Human | Colorectum | FAP | 1.30e-02 | -1.35e-02 | -0.1184 |
| 10659 | CELF2 | A002-C-201 | Human | Colorectum | FAP | 2.05e-10 | -2.01e-02 | 0.0324 |
| 10659 | CELF2 | A001-C-119 | Human | Colorectum | FAP | 3.96e-05 | -3.11e-01 | -0.1557 |
| 10659 | CELF2 | A001-C-108 | Human | Colorectum | FAP | 2.23e-12 | -2.28e-01 | -0.0272 |
| 10659 | CELF2 | A002-C-205 | Human | Colorectum | FAP | 1.14e-23 | -4.46e-01 | -0.1236 |
| Page: 1 2 3 4 5 |
| Tissue | Expression Dynamics | Abbreviation |
| Colorectum (GSE201348) |  | FAP: Familial adenomatous polyposis |
| CRC: Colorectal cancer | ||
| Colorectum (HTA11) | 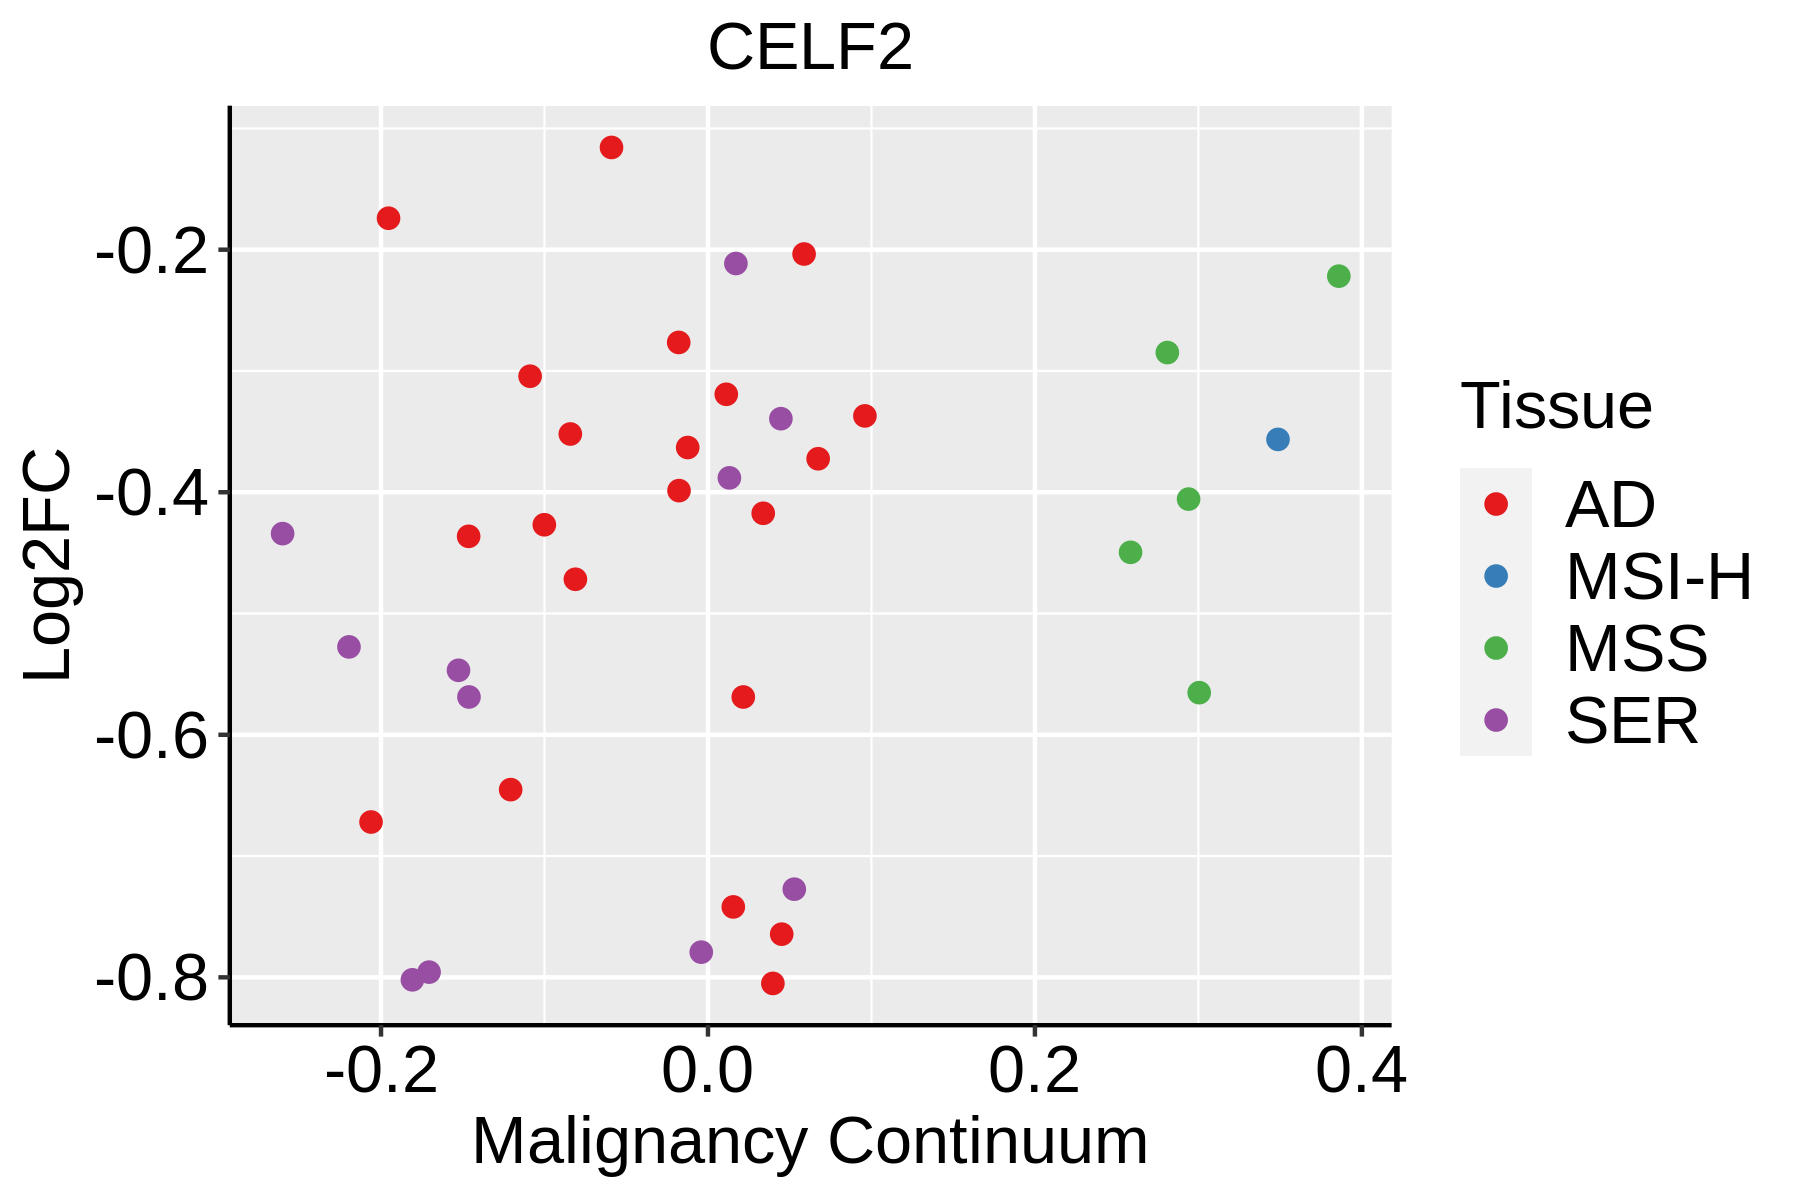 | AD: Adenomas |
| SER: Sessile serrated lesions | ||
| MSI-H: Microsatellite-high colorectal cancer | ||
| MSS: Microsatellite stable colorectal cancer | ||
| Esophagus | 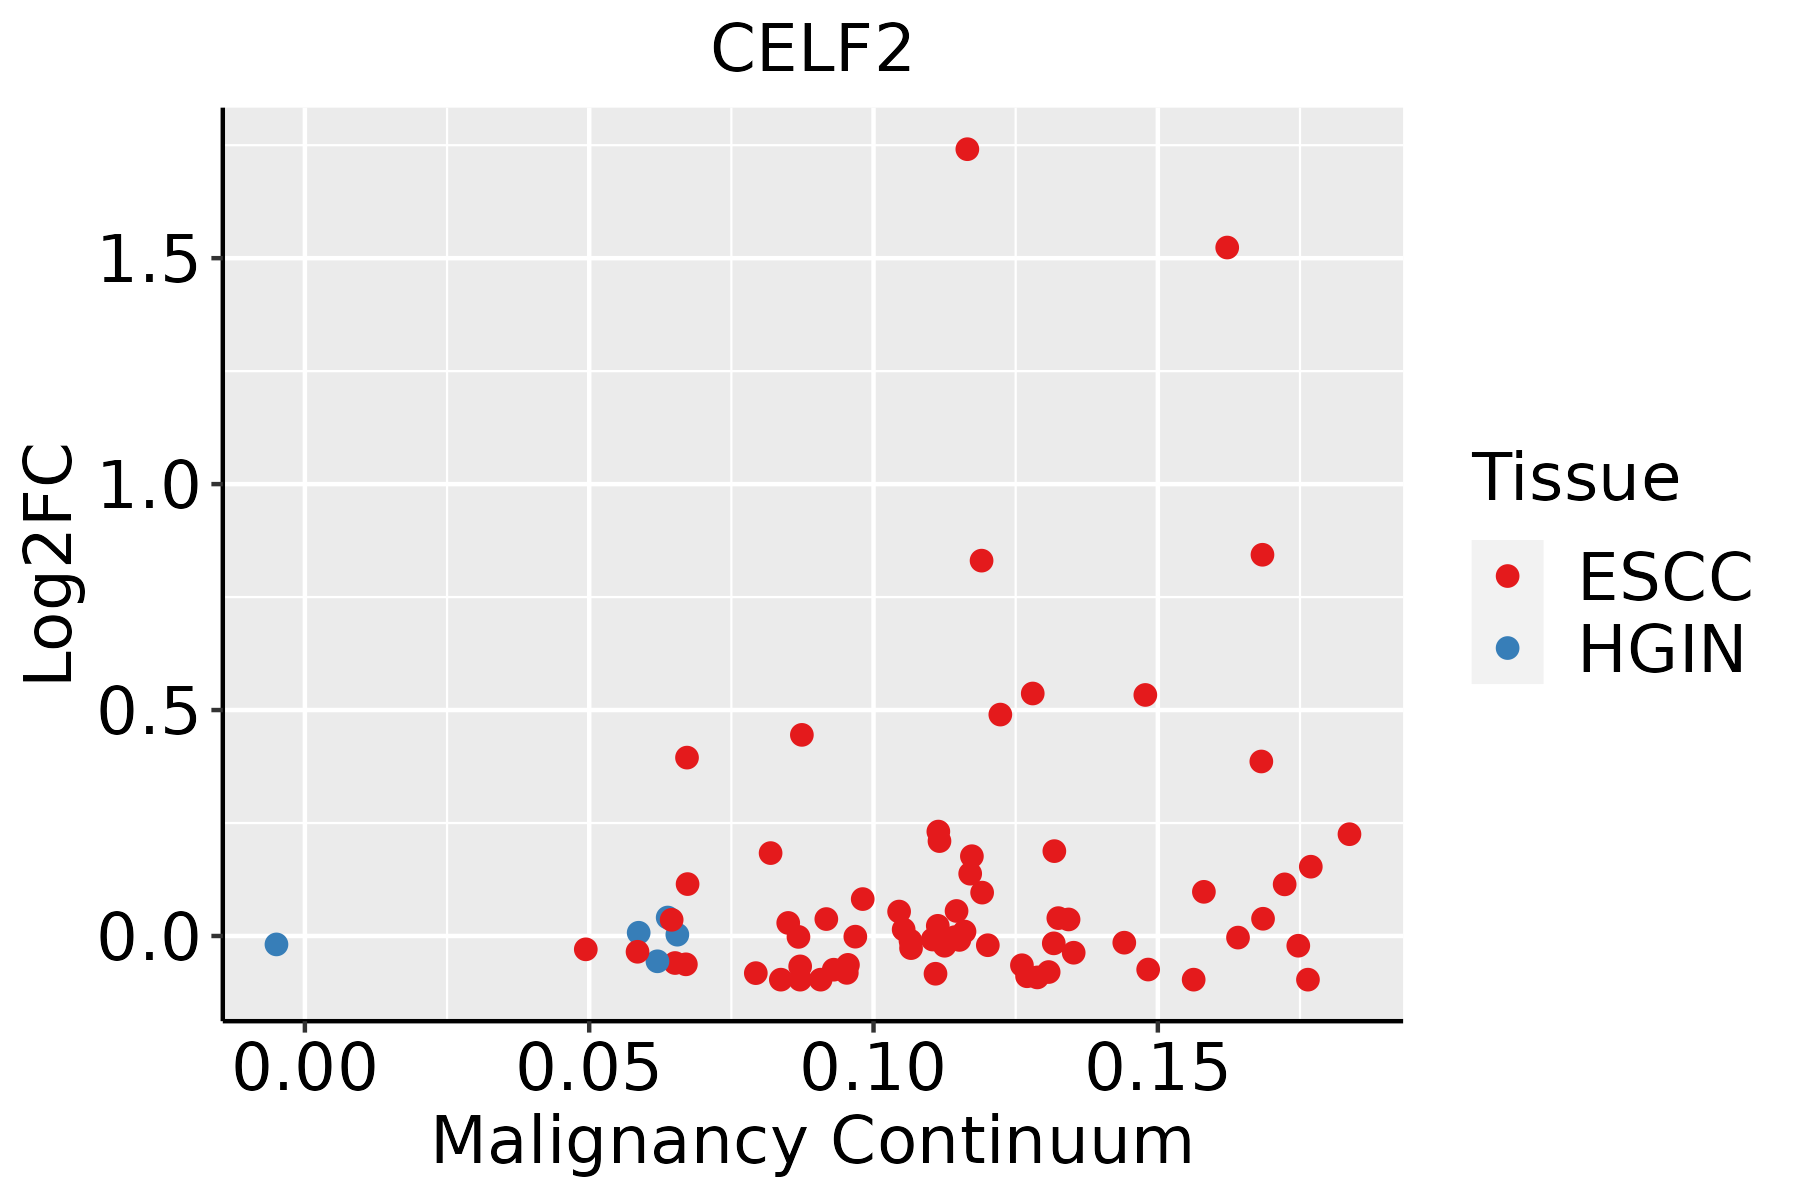 | ESCC: Esophageal squamous cell carcinoma |
| HGIN: High-grade intraepithelial neoplasias | ||
| LGIN: Low-grade intraepithelial neoplasias | ||
| Lung | 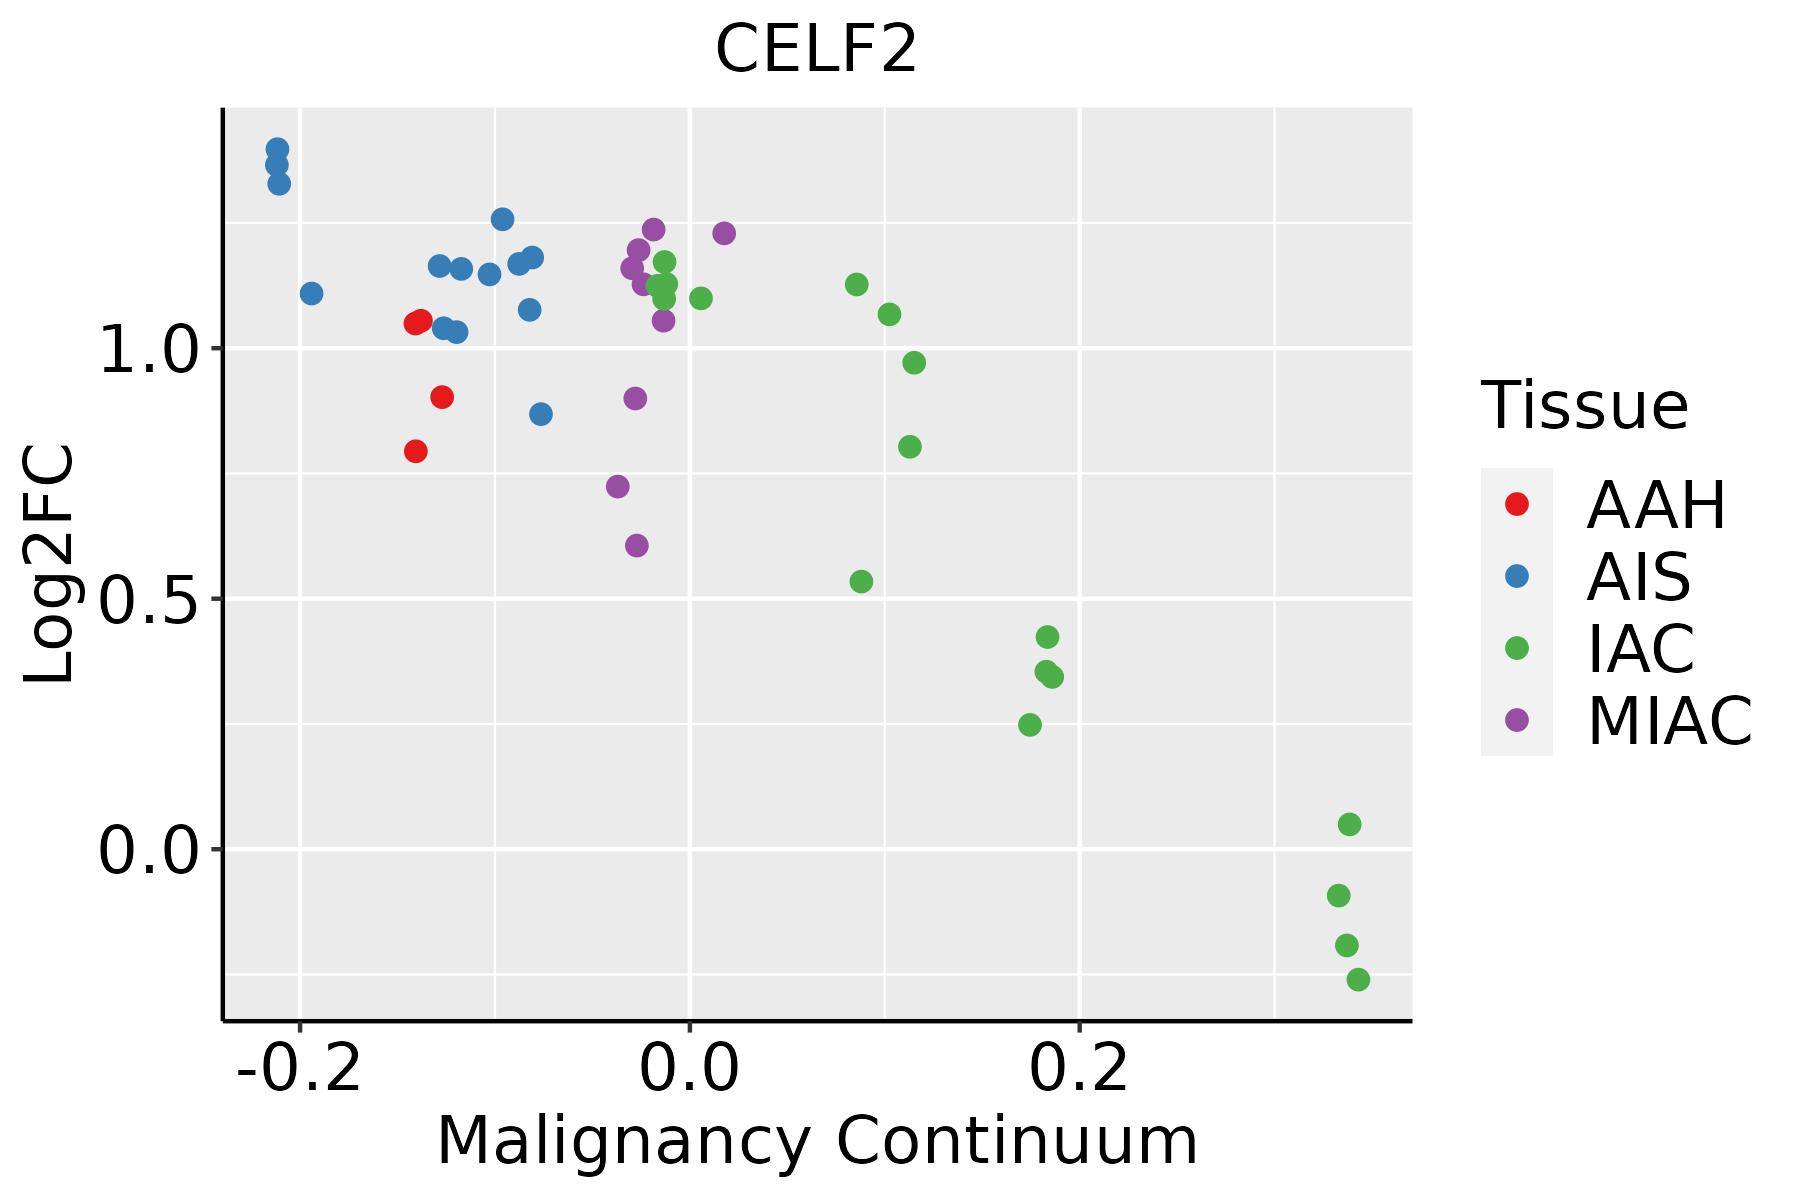 | AAH: Atypical adenomatous hyperplasia |
| AIS: Adenocarcinoma in situ | ||
| IAC: Invasive lung adenocarcinoma | ||
| MIA: Minimally invasive adenocarcinoma | ||
| Oral Cavity |  | EOLP: Erosive Oral lichen planus |
| LP: leukoplakia | ||
| NEOLP: Non-erosive oral lichen planus | ||
| OSCC: Oral squamous cell carcinoma | ||
| Thyroid | 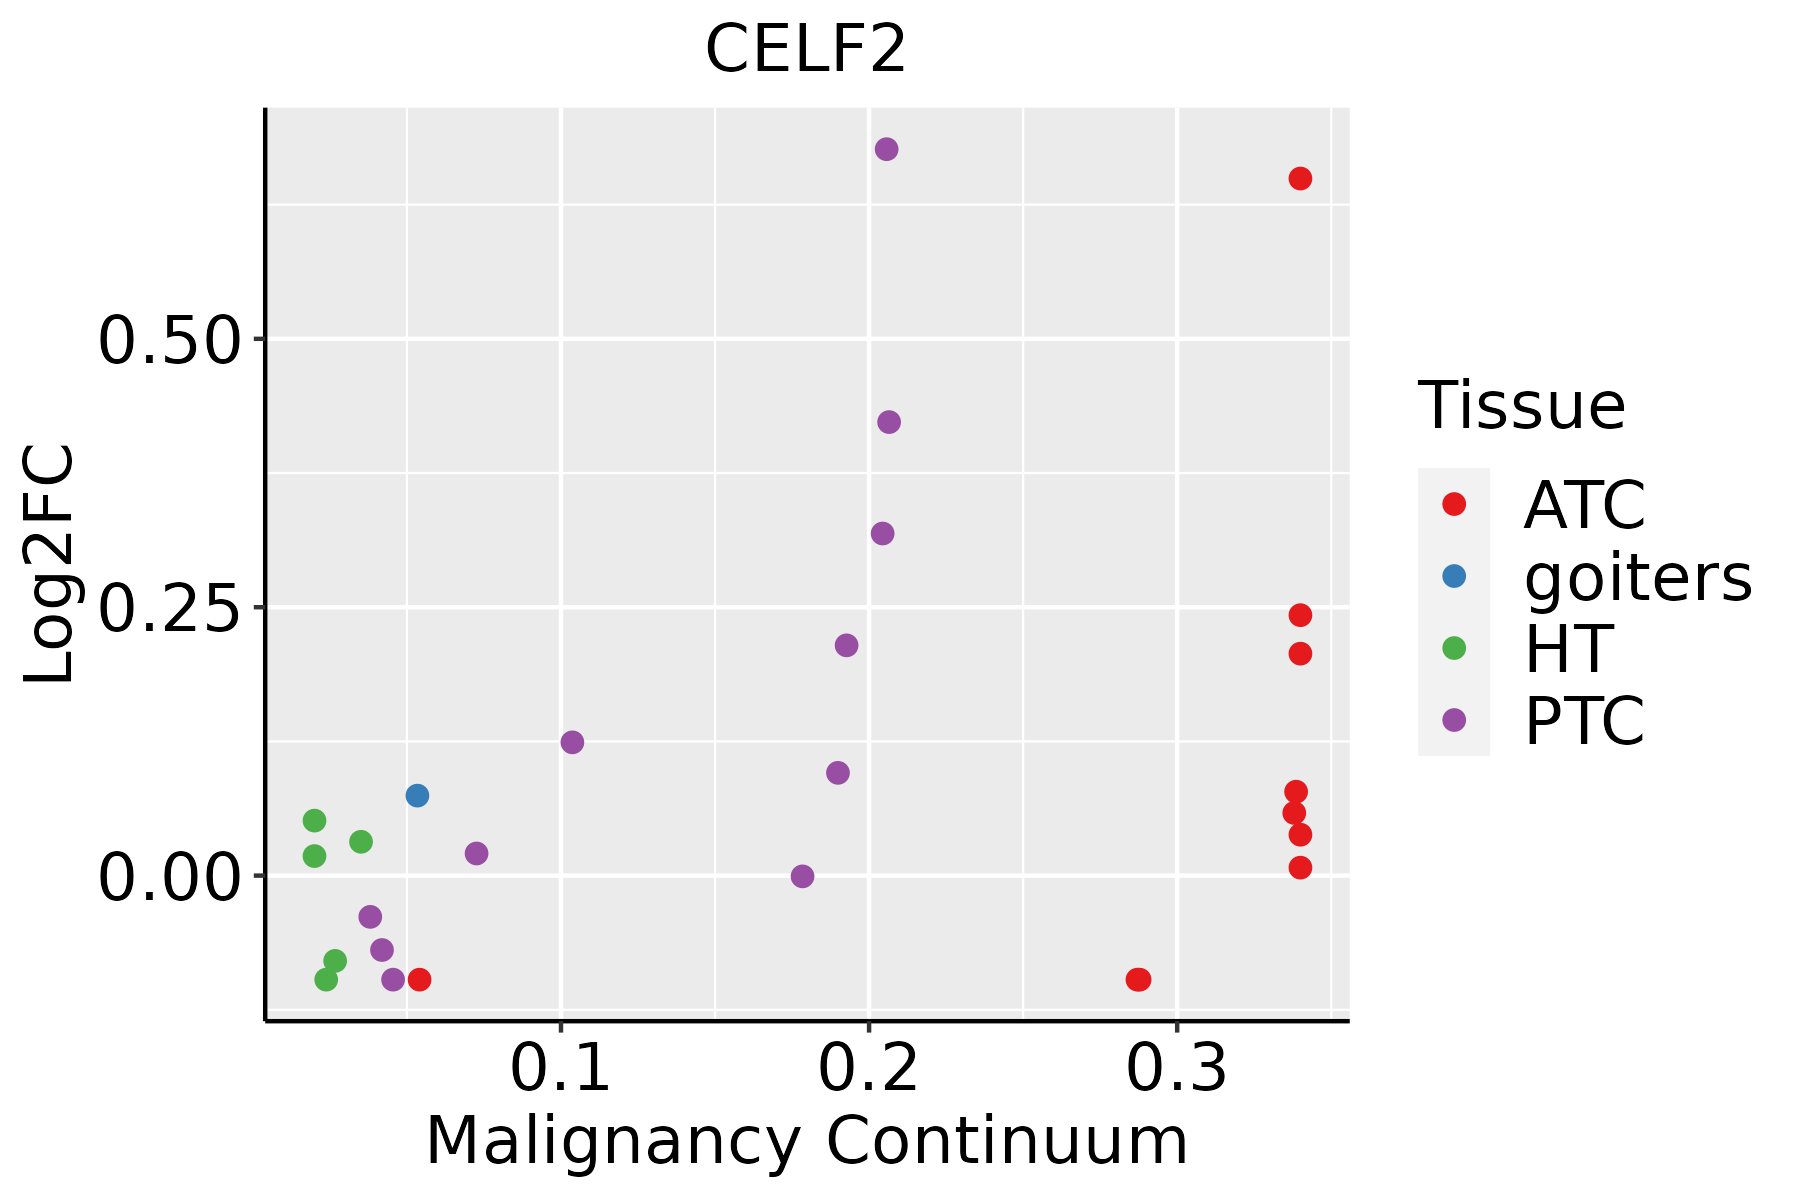 | ATC: Anaplastic thyroid cancer |
| HT: Hashimoto's thyroiditis | ||
| PTC: Papillary thyroid cancer |
| ∗log2FC in expression of this searched gene in stem-like cells from each diseased tissue sample relative to stem-like cells in normal samples in each tissue plotted against the malignancy continuum. Samples are colored based on if they are from different disease stage. |
Top |
Malignant transformation related pathway analysis |
| Find out the enriched GO biological processes and KEGG pathways involved in transition from healthy to precancer to cancer |
| Tissue | Disease Stage | Enriched GO biological Processes |
| Colorectum | AD |  |
| Colorectum | SER |  |
| Colorectum | MSS |  |
| Colorectum | MSI-H |  |
| Colorectum | FAP |  |
| ∗Top 15 enriched GO BP terms are showed in the bar plot of each disease state in each tissue. Each row represents a significant GO biological process which is colored according to the -log10(p.adjust). |
| Page: 1 2 3 4 5 6 7 8 9 |
| GO ID | Tissue | Disease Stage | Description | Gene Ratio | Bg Ratio | pvalue | p.adjust | Count |
| GO:0008380 | Colorectum | AD | RNA splicing | 169/3918 | 434/18723 | 3.59e-18 | 2.04e-15 | 169 |
| GO:0000377 | Colorectum | AD | RNA splicing, via transesterification reactions with bulged adenosine as nucleophile | 130/3918 | 320/18723 | 5.88e-16 | 2.16e-13 | 130 |
| GO:0000398 | Colorectum | AD | mRNA splicing, via spliceosome | 130/3918 | 320/18723 | 5.88e-16 | 2.16e-13 | 130 |
| GO:0000375 | Colorectum | AD | RNA splicing, via transesterification reactions | 131/3918 | 324/18723 | 7.11e-16 | 2.22e-13 | 131 |
| GO:1903311 | Colorectum | AD | regulation of mRNA metabolic process | 117/3918 | 288/18723 | 1.69e-14 | 4.23e-12 | 117 |
| GO:0043484 | Colorectum | AD | regulation of RNA splicing | 70/3918 | 148/18723 | 6.47e-13 | 1.16e-10 | 70 |
| GO:0022618 | Colorectum | AD | ribonucleoprotein complex assembly | 92/3918 | 220/18723 | 1.49e-12 | 2.60e-10 | 92 |
| GO:0071826 | Colorectum | AD | ribonucleoprotein complex subunit organization | 94/3918 | 227/18723 | 1.70e-12 | 2.87e-10 | 94 |
| GO:0048024 | Colorectum | AD | regulation of mRNA splicing, via spliceosome | 50/3918 | 101/18723 | 1.62e-10 | 1.56e-08 | 50 |
| GO:0050684 | Colorectum | AD | regulation of mRNA processing | 61/3918 | 137/18723 | 4.23e-10 | 3.58e-08 | 61 |
| GO:0022613 | Colorectum | AD | ribonucleoprotein complex biogenesis | 151/3918 | 463/18723 | 1.96e-09 | 1.39e-07 | 151 |
| GO:0000380 | Colorectum | AD | alternative mRNA splicing, via spliceosome | 33/3918 | 77/18723 | 1.13e-05 | 2.55e-04 | 33 |
| GO:0000245 | Colorectum | AD | spliceosomal complex assembly | 33/3918 | 79/18723 | 2.15e-05 | 4.33e-04 | 33 |
| GO:0000381 | Colorectum | AD | regulation of alternative mRNA splicing, via spliceosome | 27/3918 | 60/18723 | 2.41e-05 | 4.66e-04 | 27 |
| GO:0006376 | Colorectum | AD | mRNA splice site selection | 18/3918 | 49/18723 | 7.93e-03 | 4.73e-02 | 18 |
| GO:00083801 | Colorectum | SER | RNA splicing | 123/2897 | 434/18723 | 3.84e-12 | 8.41e-10 | 123 |
| GO:00226181 | Colorectum | SER | ribonucleoprotein complex assembly | 69/2897 | 220/18723 | 2.25e-09 | 2.15e-07 | 69 |
| GO:00718261 | Colorectum | SER | ribonucleoprotein complex subunit organization | 70/2897 | 227/18723 | 3.83e-09 | 3.51e-07 | 70 |
| GO:00003751 | Colorectum | SER | RNA splicing, via transesterification reactions | 90/2897 | 324/18723 | 8.68e-09 | 7.50e-07 | 90 |
| GO:00003771 | Colorectum | SER | RNA splicing, via transesterification reactions with bulged adenosine as nucleophile | 89/2897 | 320/18723 | 9.82e-09 | 8.14e-07 | 89 |
| Page: 1 2 3 4 5 6 7 8 9 10 11 |
| Pathway ID | Tissue | Disease Stage | Description | Gene Ratio | Bg Ratio | pvalue | p.adjust | qvalue | Count |
| Page: 1 |
Top |
Cell-cell communication analysis |
| Identification of potential cell-cell interactions between two cell types and their ligand-receptor pairs for different disease states |
| Ligand | Receptor | LRpair | Pathway | Tissue | Disease Stage |
| Page: 1 |
Top |
Single-cell gene regulatory network inference analysis |
| Find out the significant the regulons (TFs) and the target genes of each regulon across cell types for different disease states |
| TF | Cell Type | Tissue | Disease Stage | Target Gene | RSS | Regulon Activity |
| ∗The dot plots of a searched regulon are shown for all cell subpopulations in each disease state of each tissue based on the regulon specific score inferred using pySCENIC and by calculating the average expression. |
| Page: 1 |
Top |
Somatic mutation of malignant transformation related genes |
| Annotation of somatic variants for genes involved in malignant transformation |
| Hugo Symbol | Variant Class | Variant Classification | dbSNP RS | HGVSc | HGVSp | HGVSp Short | SWISSPROT | BIOTYPE | SIFT | PolyPhen | Tumor Sample Barcode | Tissue | Histology | Sex | Age | Stage | Therapy Types | Drugs | Outcome |
| CELF2 | SNV | Missense_Mutation | c.637N>T | p.Val213Leu | p.V213L | protein_coding | deleterious(0.02) | benign(0.019) | TCGA-AN-A0XN-01 | Breast | breast invasive carcinoma | Female | >=65 | III/IV | Unknown | Unknown | SD | ||
| CELF2 | SNV | Missense_Mutation | c.512N>C | p.Leu171Pro | p.L171P | protein_coding | deleterious(0) | probably_damaging(1) | TCGA-BH-A0AW-01 | Breast | breast invasive carcinoma | Female | <65 | I/II | Chemotherapy | carboplatin | SD | ||
| CELF2 | SNV | Missense_Mutation | c.313N>C | p.Glu105Gln | p.E105Q | protein_coding | tolerated(0.06) | benign(0.087) | TCGA-D8-A27G-01 | Breast | breast invasive carcinoma | Female | >=65 | I/II | Unknown | Unknown | SD | ||
| CELF2 | SNV | Missense_Mutation | c.965T>A | p.Leu322His | p.L322H | protein_coding | tolerated(0.08) | probably_damaging(0.971) | TCGA-E9-A1NE-01 | Breast | breast invasive carcinoma | Female | <65 | I/II | Chemotherapy | doxorubicin | CR | ||
| CELF2 | insertion | Nonsense_Mutation | novel | c.826_827insACTGCTAGACTACAGAGAGAGATAATTAGTCACGCTATG | p.Ile276delinsAsnCysTerThrThrGluArgAspAsnTerSerArgTyrVal | p.I276delinsNC*TTERDN*SRYV | protein_coding | TCGA-A8-A07R-01 | Breast | breast invasive carcinoma | Female | >=65 | III/IV | Ancillary | zoledronic | SD | |||
| CELF2 | SNV | Missense_Mutation | c.872N>T | p.Ala291Val | p.A291V | protein_coding | tolerated(0.17) | possibly_damaging(0.757) | TCGA-A6-A565-01 | Colorectum | colon adenocarcinoma | Female | <65 | III/IV | Unspecific | 5FU | PD | ||
| CELF2 | SNV | Missense_Mutation | c.113A>G | p.His38Arg | p.H38R | protein_coding | deleterious(0.02) | probably_damaging(0.945) | TCGA-AA-3672-01 | Colorectum | colon adenocarcinoma | Female | >=65 | III/IV | Unknown | Unknown | SD | ||
| CELF2 | SNV | Missense_Mutation | c.1537N>T | p.Arg513Cys | p.R513C | protein_coding | deleterious(0) | possibly_damaging(0.782) | TCGA-AA-3821-01 | Colorectum | colon adenocarcinoma | Female | >=65 | I/II | Unknown | Unknown | SD | ||
| CELF2 | SNV | Missense_Mutation | novel | c.572N>C | p.Met191Thr | p.M191T | protein_coding | tolerated(0.73) | possibly_damaging(0.801) | TCGA-AA-3950-01 | Colorectum | colon adenocarcinoma | Female | >=65 | I/II | Unknown | Unknown | SD | |
| CELF2 | SNV | Missense_Mutation | c.1496N>A | p.Gly499Asp | p.G499D | protein_coding | deleterious(0) | probably_damaging(0.998) | TCGA-AA-A004-01 | Colorectum | colon adenocarcinoma | Male | >=65 | I/II | Unknown | Unknown | SD |
| Page: 1 2 3 4 5 6 7 |
Top |
Related drugs of malignant transformation related genes |
| Identification of chemicals and drugs interact with genes involved in malignant transfromation |
| (DGIdb 4.0) |
| Entrez ID | Symbol | Category | Interaction Types | Drug Claim Name | Drug Name | PMIDs |
| Page: 1 |

Copyright 2023-Present -The University of Texas Health Science Center at Houston |