
|
|||||
|
 | |
| |
| |
| |
| |
| |
|
Gene: CELF1 |
Gene summary for CELF1 |
| Gene information | Species | Human | Gene symbol | CELF1 | Gene ID | 10658 |
| Gene name | CUGBP Elav-like family member 1 | |
| Gene Alias | BRUNOL2 | |
| Cytomap | 11p11.2 | |
| Gene Type | protein-coding | GO ID | GO:0000003 | UniProtAcc | Q92879 |
Top |
Malignant transformation analysis |
| Identification of the aberrant gene expression in precancerous and cancerous lesions by comparing the gene expression of stem-like cells in diseased tissues with normal stem cells |
| Entrez ID | Symbol | Replicates | Species | Organ | Tissue | Adj P-value | Log2FC | Malignancy |
| 10658 | CELF1 | CA_HPV_1 | Human | Cervix | CC | 4.85e-02 | -6.74e-02 | 0.0264 |
| 10658 | CELF1 | CCI_2 | Human | Cervix | CC | 1.73e-06 | 6.72e-01 | 0.5249 |
| 10658 | CELF1 | CCI_3 | Human | Cervix | CC | 1.68e-03 | 6.04e-01 | 0.516 |
| 10658 | CELF1 | HTA11_347_2000001011 | Human | Colorectum | AD | 2.06e-08 | 5.49e-01 | -0.1954 |
| 10658 | CELF1 | HTA11_99999970781_79442 | Human | Colorectum | MSS | 5.45e-03 | 4.50e-01 | 0.294 |
| 10658 | CELF1 | F007 | Human | Colorectum | FAP | 6.35e-05 | -3.80e-01 | 0.1176 |
| 10658 | CELF1 | A002-C-010 | Human | Colorectum | FAP | 1.01e-04 | -2.11e-01 | 0.242 |
| 10658 | CELF1 | A001-C-207 | Human | Colorectum | FAP | 2.15e-02 | -1.16e-01 | 0.1278 |
| 10658 | CELF1 | A015-C-203 | Human | Colorectum | FAP | 7.33e-35 | -4.06e-01 | -0.1294 |
| 10658 | CELF1 | A015-C-204 | Human | Colorectum | FAP | 1.69e-09 | -3.37e-01 | -0.0228 |
| 10658 | CELF1 | A014-C-040 | Human | Colorectum | FAP | 2.48e-07 | -4.27e-01 | -0.1184 |
| 10658 | CELF1 | A002-C-201 | Human | Colorectum | FAP | 6.13e-15 | -3.32e-01 | 0.0324 |
| 10658 | CELF1 | A002-C-203 | Human | Colorectum | FAP | 1.19e-04 | -7.60e-02 | 0.2786 |
| 10658 | CELF1 | A001-C-119 | Human | Colorectum | FAP | 2.22e-09 | -3.96e-01 | -0.1557 |
| 10658 | CELF1 | A001-C-108 | Human | Colorectum | FAP | 1.68e-19 | -3.26e-01 | -0.0272 |
| 10658 | CELF1 | A002-C-205 | Human | Colorectum | FAP | 2.92e-31 | -5.17e-01 | -0.1236 |
| 10658 | CELF1 | A001-C-104 | Human | Colorectum | FAP | 2.25e-06 | -3.20e-01 | 0.0184 |
| 10658 | CELF1 | A015-C-005 | Human | Colorectum | FAP | 1.21e-02 | -1.33e-01 | -0.0336 |
| 10658 | CELF1 | A015-C-006 | Human | Colorectum | FAP | 3.34e-20 | -3.42e-01 | -0.0994 |
| 10658 | CELF1 | A015-C-106 | Human | Colorectum | FAP | 1.81e-17 | -3.46e-01 | -0.0511 |
| Page: 1 2 3 4 5 6 7 8 9 10 |
| Tissue | Expression Dynamics | Abbreviation |
| Cervix | 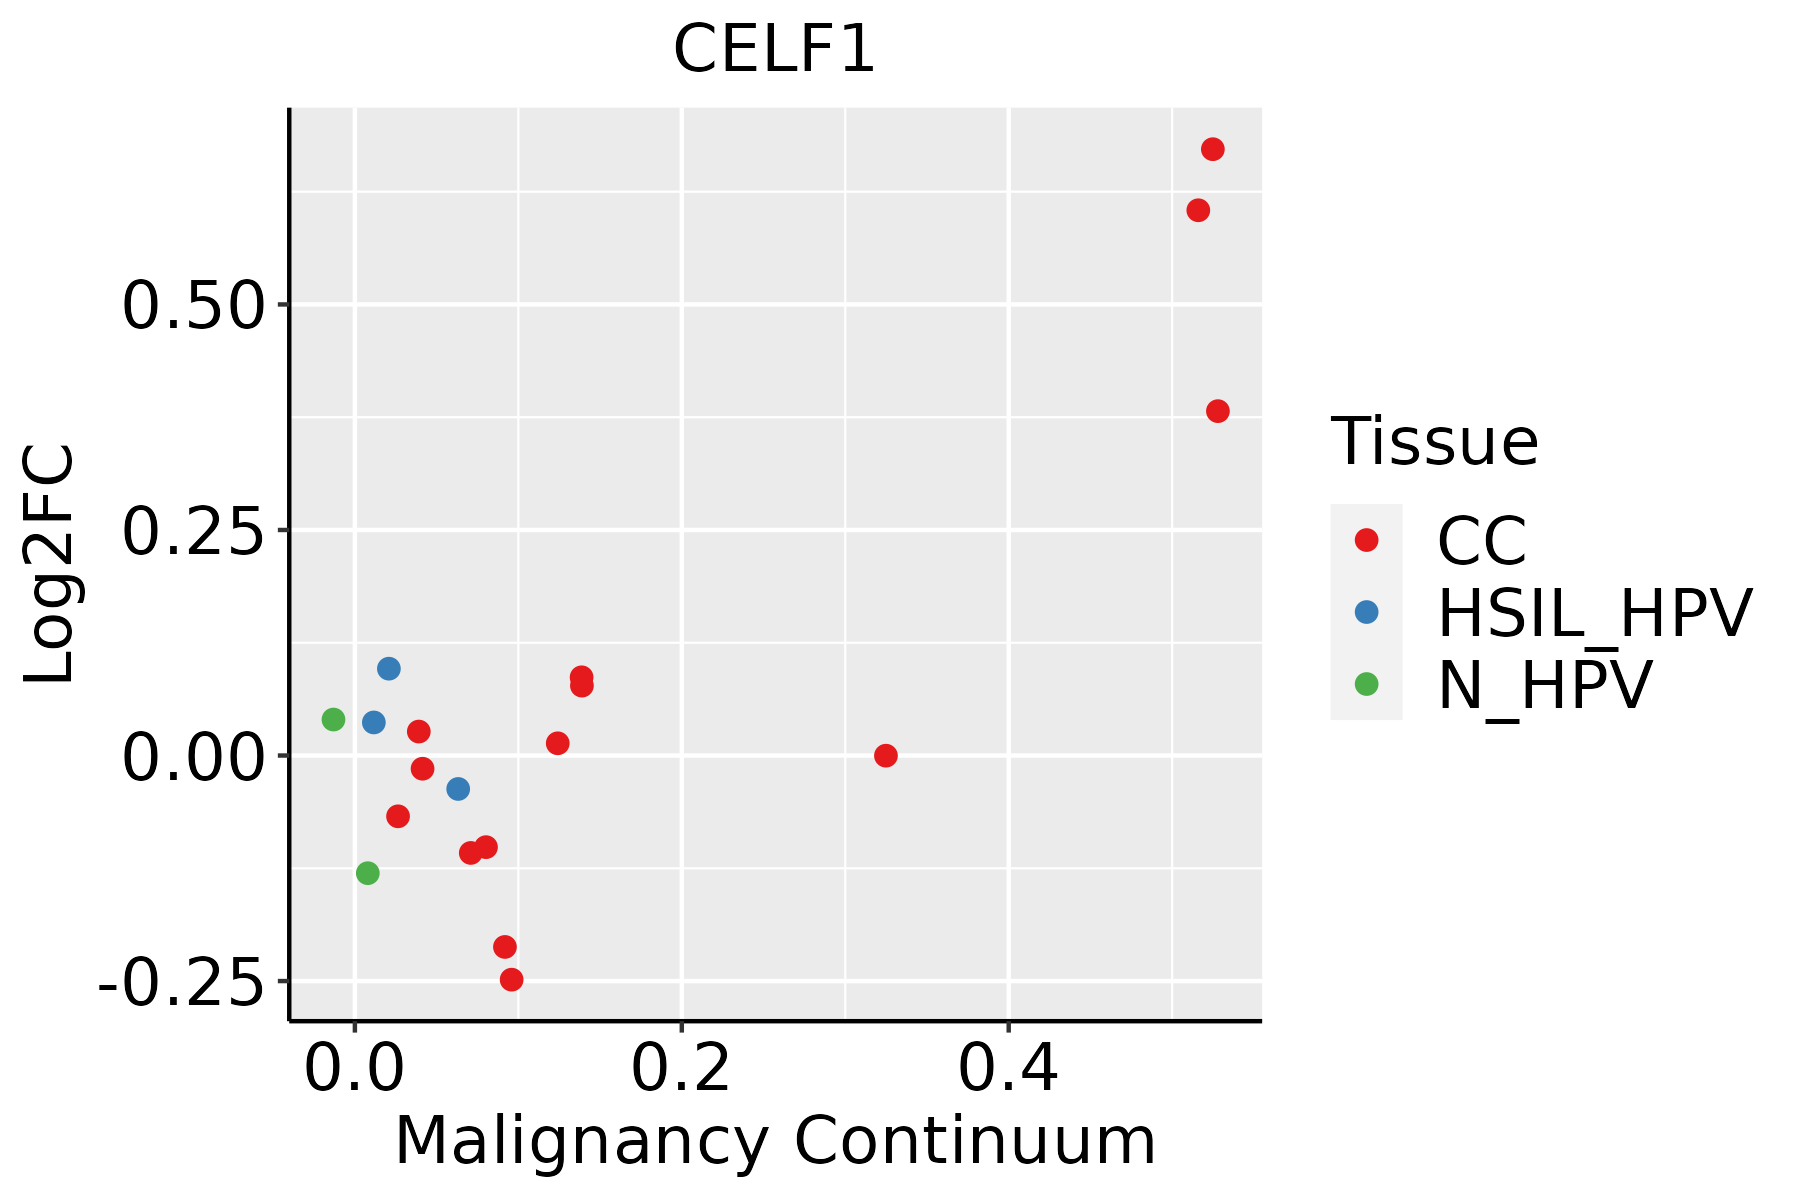 | CC: Cervix cancer |
| HSIL_HPV: HPV-infected high-grade squamous intraepithelial lesions | ||
| N_HPV: HPV-infected normal cervix | ||
| Colorectum (GSE201348) |  | FAP: Familial adenomatous polyposis |
| CRC: Colorectal cancer | ||
| Colorectum (HTA11) |  | AD: Adenomas |
| SER: Sessile serrated lesions | ||
| MSI-H: Microsatellite-high colorectal cancer | ||
| MSS: Microsatellite stable colorectal cancer | ||
| Esophagus | 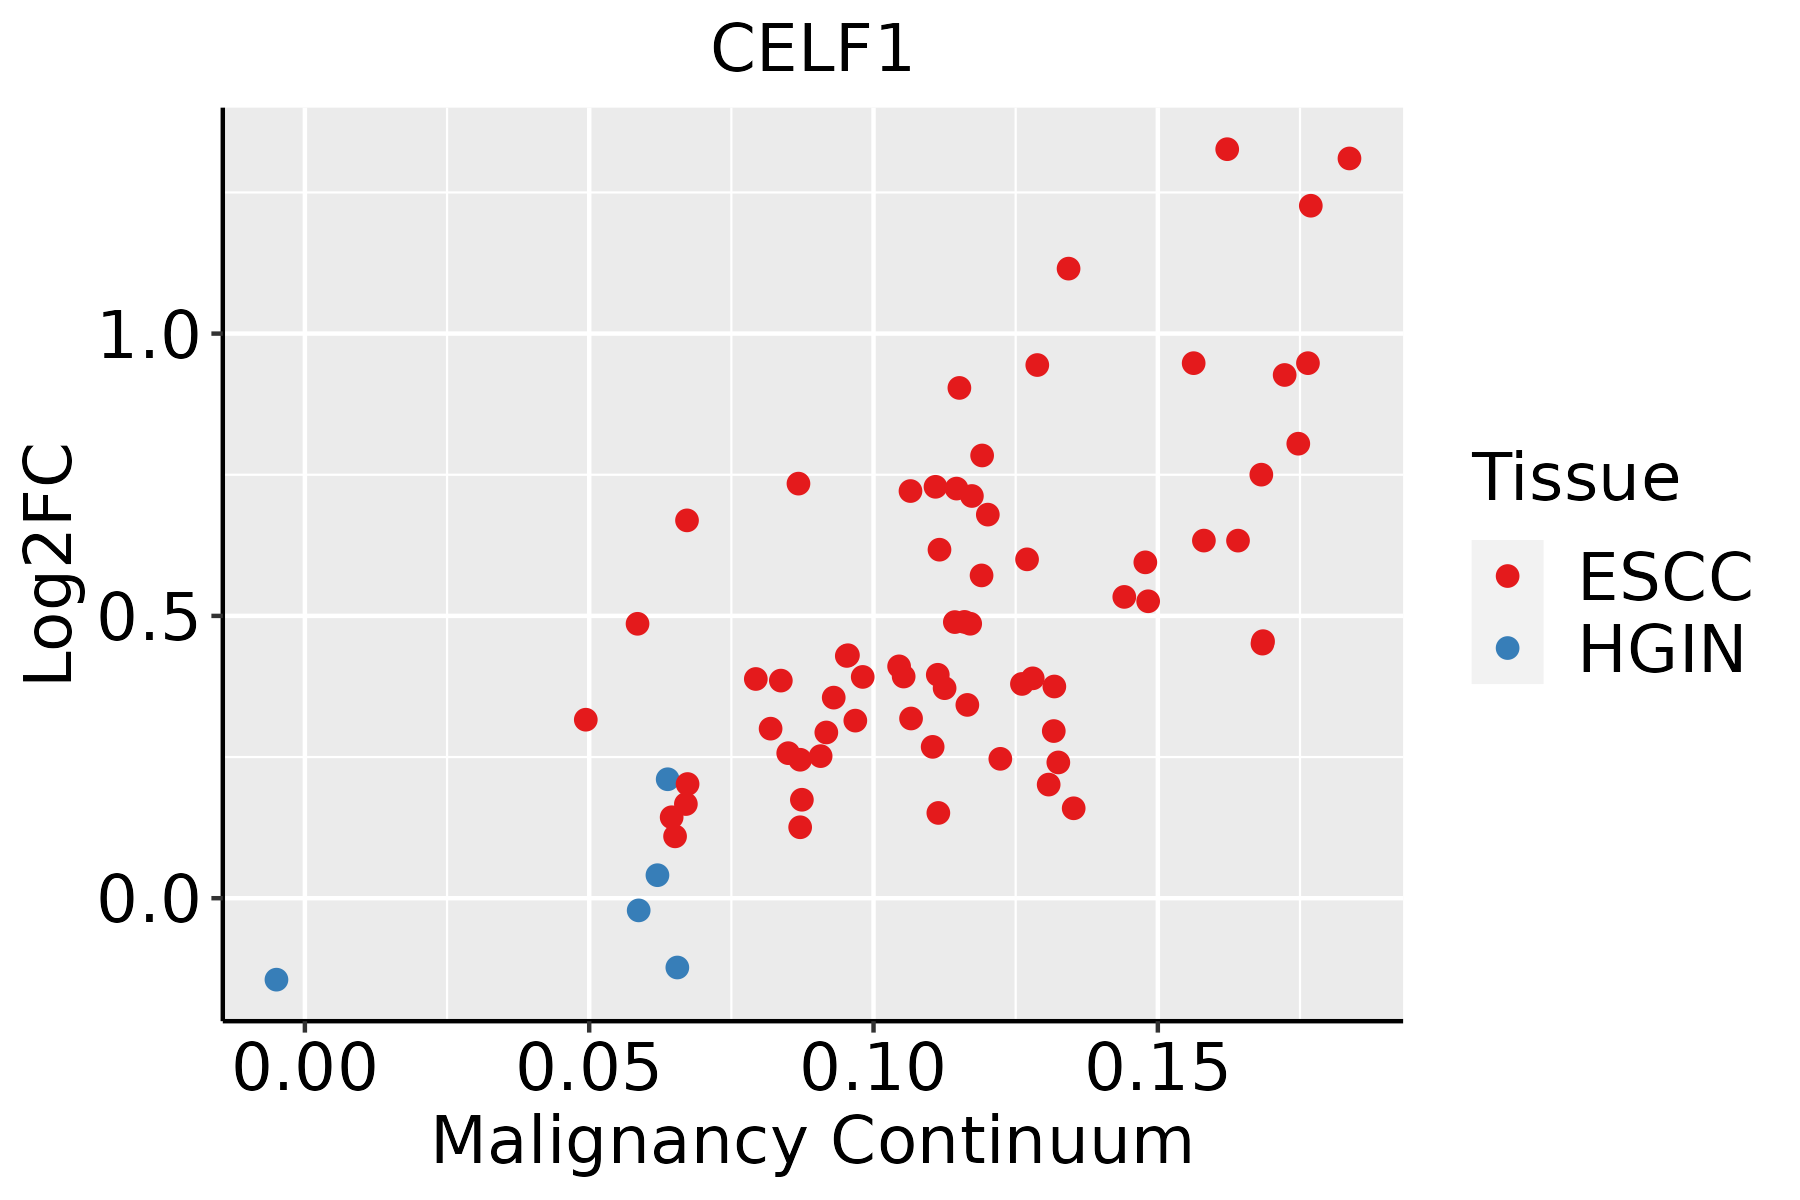 | ESCC: Esophageal squamous cell carcinoma |
| HGIN: High-grade intraepithelial neoplasias | ||
| LGIN: Low-grade intraepithelial neoplasias | ||
| Liver |  | HCC: Hepatocellular carcinoma |
| NAFLD: Non-alcoholic fatty liver disease | ||
| Lung | 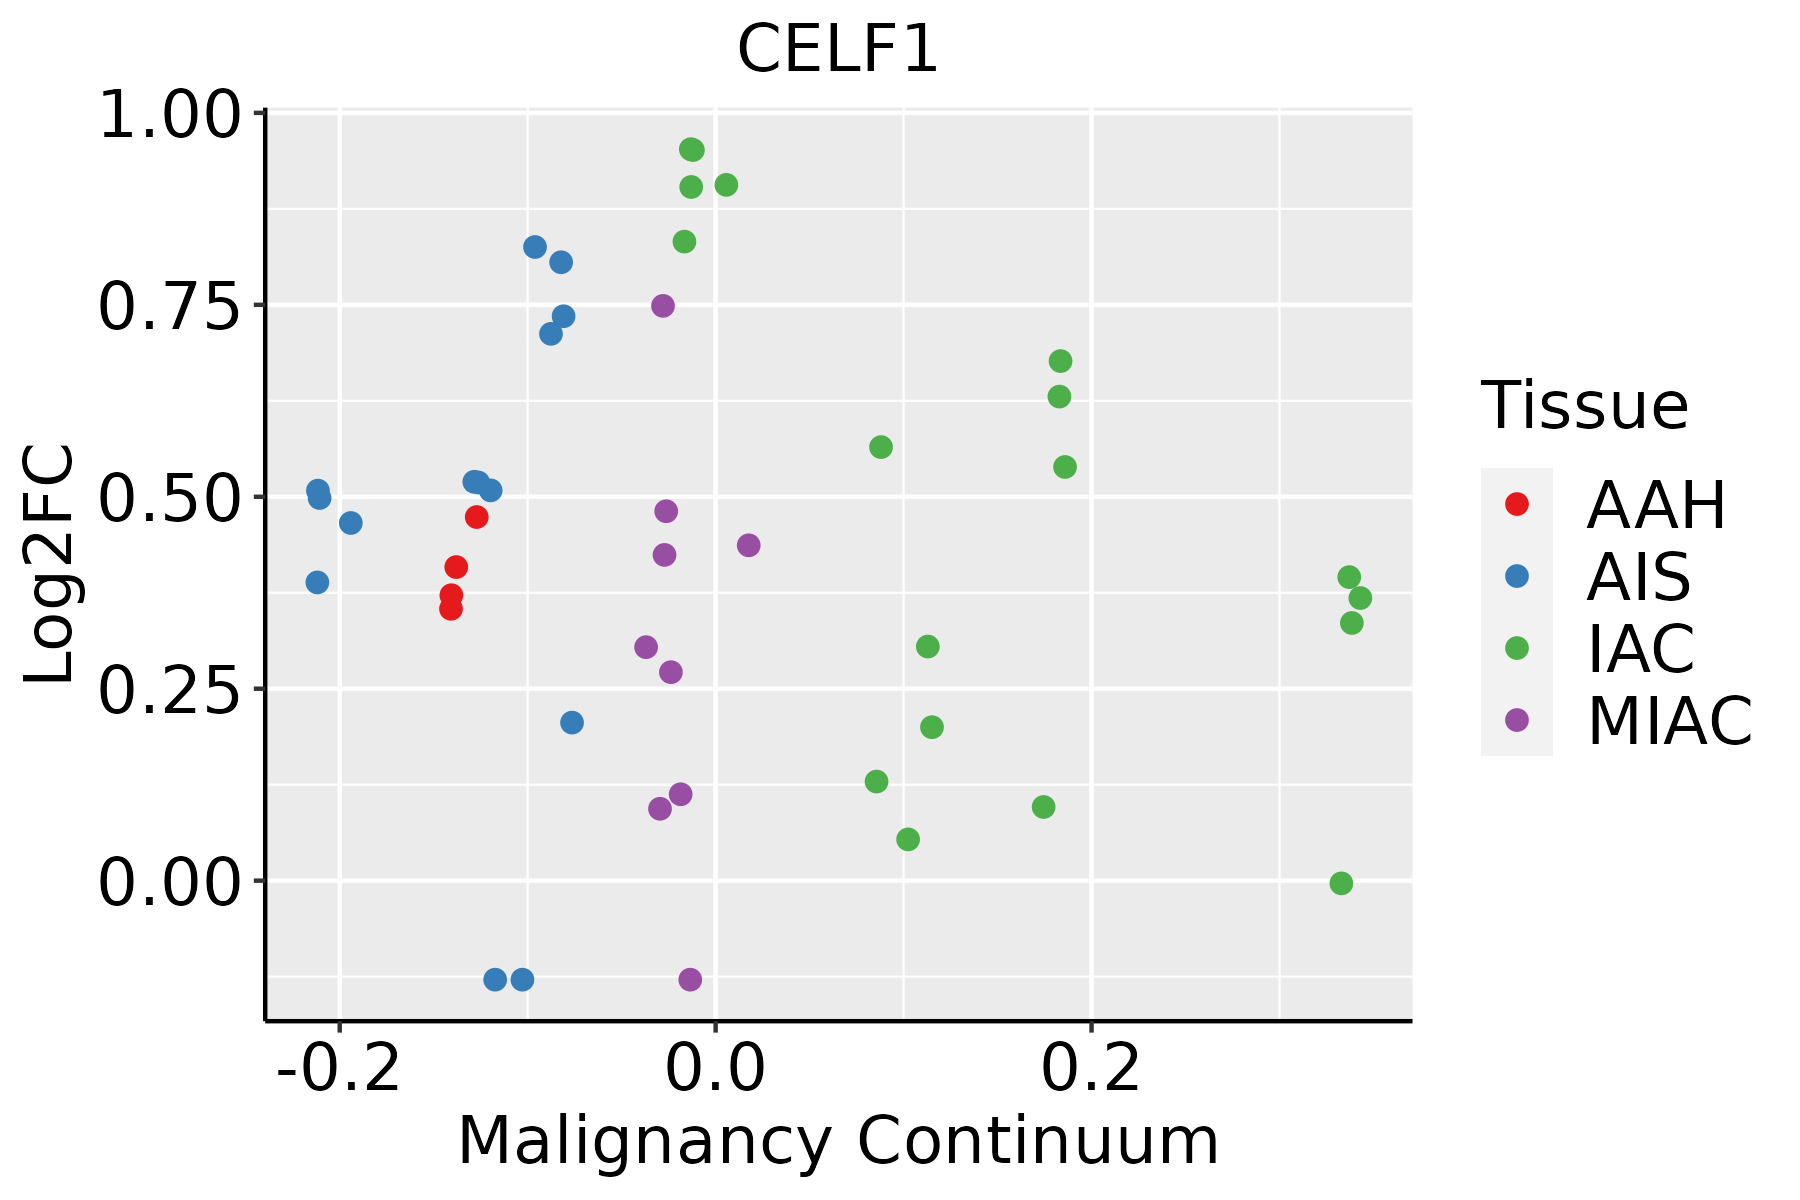 | AAH: Atypical adenomatous hyperplasia |
| AIS: Adenocarcinoma in situ | ||
| IAC: Invasive lung adenocarcinoma | ||
| MIA: Minimally invasive adenocarcinoma | ||
| Oral Cavity |  | EOLP: Erosive Oral lichen planus |
| LP: leukoplakia | ||
| NEOLP: Non-erosive oral lichen planus | ||
| OSCC: Oral squamous cell carcinoma | ||
| Prostate |  | BPH: Benign Prostatic Hyperplasia |
| Skin | 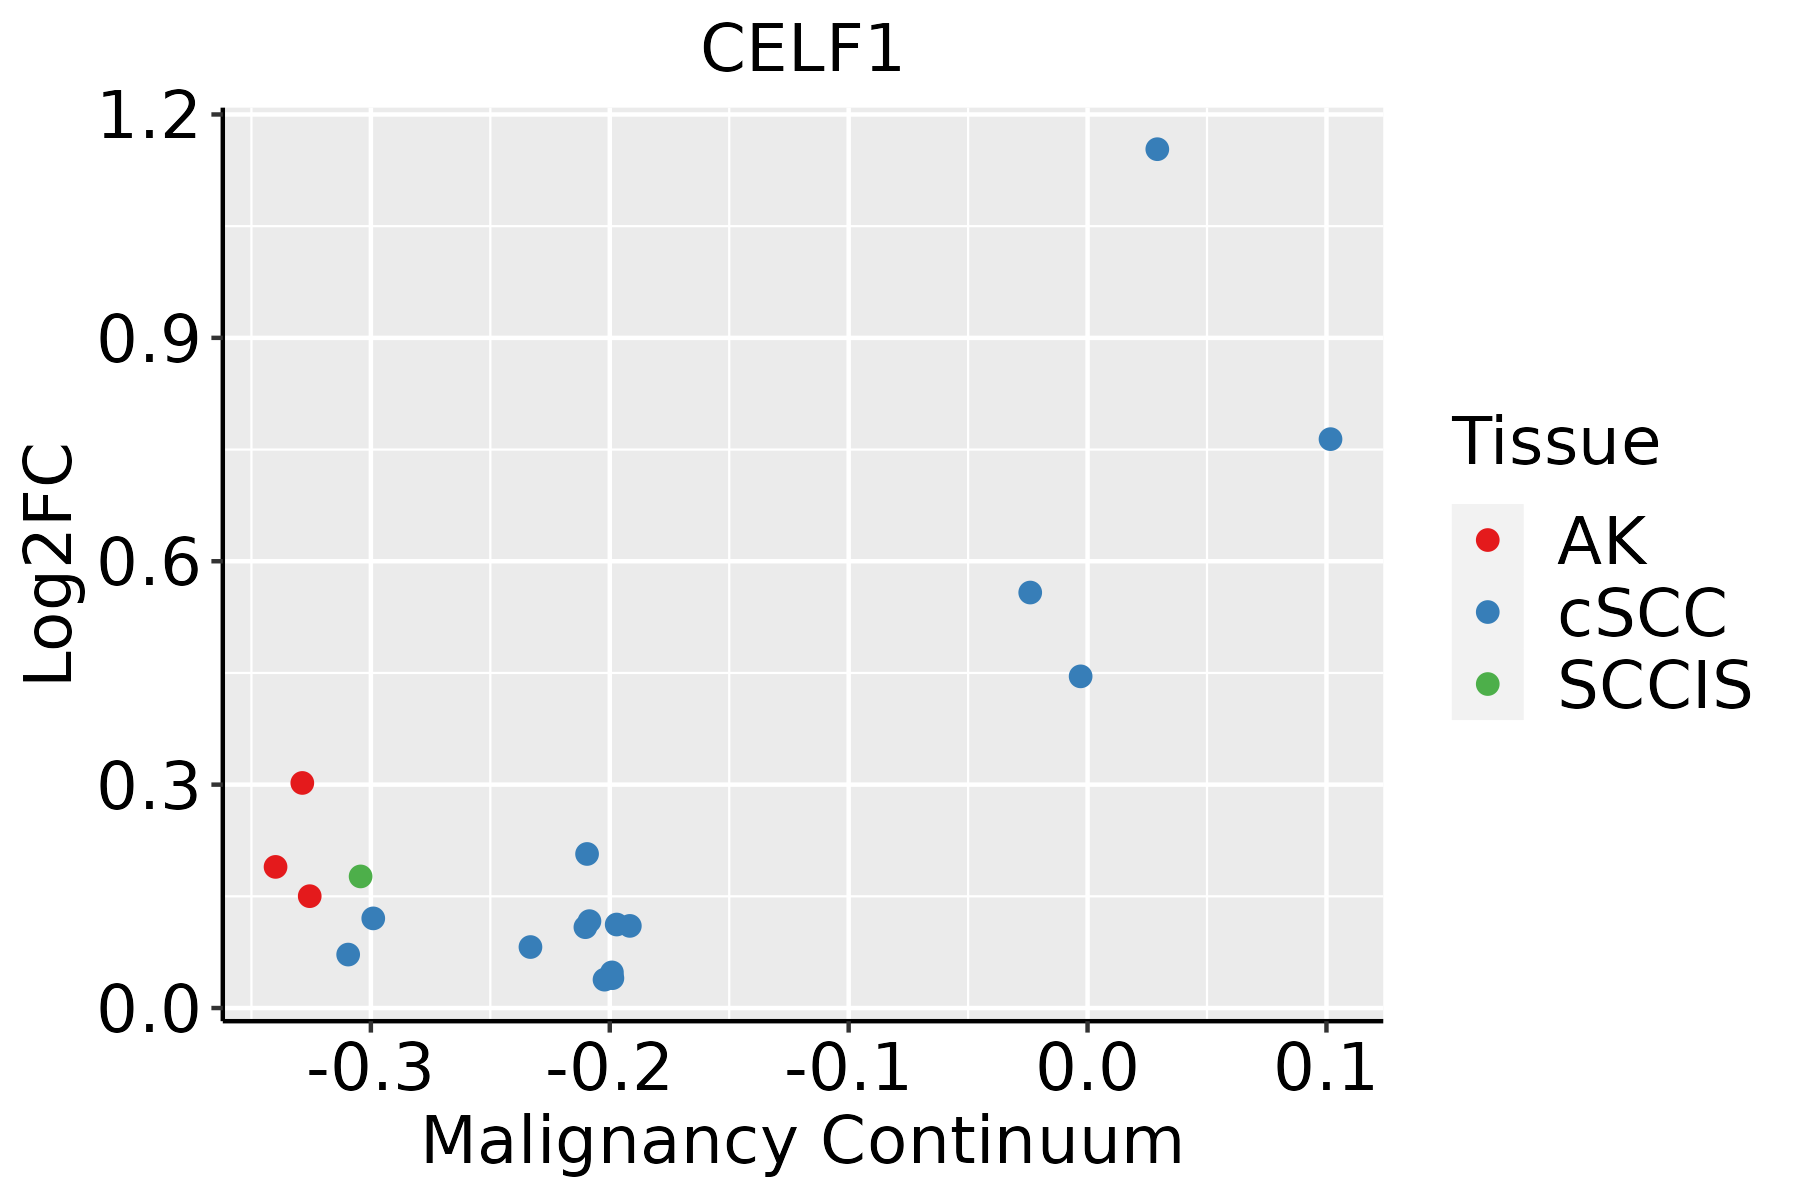 | AK: Actinic keratosis |
| cSCC: Cutaneous squamous cell carcinoma | ||
| SCCIS:squamous cell carcinoma in situ | ||
| Thyroid | 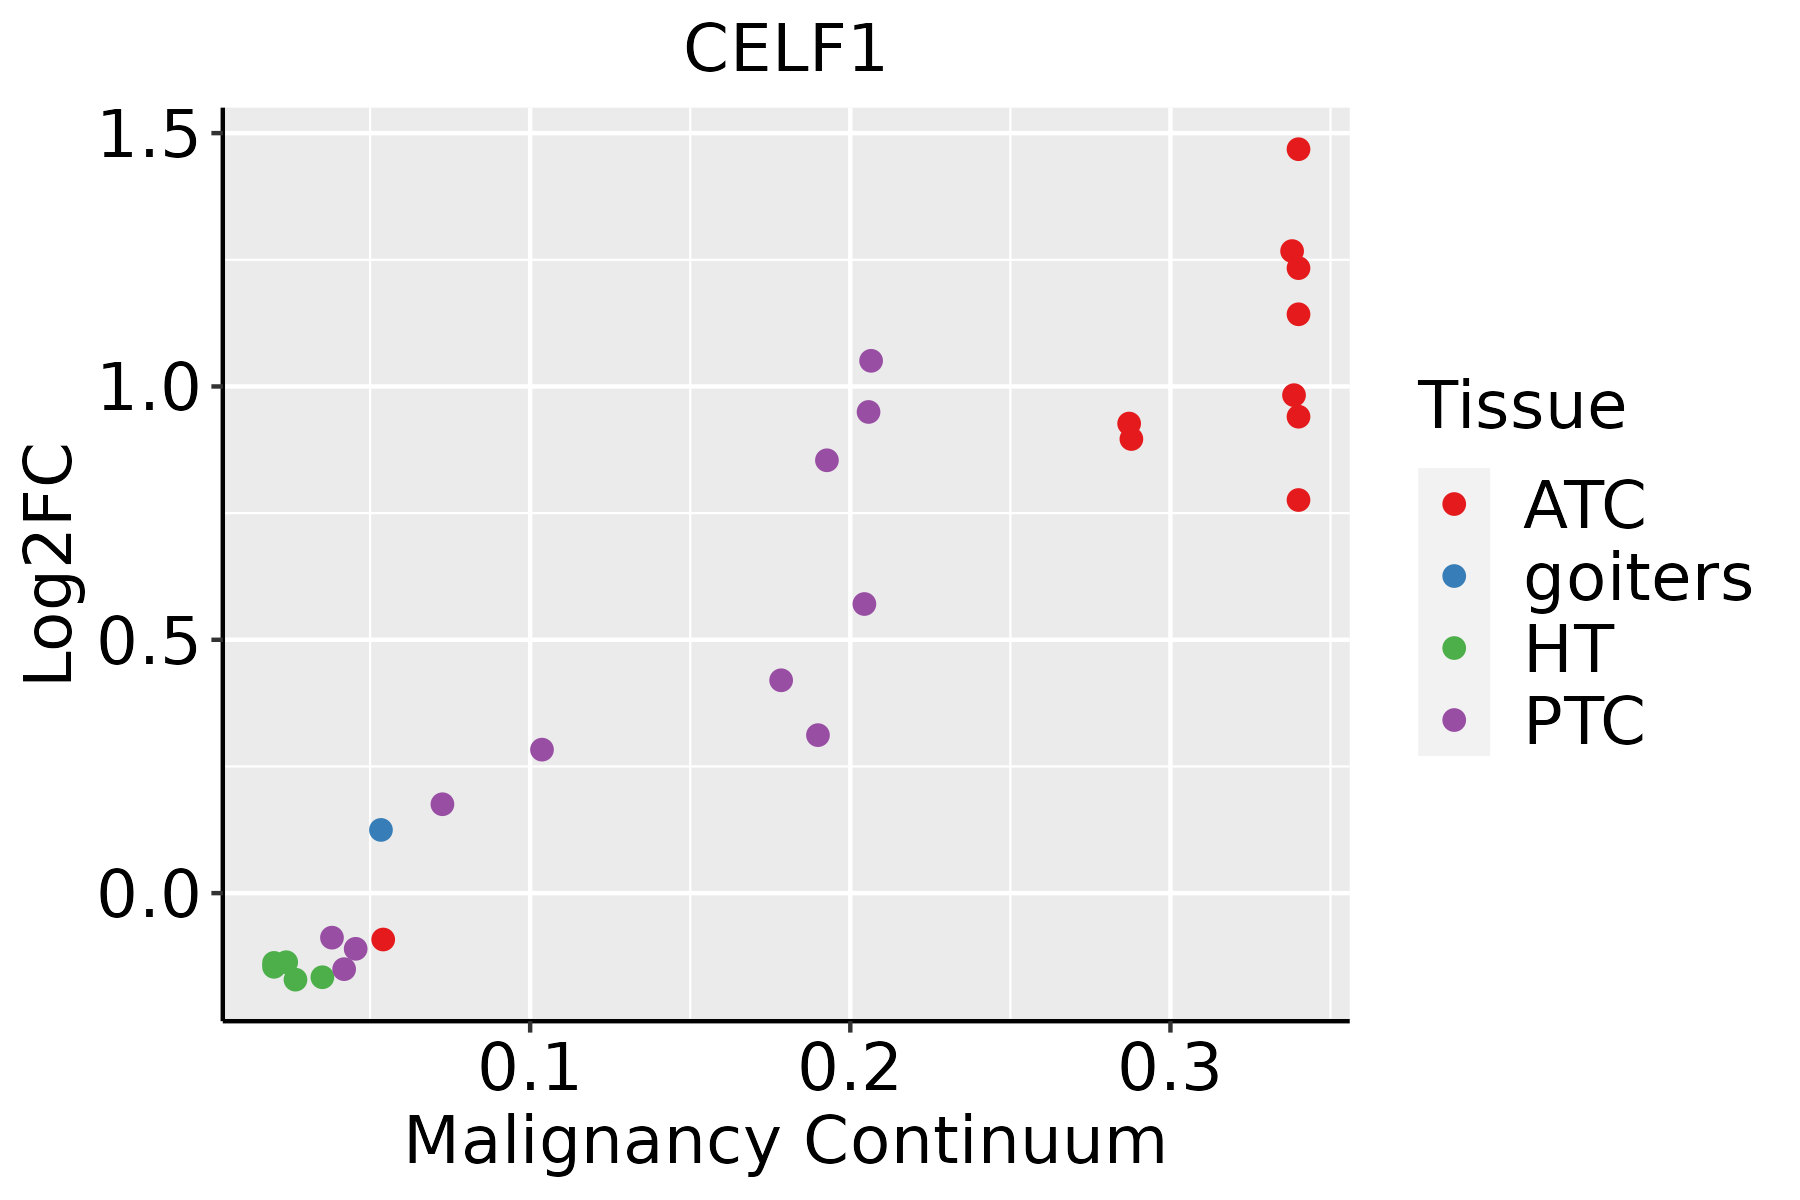 | ATC: Anaplastic thyroid cancer |
| HT: Hashimoto's thyroiditis | ||
| PTC: Papillary thyroid cancer |
| ∗log2FC in expression of this searched gene in stem-like cells from each diseased tissue sample relative to stem-like cells in normal samples in each tissue plotted against the malignancy continuum. Samples are colored based on if they are from different disease stage. |
Top |
Malignant transformation related pathway analysis |
| Find out the enriched GO biological processes and KEGG pathways involved in transition from healthy to precancer to cancer |
| Tissue | Disease Stage | Enriched GO biological Processes |
| Colorectum | AD |  |
| Colorectum | SER |  |
| Colorectum | MSS |  |
| Colorectum | MSI-H |  |
| Colorectum | FAP |  |
| ∗Top 15 enriched GO BP terms are showed in the bar plot of each disease state in each tissue. Each row represents a significant GO biological process which is colored according to the -log10(p.adjust). |
| Page: 1 2 3 4 5 6 7 8 9 |
| GO ID | Tissue | Disease Stage | Description | Gene Ratio | Bg Ratio | pvalue | p.adjust | Count |
| GO:000989610 | Cervix | CC | positive regulation of catabolic process | 109/2311 | 492/18723 | 5.26e-10 | 6.99e-08 | 109 |
| GO:003133110 | Cervix | CC | positive regulation of cellular catabolic process | 91/2311 | 427/18723 | 9.64e-08 | 5.25e-06 | 91 |
| GO:004348410 | Cervix | CC | regulation of RNA splicing | 42/2311 | 148/18723 | 1.25e-07 | 6.24e-06 | 42 |
| GO:00064029 | Cervix | CC | mRNA catabolic process | 56/2311 | 232/18723 | 4.81e-07 | 1.83e-05 | 56 |
| GO:19033119 | Cervix | CC | regulation of mRNA metabolic process | 64/2311 | 288/18723 | 1.71e-06 | 5.64e-05 | 64 |
| GO:00064019 | Cervix | CC | RNA catabolic process | 62/2311 | 278/18723 | 2.18e-06 | 6.56e-05 | 62 |
| GO:000641710 | Cervix | CC | regulation of translation | 89/2311 | 468/18723 | 1.86e-05 | 3.46e-04 | 89 |
| GO:002261310 | Cervix | CC | ribonucleoprotein complex biogenesis | 88/2311 | 463/18723 | 2.11e-05 | 3.82e-04 | 88 |
| GO:004802410 | Cervix | CC | regulation of mRNA splicing, via spliceosome | 28/2311 | 101/18723 | 2.41e-05 | 4.19e-04 | 28 |
| GO:002261810 | Cervix | CC | ribonucleoprotein complex assembly | 49/2311 | 220/18723 | 2.52e-05 | 4.29e-04 | 49 |
| GO:00507273 | Cervix | CC | regulation of inflammatory response | 75/2311 | 386/18723 | 3.95e-05 | 6.18e-04 | 75 |
| GO:007182610 | Cervix | CC | ribonucleoprotein complex subunit organization | 49/2311 | 227/18723 | 5.91e-05 | 8.54e-04 | 49 |
| GO:00506849 | Cervix | CC | regulation of mRNA processing | 33/2311 | 137/18723 | 1.06e-04 | 1.35e-03 | 33 |
| GO:00610139 | Cervix | CC | regulation of mRNA catabolic process | 38/2311 | 166/18723 | 1.07e-04 | 1.36e-03 | 38 |
| GO:00459277 | Cervix | CC | positive regulation of growth | 53/2311 | 259/18723 | 1.33e-04 | 1.64e-03 | 53 |
| GO:19033136 | Cervix | CC | positive regulation of mRNA metabolic process | 29/2311 | 118/18723 | 1.86e-04 | 2.18e-03 | 29 |
| GO:00467008 | Cervix | CC | heterocycle catabolic process | 80/2311 | 445/18723 | 3.23e-04 | 3.42e-03 | 80 |
| GO:00346559 | Cervix | CC | nucleobase-containing compound catabolic process | 74/2311 | 407/18723 | 3.77e-04 | 3.88e-03 | 74 |
| GO:00434889 | Cervix | CC | regulation of mRNA stability | 35/2311 | 158/18723 | 3.80e-04 | 3.89e-03 | 35 |
| GO:00611576 | Cervix | CC | mRNA destabilization | 22/2311 | 84/18723 | 4.18e-04 | 4.23e-03 | 22 |
| Page: 1 2 3 4 5 6 7 8 9 10 11 12 13 14 15 16 17 18 19 20 21 22 23 24 25 26 27 28 29 30 31 32 33 34 35 36 37 |
| Pathway ID | Tissue | Disease Stage | Description | Gene Ratio | Bg Ratio | pvalue | p.adjust | qvalue | Count |
| Page: 1 |
Top |
Cell-cell communication analysis |
| Identification of potential cell-cell interactions between two cell types and their ligand-receptor pairs for different disease states |
| Ligand | Receptor | LRpair | Pathway | Tissue | Disease Stage |
| Page: 1 |
Top |
Single-cell gene regulatory network inference analysis |
| Find out the significant the regulons (TFs) and the target genes of each regulon across cell types for different disease states |
| TF | Cell Type | Tissue | Disease Stage | Target Gene | RSS | Regulon Activity |
| ∗The dot plots of a searched regulon are shown for all cell subpopulations in each disease state of each tissue based on the regulon specific score inferred using pySCENIC and by calculating the average expression. |
| Page: 1 |
Top |
Somatic mutation of malignant transformation related genes |
| Annotation of somatic variants for genes involved in malignant transformation |
| Hugo Symbol | Variant Class | Variant Classification | dbSNP RS | HGVSc | HGVSp | HGVSp Short | SWISSPROT | BIOTYPE | SIFT | PolyPhen | Tumor Sample Barcode | Tissue | Histology | Sex | Age | Stage | Therapy Types | Drugs | Outcome |
| CELF1 | SNV | Missense_Mutation | novel | c.1075N>A | p.Gly359Ser | p.G359S | protein_coding | tolerated(0.28) | benign(0) | TCGA-5L-AAT0-01 | Breast | breast invasive carcinoma | Female | <65 | I/II | Hormone Therapy | tamoxiphen | SD | |
| CELF1 | SNV | Missense_Mutation | c.432N>C | p.Lys144Asn | p.K144N | protein_coding | deleterious(0) | probably_damaging(0.951) | TCGA-C8-A134-01 | Breast | breast invasive carcinoma | Female | <65 | I/II | Chemotherapy | 5-fluorouracil | CR | ||
| CELF1 | SNV | Missense_Mutation | novel | c.1475N>A | p.Gly492Asp | p.G492D | protein_coding | deleterious(0) | possibly_damaging(0.53) | TCGA-VS-A953-01 | Cervix | cervical & endocervical cancer | Female | <65 | I/II | Unknown | Unknown | PD | |
| CELF1 | SNV | Missense_Mutation | rs746684771 | c.470C>T | p.Ser157Leu | p.S157L | protein_coding | deleterious(0.02) | benign(0.257) | TCGA-A6-6781-01 | Colorectum | colon adenocarcinoma | Male | <65 | III/IV | Chemotherapy | oxaliplatin | SD | |
| CELF1 | SNV | Missense_Mutation | c.976G>T | p.Gly326Trp | p.G326W | protein_coding | deleterious(0.03) | probably_damaging(0.977) | TCGA-AA-3710-01 | Colorectum | colon adenocarcinoma | Female | >=65 | I/II | Unknown | Unknown | SD | ||
| CELF1 | SNV | Missense_Mutation | c.1058N>T | p.Thr353Met | p.T353M | protein_coding | tolerated(0.07) | possibly_damaging(0.458) | TCGA-AD-5900-01 | Colorectum | colon adenocarcinoma | Male | >=65 | I/II | Unknown | Unknown | SD | ||
| CELF1 | SNV | Missense_Mutation | c.563N>T | p.Ala188Val | p.A188V | protein_coding | deleterious(0) | probably_damaging(0.922) | TCGA-AD-6889-01 | Colorectum | colon adenocarcinoma | Male | >=65 | I/II | Chemotherapy | xeloda | PD | ||
| CELF1 | SNV | Missense_Mutation | c.509N>A | p.Pro170His | p.P170H | protein_coding | deleterious(0) | probably_damaging(0.961) | TCGA-D5-6540-01 | Colorectum | colon adenocarcinoma | Male | >=65 | I/II | Unknown | Unknown | SD | ||
| CELF1 | SNV | Missense_Mutation | novel | c.1414N>G | p.Phe472Val | p.F472V | protein_coding | deleterious(0) | probably_damaging(0.971) | TCGA-A5-A0G2-01 | Endometrium | uterine corpus endometrioid carcinoma | Female | <65 | III/IV | Unknown | Unknown | SD | |
| CELF1 | SNV | Missense_Mutation | novel | c.952N>A | p.Leu318Ile | p.L318I | protein_coding | tolerated(0.35) | probably_damaging(0.953) | TCGA-A5-A0G2-01 | Endometrium | uterine corpus endometrioid carcinoma | Female | <65 | III/IV | Unknown | Unknown | SD |
| Page: 1 2 3 4 |
Top |
Related drugs of malignant transformation related genes |
| Identification of chemicals and drugs interact with genes involved in malignant transfromation |
| (DGIdb 4.0) |
| Entrez ID | Symbol | Category | Interaction Types | Drug Claim Name | Drug Name | PMIDs |
| Page: 1 |

Copyright 2023-Present -The University of Texas Health Science Center at Houston |