
|
|||||
|
 | |
| |
| |
| |
| |
| |
|
Gene: CECR2 |
Gene summary for CECR2 |
| Gene information | Species | Human | Gene symbol | CECR2 | Gene ID | 27443 |
| Gene name | CECR2 histone acetyl-lysine reader | |
| Gene Alias | CECR2 | |
| Cytomap | 22q11.1-q11.21 | |
| Gene Type | protein-coding | GO ID | GO:0000003 | UniProtAcc | B7WPH3 |
Top |
Malignant transformation analysis |
| Identification of the aberrant gene expression in precancerous and cancerous lesions by comparing the gene expression of stem-like cells in diseased tissues with normal stem cells |
| Entrez ID | Symbol | Replicates | Species | Organ | Tissue | Adj P-value | Log2FC | Malignancy |
| 27443 | CECR2 | AEH-subject1 | Human | Endometrium | AEH | 6.63e-03 | 2.08e-01 | -0.3059 |
| 27443 | CECR2 | AEH-subject4 | Human | Endometrium | AEH | 3.73e-06 | 3.34e-01 | -0.2657 |
| 27443 | CECR2 | AEH-subject5 | Human | Endometrium | AEH | 3.29e-02 | -6.61e-02 | -0.2953 |
| 27443 | CECR2 | GSM6177622_NYU_UCEC3_lib1_lib1 | Human | Endometrium | EEC | 3.29e-02 | -6.61e-02 | -0.1917 |
| 27443 | CECR2 | LZE24T | Human | Esophagus | ESCC | 9.19e-06 | 1.50e-01 | 0.0596 |
| 27443 | CECR2 | P1T-E | Human | Esophagus | ESCC | 7.11e-04 | 2.22e-01 | 0.0875 |
| 27443 | CECR2 | P9T-E | Human | Esophagus | ESCC | 6.74e-06 | 1.49e-01 | 0.1131 |
| 27443 | CECR2 | P23T-E | Human | Esophagus | ESCC | 3.36e-03 | 1.26e-01 | 0.108 |
| 27443 | CECR2 | P26T-E | Human | Esophagus | ESCC | 2.93e-15 | 2.79e-01 | 0.1276 |
| 27443 | CECR2 | P28T-E | Human | Esophagus | ESCC | 1.78e-03 | 1.20e-01 | 0.1149 |
| 27443 | CECR2 | P36T-E | Human | Esophagus | ESCC | 7.72e-03 | 1.39e-01 | 0.1187 |
| 27443 | CECR2 | P39T-E | Human | Esophagus | ESCC | 3.97e-04 | 9.76e-02 | 0.0894 |
| 27443 | CECR2 | P49T-E | Human | Esophagus | ESCC | 1.65e-10 | 6.49e-01 | 0.1768 |
| 27443 | CECR2 | P56T-E | Human | Esophagus | ESCC | 2.17e-07 | 5.31e-01 | 0.1613 |
| 27443 | CECR2 | P62T-E | Human | Esophagus | ESCC | 1.04e-08 | 1.82e-01 | 0.1302 |
| 27443 | CECR2 | P65T-E | Human | Esophagus | ESCC | 1.22e-06 | 1.60e-01 | 0.0978 |
| 27443 | CECR2 | P74T-E | Human | Esophagus | ESCC | 5.32e-11 | 3.40e-01 | 0.1479 |
| 27443 | CECR2 | P127T-E | Human | Esophagus | ESCC | 1.81e-06 | 1.43e-01 | 0.0826 |
| 27443 | CECR2 | P130T-E | Human | Esophagus | ESCC | 4.31e-06 | 1.55e-01 | 0.1676 |
| 27443 | CECR2 | RNA-P25T1-P25T1-1 | Human | Lung | AIS | 1.89e-05 | 4.77e-01 | -0.2116 |
| Page: 1 2 |
| Tissue | Expression Dynamics | Abbreviation |
| Endometrium |  | AEH: Atypical endometrial hyperplasia |
| EEC: Endometrioid Cancer | ||
| Esophagus | 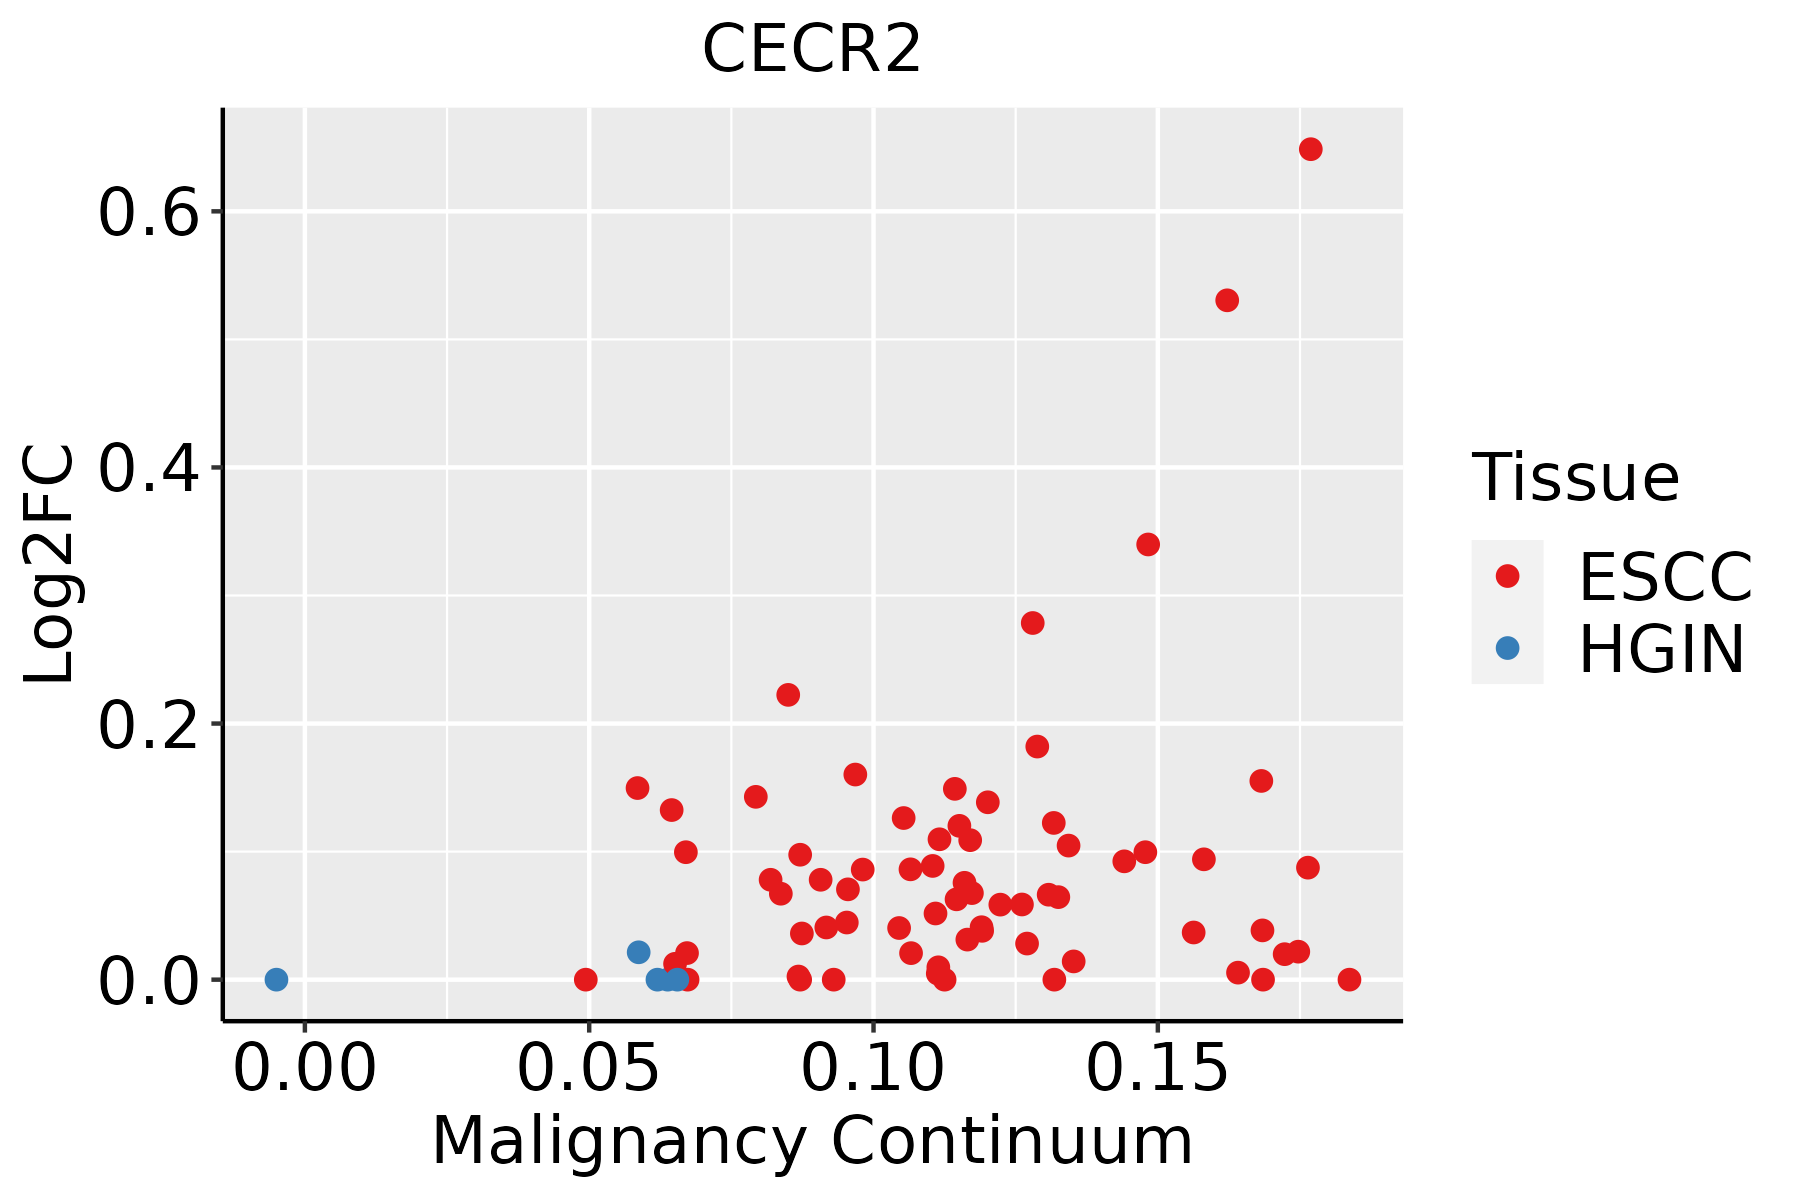 | ESCC: Esophageal squamous cell carcinoma |
| HGIN: High-grade intraepithelial neoplasias | ||
| LGIN: Low-grade intraepithelial neoplasias | ||
| Lung | 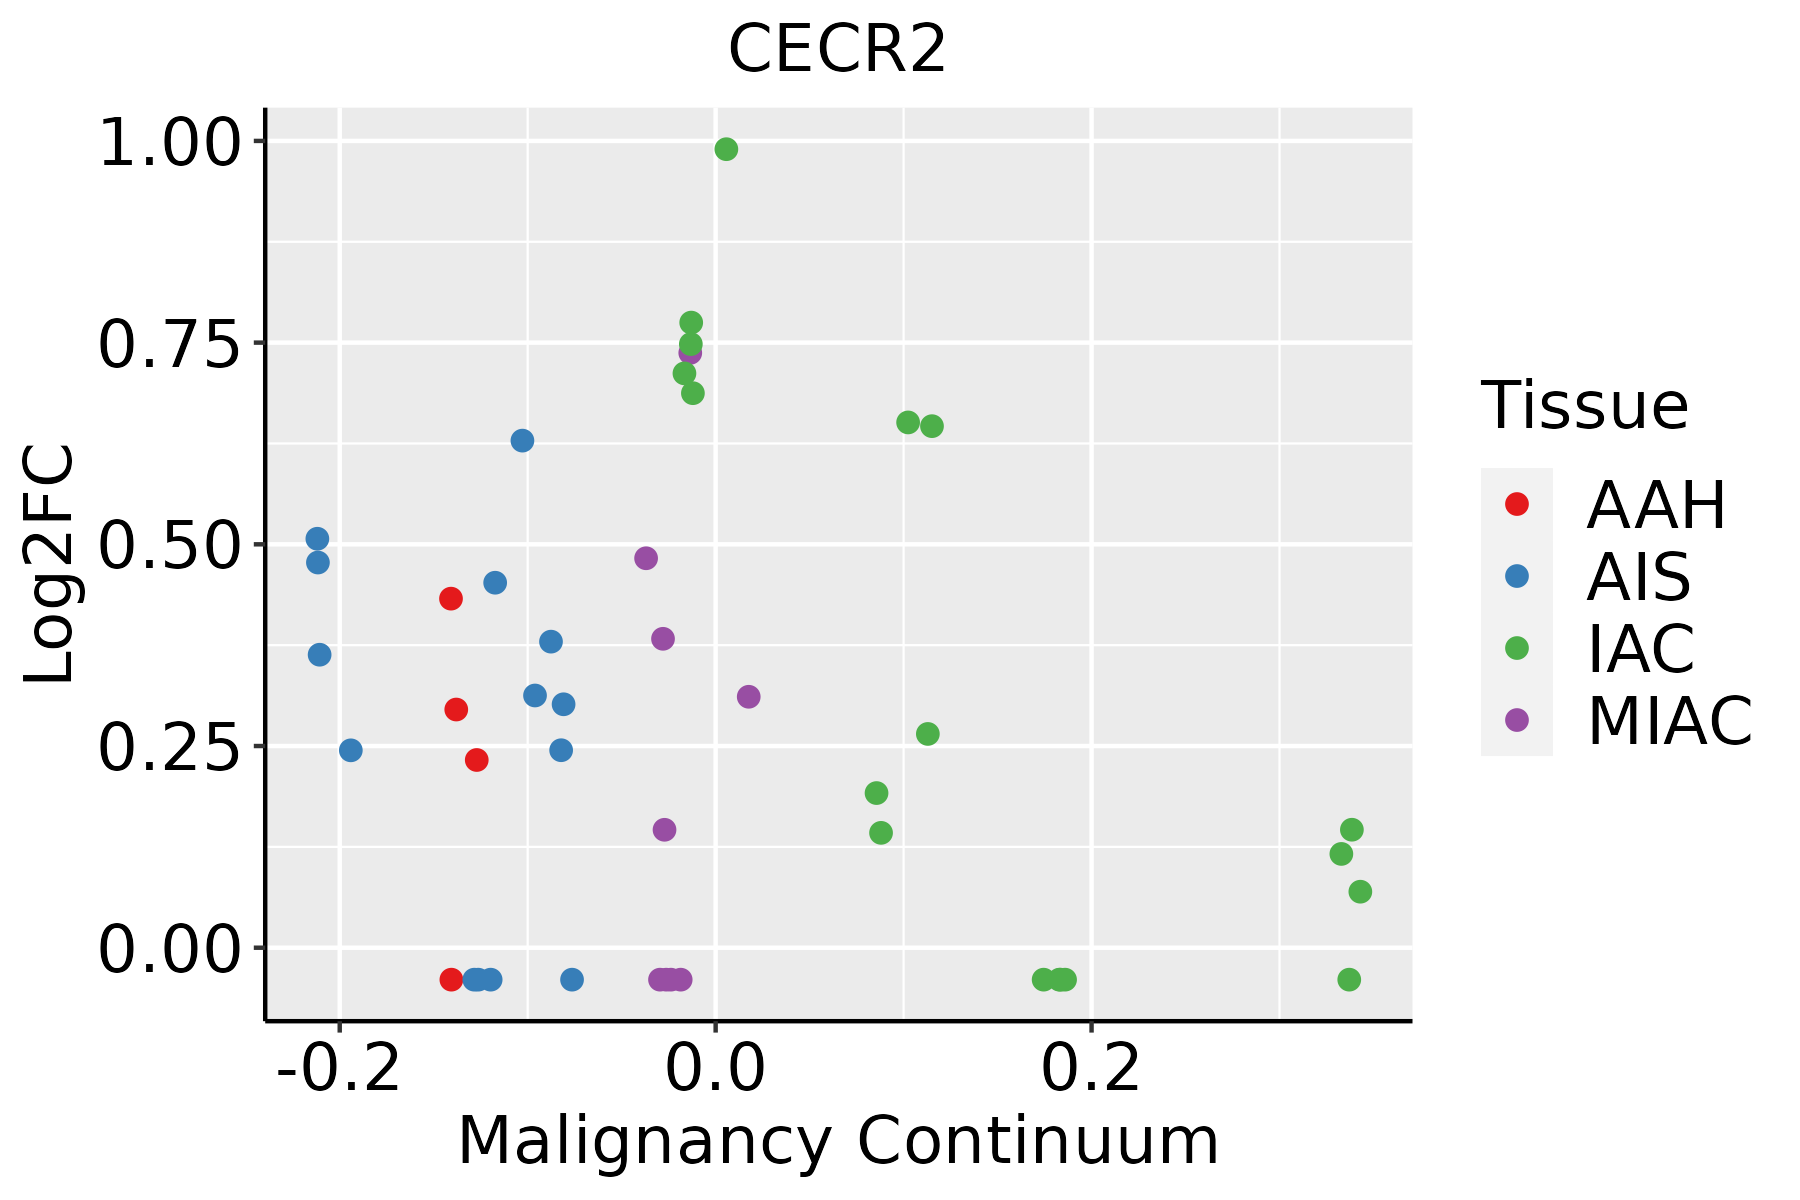 | AAH: Atypical adenomatous hyperplasia |
| AIS: Adenocarcinoma in situ | ||
| IAC: Invasive lung adenocarcinoma | ||
| MIA: Minimally invasive adenocarcinoma |
| ∗log2FC in expression of this searched gene in stem-like cells from each diseased tissue sample relative to stem-like cells in normal samples in each tissue plotted against the malignancy continuum. Samples are colored based on if they are from different disease stage. |
Top |
Malignant transformation related pathway analysis |
| Find out the enriched GO biological processes and KEGG pathways involved in transition from healthy to precancer to cancer |
| Tissue | Disease Stage | Enriched GO biological Processes |
| Colorectum | AD |  |
| Colorectum | SER |  |
| Colorectum | MSS |  |
| Colorectum | MSI-H |  |
| Colorectum | FAP |  |
| ∗Top 15 enriched GO BP terms are showed in the bar plot of each disease state in each tissue. Each row represents a significant GO biological process which is colored according to the -log10(p.adjust). |
| Page: 1 2 3 4 5 6 7 8 9 |
| GO ID | Tissue | Disease Stage | Description | Gene Ratio | Bg Ratio | pvalue | p.adjust | Count |
| GO:00009108 | Endometrium | AEH | cytokinesis | 40/2100 | 173/18723 | 6.01e-06 | 1.49e-04 | 40 |
| GO:00605627 | Endometrium | AEH | epithelial tube morphogenesis | 63/2100 | 325/18723 | 9.63e-06 | 2.23e-04 | 63 |
| GO:002241115 | Endometrium | AEH | cellular component disassembly | 80/2100 | 443/18723 | 1.07e-05 | 2.45e-04 | 80 |
| GO:003465510 | Endometrium | AEH | nucleobase-containing compound catabolic process | 74/2100 | 407/18723 | 1.78e-05 | 3.65e-04 | 74 |
| GO:004427010 | Endometrium | AEH | cellular nitrogen compound catabolic process | 80/2100 | 451/18723 | 2.09e-05 | 4.13e-04 | 80 |
| GO:00467009 | Endometrium | AEH | heterocycle catabolic process | 79/2100 | 445/18723 | 2.27e-05 | 4.35e-04 | 79 |
| GO:00194399 | Endometrium | AEH | aromatic compound catabolic process | 80/2100 | 467/18723 | 7.21e-05 | 1.10e-03 | 80 |
| GO:19013619 | Endometrium | AEH | organic cyclic compound catabolic process | 83/2100 | 495/18723 | 1.13e-04 | 1.60e-03 | 83 |
| GO:00616403 | Endometrium | AEH | cytoskeleton-dependent cytokinesis | 24/2100 | 100/18723 | 2.27e-04 | 2.75e-03 | 24 |
| GO:00063258 | Endometrium | AEH | chromatin organization | 64/2100 | 409/18723 | 3.69e-03 | 2.52e-02 | 64 |
| GO:00163313 | Endometrium | AEH | morphogenesis of embryonic epithelium | 27/2100 | 147/18723 | 6.70e-03 | 3.94e-02 | 27 |
| GO:00351488 | Endometrium | AEH | tube formation | 27/2100 | 148/18723 | 7.34e-03 | 4.18e-02 | 27 |
| GO:002241116 | Endometrium | EEC | cellular component disassembly | 82/2168 | 443/18723 | 1.06e-05 | 2.26e-04 | 82 |
| GO:004427013 | Endometrium | EEC | cellular nitrogen compound catabolic process | 83/2168 | 451/18723 | 1.17e-05 | 2.43e-04 | 83 |
| GO:004670013 | Endometrium | EEC | heterocycle catabolic process | 82/2168 | 445/18723 | 1.26e-05 | 2.55e-04 | 82 |
| GO:000091013 | Endometrium | EEC | cytokinesis | 40/2168 | 173/18723 | 1.29e-05 | 2.60e-04 | 40 |
| GO:006056213 | Endometrium | EEC | epithelial tube morphogenesis | 64/2168 | 325/18723 | 1.35e-05 | 2.70e-04 | 64 |
| GO:003465514 | Endometrium | EEC | nucleobase-containing compound catabolic process | 76/2168 | 407/18723 | 1.61e-05 | 3.12e-04 | 76 |
| GO:001943913 | Endometrium | EEC | aromatic compound catabolic process | 83/2168 | 467/18723 | 4.32e-05 | 7.10e-04 | 83 |
| GO:190136113 | Endometrium | EEC | organic cyclic compound catabolic process | 86/2168 | 495/18723 | 7.31e-05 | 1.07e-03 | 86 |
| Page: 1 2 3 4 |
| Pathway ID | Tissue | Disease Stage | Description | Gene Ratio | Bg Ratio | pvalue | p.adjust | qvalue | Count |
| Page: 1 |
Top |
Cell-cell communication analysis |
| Identification of potential cell-cell interactions between two cell types and their ligand-receptor pairs for different disease states |
| Ligand | Receptor | LRpair | Pathway | Tissue | Disease Stage |
| Page: 1 |
Top |
Single-cell gene regulatory network inference analysis |
| Find out the significant the regulons (TFs) and the target genes of each regulon across cell types for different disease states |
| TF | Cell Type | Tissue | Disease Stage | Target Gene | RSS | Regulon Activity |
| ∗The dot plots of a searched regulon are shown for all cell subpopulations in each disease state of each tissue based on the regulon specific score inferred using pySCENIC and by calculating the average expression. |
| Page: 1 |
Top |
Somatic mutation of malignant transformation related genes |
| Annotation of somatic variants for genes involved in malignant transformation |
| Hugo Symbol | Variant Class | Variant Classification | dbSNP RS | HGVSc | HGVSp | HGVSp Short | SWISSPROT | BIOTYPE | SIFT | PolyPhen | Tumor Sample Barcode | Tissue | Histology | Sex | Age | Stage | Therapy Types | Drugs | Outcome |
| CECR2 | SNV | Missense_Mutation | novel | c.3391N>C | p.Glu1131Gln | p.E1131Q | protein_coding | tolerated(0.05) | probably_damaging(0.994) | TCGA-5L-AAT1-01 | Breast | breast invasive carcinoma | Female | <65 | III/IV | Hormone Therapy | letrozol | SD | |
| CECR2 | SNV | Missense_Mutation | rs749447312 | c.799N>A | p.Val267Ile | p.V267I | protein_coding | deleterious(0.04) | possibly_damaging(0.872) | TCGA-A1-A0SF-01 | Breast | breast invasive carcinoma | Female | <65 | I/II | Chemotherapy | tc | SD | |
| CECR2 | SNV | Missense_Mutation | c.3037N>T | p.Arg1013Cys | p.R1013C | protein_coding | deleterious(0.01) | probably_damaging(0.996) | TCGA-A1-A0SG-01 | Breast | breast invasive carcinoma | Female | <65 | I/II | Chemotherapy | SD | |||
| CECR2 | SNV | Missense_Mutation | c.3379N>C | p.Glu1127Gln | p.E1127Q | protein_coding | deleterious(0) | probably_damaging(0.994) | TCGA-A2-A0YK-01 | Breast | breast invasive carcinoma | Female | <65 | I/II | Chemotherapy | cytoxan | SD | ||
| CECR2 | SNV | Missense_Mutation | novel | c.1867T>G | p.Leu623Val | p.L623V | protein_coding | tolerated_low_confidence(0.09) | benign(0.048) | TCGA-AN-A046-01 | Breast | breast invasive carcinoma | Female | >=65 | I/II | Unknown | Unknown | SD | |
| CECR2 | SNV | Missense_Mutation | c.3104G>A | p.Arg1035Gln | p.R1035Q | protein_coding | tolerated(0.2) | benign(0.097) | TCGA-AN-A046-01 | Breast | breast invasive carcinoma | Female | >=65 | I/II | Unknown | Unknown | SD | ||
| CECR2 | SNV | Missense_Mutation | c.3281C>A | p.Ser1094Tyr | p.S1094Y | protein_coding | deleterious(0) | possibly_damaging(0.733) | TCGA-AN-A046-01 | Breast | breast invasive carcinoma | Female | >=65 | I/II | Unknown | Unknown | SD | ||
| CECR2 | SNV | Missense_Mutation | novel | c.3740G>T | p.Arg1247Ile | p.R1247I | protein_coding | tolerated_low_confidence(0.05) | benign(0) | TCGA-AN-A046-01 | Breast | breast invasive carcinoma | Female | >=65 | I/II | Unknown | Unknown | SD | |
| CECR2 | SNV | Missense_Mutation | rs771332466 | c.1918N>T | p.Arg640Cys | p.R640C | protein_coding | deleterious(0) | possibly_damaging(0.72) | TCGA-D8-A145-01 | Breast | breast invasive carcinoma | Female | >=65 | I/II | Hormone Therapy | tamoxiphen | SD | |
| CECR2 | SNV | Missense_Mutation | c.3412C>A | p.His1138Asn | p.H1138N | protein_coding | deleterious(0) | probably_damaging(0.98) | TCGA-D8-A1XW-01 | Breast | breast invasive carcinoma | Female | <65 | I/II | Chemotherapy | adriamycin+cyclophosphamide | SD |
| Page: 1 2 3 4 5 6 7 8 9 10 11 12 13 14 15 16 |
Top |
Related drugs of malignant transformation related genes |
| Identification of chemicals and drugs interact with genes involved in malignant transfromation |
| (DGIdb 4.0) |
| Entrez ID | Symbol | Category | Interaction Types | Drug Claim Name | Drug Name | PMIDs |
| 27443 | CECR2 | NA | inhibitor | 252827481 | ||
| 27443 | CECR2 | NA | inhibitor | 310264732 |
| Page: 1 |

Copyright 2023-Present -The University of Texas Health Science Center at Houston |