
|
|||||
|
 | |
| |
| |
| |
| |
| |
|
Gene: CECR1 |
Gene summary for CECR1 |
| Gene information | Species | Human | Gene symbol | CECR1 | Gene ID | 51816 |
| Gene name | adenosine deaminase 2 | |
| Gene Alias | ADGF | |
| Cytomap | 22q11.1 | |
| Gene Type | protein-coding | GO ID | GO:0006139 | UniProtAcc | Q9NZK5 |
Top |
Malignant transformation analysis |
| Identification of the aberrant gene expression in precancerous and cancerous lesions by comparing the gene expression of stem-like cells in diseased tissues with normal stem cells |
| Entrez ID | Symbol | Replicates | Species | Organ | Tissue | Adj P-value | Log2FC | Malignancy |
| 51816 | CECR1 | GSM5353216_PA_PB1A_Pool_1_3_S50_L002 | Human | Prostate | Tumor | 2.22e-03 | 5.24e-01 | 0.159 |
| 51816 | CECR1 | GSM5353218_PA_PB1B_Pool_1_2_S74_L003 | Human | Prostate | Tumor | 6.49e-08 | 7.11e-01 | 0.1479 |
| 51816 | CECR1 | GSM5353220_PA_PB1B_Pool_3_S51_L002 | Human | Prostate | Tumor | 2.22e-03 | 4.81e-01 | 0.1531 |
| 51816 | CECR1 | GSM5353226_PA_PR5196-2_Pool_1_2_3_S54_L002 | Human | Prostate | Tumor | 4.40e-03 | 4.93e-01 | 0.159 |
| Page: 1 |
| Tissue | Expression Dynamics | Abbreviation |
| Prostate | 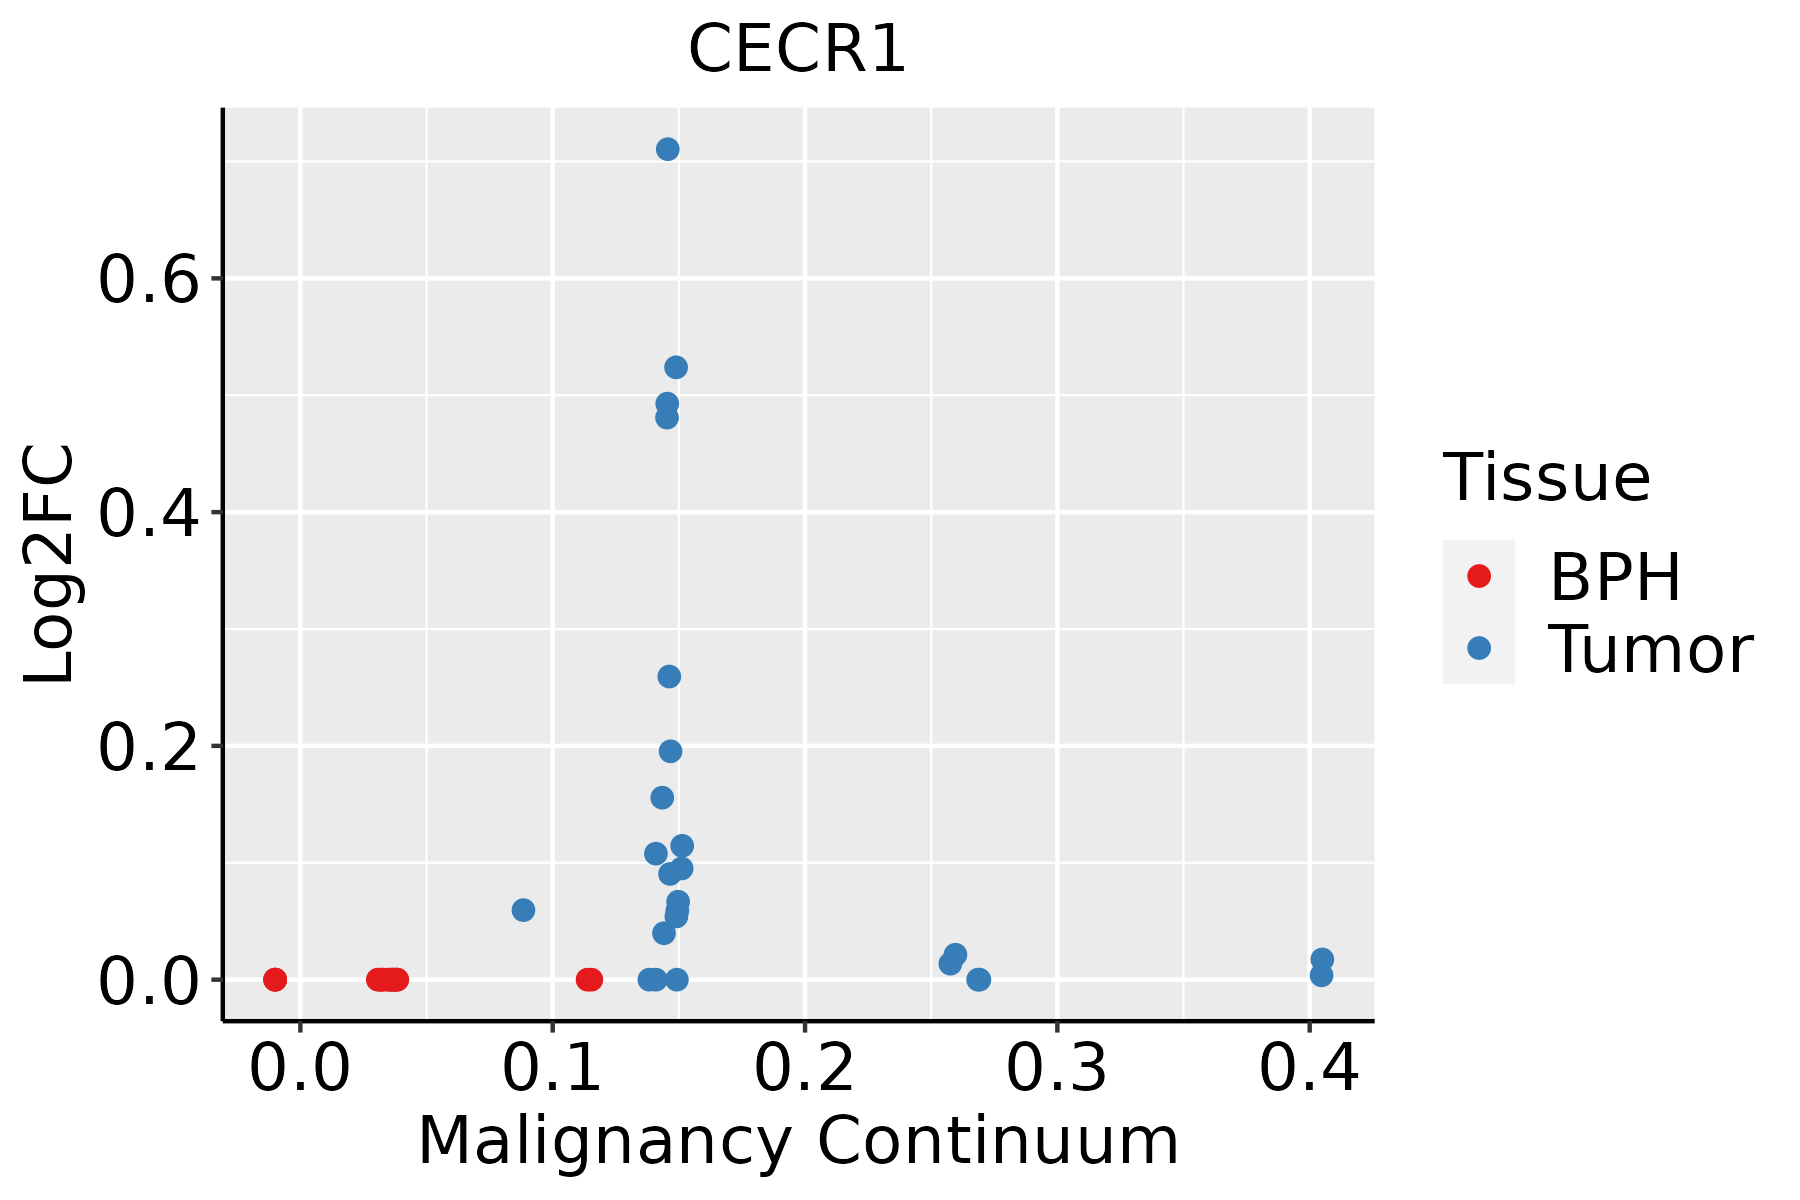 | BPH: Benign Prostatic Hyperplasia |
| ∗log2FC in expression of this searched gene in stem-like cells from each diseased tissue sample relative to stem-like cells in normal samples in each tissue plotted against the malignancy continuum. Samples are colored based on if they are from different disease stage. |
Top |
Malignant transformation related pathway analysis |
| Find out the enriched GO biological processes and KEGG pathways involved in transition from healthy to precancer to cancer |
| Tissue | Disease Stage | Enriched GO biological Processes |
| Colorectum | AD |  |
| Colorectum | SER |  |
| Colorectum | MSS |  |
| Colorectum | MSI-H |  |
| Colorectum | FAP |  |
| ∗Top 15 enriched GO BP terms are showed in the bar plot of each disease state in each tissue. Each row represents a significant GO biological process which is colored according to the -log10(p.adjust). |
| Page: 1 2 3 4 5 6 7 8 9 |
| GO ID | Tissue | Disease Stage | Description | Gene Ratio | Bg Ratio | pvalue | p.adjust | Count |
| Page: 1 |
| Pathway ID | Tissue | Disease Stage | Description | Gene Ratio | Bg Ratio | pvalue | p.adjust | qvalue | Count |
| Page: 1 |
Top |
Cell-cell communication analysis |
| Identification of potential cell-cell interactions between two cell types and their ligand-receptor pairs for different disease states |
| Ligand | Receptor | LRpair | Pathway | Tissue | Disease Stage |
| Page: 1 |
Top |
Single-cell gene regulatory network inference analysis |
| Find out the significant the regulons (TFs) and the target genes of each regulon across cell types for different disease states |
| TF | Cell Type | Tissue | Disease Stage | Target Gene | RSS | Regulon Activity |
| ∗The dot plots of a searched regulon are shown for all cell subpopulations in each disease state of each tissue based on the regulon specific score inferred using pySCENIC and by calculating the average expression. |
| Page: 1 |
Top |
Somatic mutation of malignant transformation related genes |
| Annotation of somatic variants for genes involved in malignant transformation |
| Hugo Symbol | Variant Class | Variant Classification | dbSNP RS | HGVSc | HGVSp | HGVSp Short | SWISSPROT | BIOTYPE | SIFT | PolyPhen | Tumor Sample Barcode | Tissue | Histology | Sex | Age | Stage | Therapy Types | Drugs | Outcome |
| CECR1 | SNV | Missense_Mutation | c.1055N>T | p.Pro352Leu | p.P352L | Q9NZK5 | protein_coding | deleterious(0) | probably_damaging(1) | TCGA-BH-A0HF-01 | Breast | breast invasive carcinoma | Female | >=65 | I/II | Hormone Therapy | arimidex | SD | |
| CECR1 | insertion | Nonsense_Mutation | novel | c.981_982insACAAGGAAGCTCTGATGATCCCCGCCAAGGATGGCGTTAAGC | p.His327_Glu328insThrArgLysLeuTerTerSerProProArgMetAlaLeuSer | p.H327_E328insTRKL**SPPRMALS | Q9NZK5 | protein_coding | TCGA-A2-A0CQ-01 | Breast | breast invasive carcinoma | Female | <65 | I/II | Chemotherapy | adriamycin | SD | ||
| CECR1 | SNV | Missense_Mutation | novel | c.519N>C | p.Gln173His | p.Q173H | Q9NZK5 | protein_coding | tolerated(0.16) | benign(0.269) | TCGA-JW-A5VL-01 | Cervix | cervical & endocervical cancer | Female | <65 | I/II | Unknown | Unknown | SD |
| CECR1 | SNV | Missense_Mutation | c.1436N>A | p.Ser479Tyr | p.S479Y | Q9NZK5 | protein_coding | deleterious(0) | probably_damaging(1) | TCGA-AA-3510-01 | Colorectum | colon adenocarcinoma | Male | >=65 | I/II | Unknown | Unknown | SD | |
| CECR1 | SNV | Missense_Mutation | c.692N>A | p.Ser231Asn | p.S231N | Q9NZK5 | protein_coding | deleterious(0) | benign(0.197) | TCGA-AA-3815-01 | Colorectum | colon adenocarcinoma | Female | >=65 | I/II | Unknown | Unknown | SD | |
| CECR1 | SNV | Missense_Mutation | c.1040N>T | p.Asp347Val | p.D347V | Q9NZK5 | protein_coding | tolerated(0.29) | benign(0.024) | TCGA-AD-6548-01 | Colorectum | colon adenocarcinoma | Female | >=65 | I/II | Unknown | Unknown | SD | |
| CECR1 | SNV | Missense_Mutation | c.596A>C | p.Asn199Thr | p.N199T | Q9NZK5 | protein_coding | tolerated(0.41) | benign(0.003) | TCGA-AM-5821-01 | Colorectum | colon adenocarcinoma | Female | >=65 | I/II | Unknown | Unknown | SD | |
| CECR1 | SNV | Missense_Mutation | rs750868279 | c.740N>T | p.Ala247Val | p.A247V | Q9NZK5 | protein_coding | tolerated(0.08) | benign(0.398) | TCGA-AZ-4313-01 | Colorectum | colon adenocarcinoma | Female | <65 | I/II | Unknown | Unknown | SD |
| CECR1 | SNV | Missense_Mutation | novel | c.620N>G | p.Phe207Cys | p.F207C | Q9NZK5 | protein_coding | deleterious(0) | probably_damaging(0.998) | TCGA-CA-6717-01 | Colorectum | colon adenocarcinoma | Male | <65 | I/II | Chemotherapy | oxaliplatin | CR |
| CECR1 | SNV | Missense_Mutation | c.332T>C | p.Leu111Ser | p.L111S | Q9NZK5 | protein_coding | deleterious(0) | probably_damaging(0.998) | TCGA-CM-4746-01 | Colorectum | colon adenocarcinoma | Male | <65 | I/II | Unknown | Unknown | SD |
| Page: 1 2 3 4 5 6 7 |
Top |
Related drugs of malignant transformation related genes |
| Identification of chemicals and drugs interact with genes involved in malignant transfromation |
| (DGIdb 4.0) |
| Entrez ID | Symbol | Category | Interaction Types | Drug Claim Name | Drug Name | PMIDs |
| Page: 1 |

Copyright 2023-Present -The University of Texas Health Science Center at Houston |