
|
|||||
|
 | |
| |
| |
| |
| |
| |
|
Gene: CEBPZOS |
Gene summary for CEBPZOS |
| Gene information | Species | Human | Gene symbol | CEBPZOS | Gene ID | 100505876 |
| Gene name | CEBPZ opposite strand | |
| Gene Alias | CEBPZ-AS1 | |
| Cytomap | 2p22.2 | |
| Gene Type | protein-coding | GO ID | GO:0005575 | UniProtAcc | A8MTT3 |
Top |
Malignant transformation analysis |
| Identification of the aberrant gene expression in precancerous and cancerous lesions by comparing the gene expression of stem-like cells in diseased tissues with normal stem cells |
| Entrez ID | Symbol | Replicates | Species | Organ | Tissue | Adj P-value | Log2FC | Malignancy |
| 100505876 | CEBPZOS | LZE4T | Human | Esophagus | ESCC | 5.92e-15 | 7.37e-01 | 0.0811 |
| 100505876 | CEBPZOS | LZE7T | Human | Esophagus | ESCC | 2.30e-08 | 6.24e-01 | 0.0667 |
| 100505876 | CEBPZOS | LZE8T | Human | Esophagus | ESCC | 6.30e-10 | 9.42e-02 | 0.067 |
| 100505876 | CEBPZOS | LZE20T | Human | Esophagus | ESCC | 7.85e-07 | 1.72e-01 | 0.0662 |
| 100505876 | CEBPZOS | LZE22T | Human | Esophagus | ESCC | 4.85e-03 | 7.25e-01 | 0.068 |
| 100505876 | CEBPZOS | LZE24T | Human | Esophagus | ESCC | 2.67e-11 | 4.89e-01 | 0.0596 |
| 100505876 | CEBPZOS | LZE21T | Human | Esophagus | ESCC | 2.80e-06 | 6.89e-01 | 0.0655 |
| 100505876 | CEBPZOS | LZE6T | Human | Esophagus | ESCC | 1.48e-02 | 3.15e-01 | 0.0845 |
| 100505876 | CEBPZOS | P1T-E | Human | Esophagus | ESCC | 2.32e-04 | 5.74e-01 | 0.0875 |
| 100505876 | CEBPZOS | P2T-E | Human | Esophagus | ESCC | 5.56e-37 | 7.23e-01 | 0.1177 |
| 100505876 | CEBPZOS | P4T-E | Human | Esophagus | ESCC | 8.68e-32 | 1.02e+00 | 0.1323 |
| 100505876 | CEBPZOS | P5T-E | Human | Esophagus | ESCC | 8.99e-30 | 5.94e-01 | 0.1327 |
| 100505876 | CEBPZOS | P8T-E | Human | Esophagus | ESCC | 3.10e-37 | 6.67e-01 | 0.0889 |
| 100505876 | CEBPZOS | P9T-E | Human | Esophagus | ESCC | 3.10e-17 | 5.25e-01 | 0.1131 |
| 100505876 | CEBPZOS | P10T-E | Human | Esophagus | ESCC | 5.86e-36 | 7.93e-01 | 0.116 |
| 100505876 | CEBPZOS | P11T-E | Human | Esophagus | ESCC | 3.07e-09 | 7.71e-01 | 0.1426 |
| 100505876 | CEBPZOS | P12T-E | Human | Esophagus | ESCC | 1.17e-30 | 5.86e-01 | 0.1122 |
| 100505876 | CEBPZOS | P15T-E | Human | Esophagus | ESCC | 9.70e-35 | 9.10e-01 | 0.1149 |
| 100505876 | CEBPZOS | P16T-E | Human | Esophagus | ESCC | 5.10e-27 | 5.94e-01 | 0.1153 |
| 100505876 | CEBPZOS | P17T-E | Human | Esophagus | ESCC | 6.13e-06 | 4.96e-01 | 0.1278 |
| Page: 1 2 3 4 5 |
| Tissue | Expression Dynamics | Abbreviation |
| Esophagus |  | ESCC: Esophageal squamous cell carcinoma |
| HGIN: High-grade intraepithelial neoplasias | ||
| LGIN: Low-grade intraepithelial neoplasias | ||
| Liver | 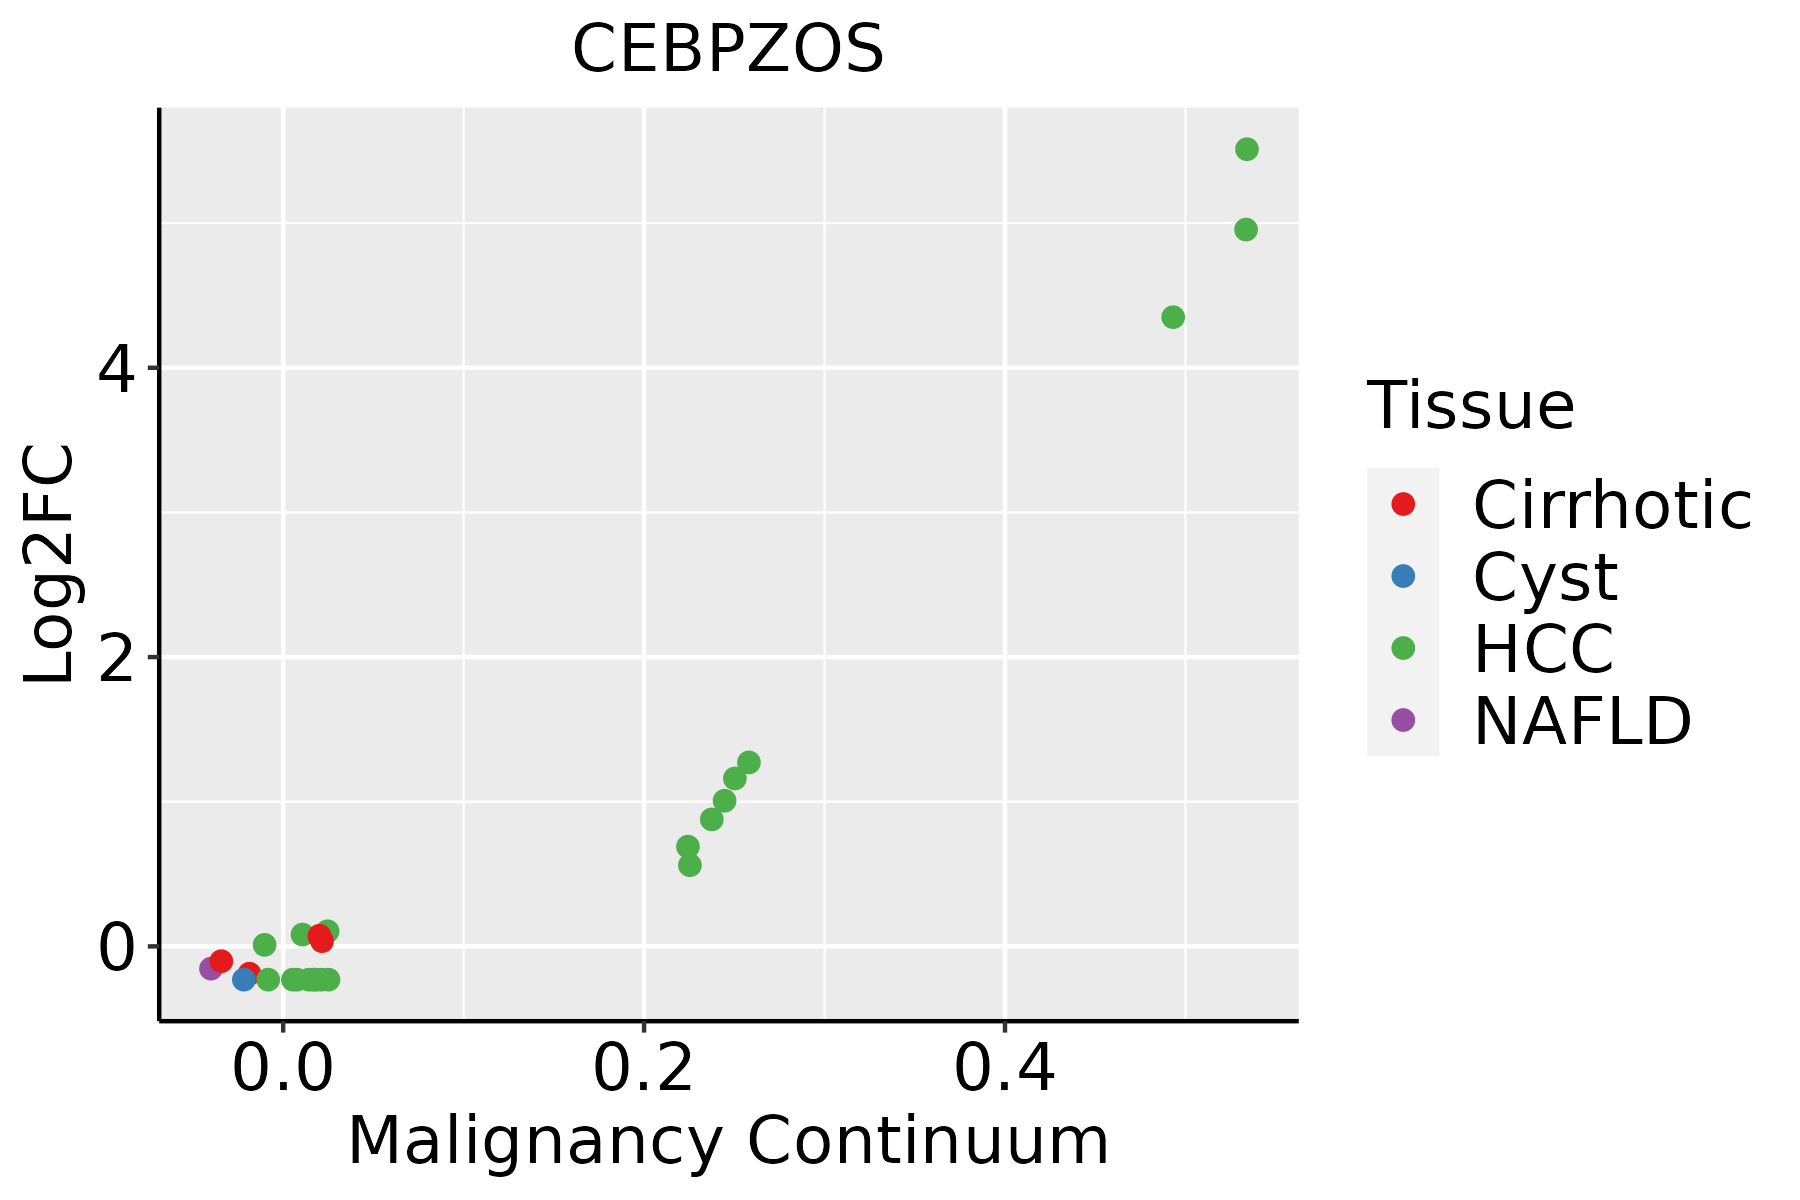 | HCC: Hepatocellular carcinoma |
| NAFLD: Non-alcoholic fatty liver disease | ||
| Oral Cavity | 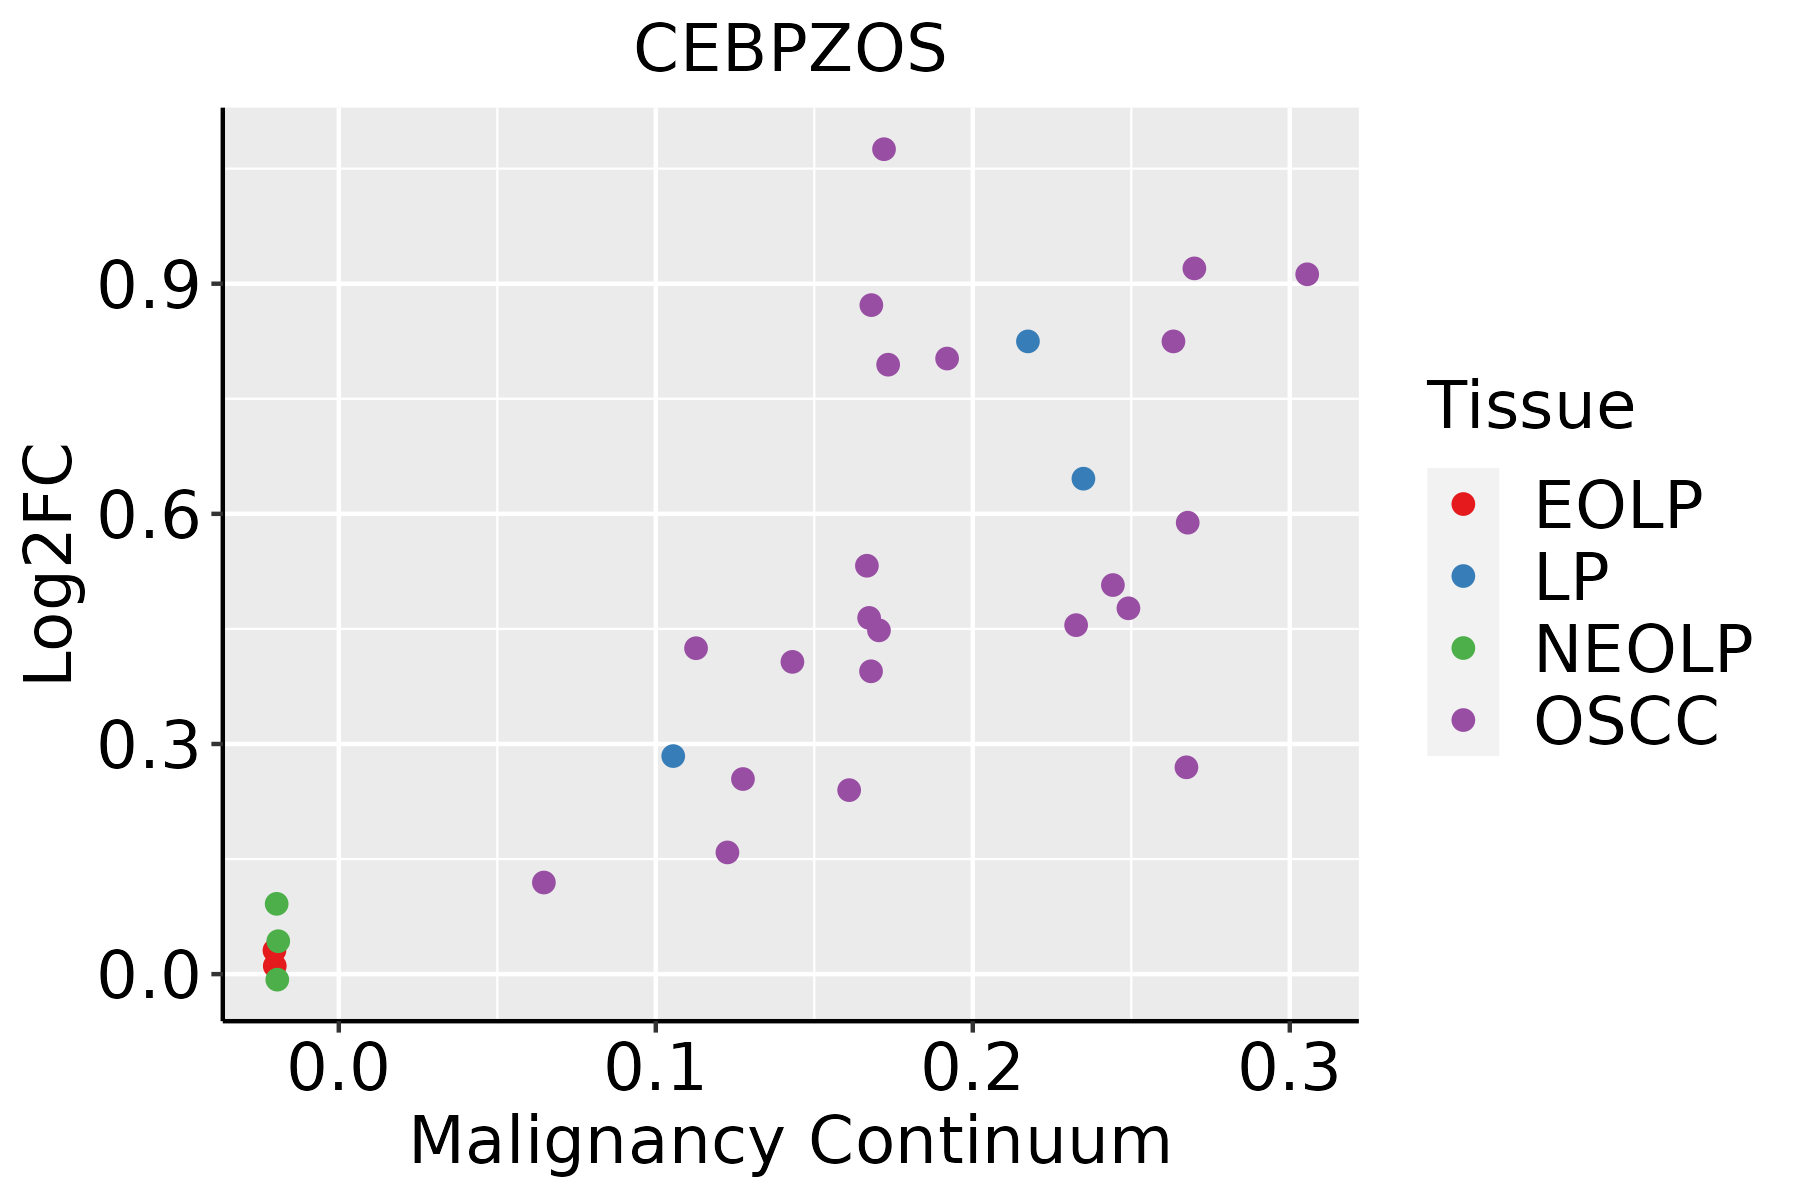 | EOLP: Erosive Oral lichen planus |
| LP: leukoplakia | ||
| NEOLP: Non-erosive oral lichen planus | ||
| OSCC: Oral squamous cell carcinoma |
| ∗log2FC in expression of this searched gene in stem-like cells from each diseased tissue sample relative to stem-like cells in normal samples in each tissue plotted against the malignancy continuum. Samples are colored based on if they are from different disease stage. |
Top |
Malignant transformation related pathway analysis |
| Find out the enriched GO biological processes and KEGG pathways involved in transition from healthy to precancer to cancer |
| Tissue | Disease Stage | Enriched GO biological Processes |
| Colorectum | AD |  |
| Colorectum | SER |  |
| Colorectum | MSS |  |
| Colorectum | MSI-H |  |
| Colorectum | FAP |  |
| ∗Top 15 enriched GO BP terms are showed in the bar plot of each disease state in each tissue. Each row represents a significant GO biological process which is colored according to the -log10(p.adjust). |
| Page: 1 2 3 4 5 6 7 8 9 |
| GO ID | Tissue | Disease Stage | Description | Gene Ratio | Bg Ratio | pvalue | p.adjust | Count |
| Page: 1 |
| Pathway ID | Tissue | Disease Stage | Description | Gene Ratio | Bg Ratio | pvalue | p.adjust | qvalue | Count |
| Page: 1 |
Top |
Cell-cell communication analysis |
| Identification of potential cell-cell interactions between two cell types and their ligand-receptor pairs for different disease states |
| Ligand | Receptor | LRpair | Pathway | Tissue | Disease Stage |
| Page: 1 |
Top |
Single-cell gene regulatory network inference analysis |
| Find out the significant the regulons (TFs) and the target genes of each regulon across cell types for different disease states |
| TF | Cell Type | Tissue | Disease Stage | Target Gene | RSS | Regulon Activity |
| ∗The dot plots of a searched regulon are shown for all cell subpopulations in each disease state of each tissue based on the regulon specific score inferred using pySCENIC and by calculating the average expression. |
| Page: 1 |
Top |
Somatic mutation of malignant transformation related genes |
| Annotation of somatic variants for genes involved in malignant transformation |
| Hugo Symbol | Variant Class | Variant Classification | dbSNP RS | HGVSc | HGVSp | HGVSp Short | SWISSPROT | BIOTYPE | SIFT | PolyPhen | Tumor Sample Barcode | Tissue | Histology | Sex | Age | Stage | Therapy Types | Drugs | Outcome |
| CEBPZOS | SNV | Missense_Mutation | novel | c.203N>A | p.Arg68Lys | p.R68K | A8MTT3 | protein_coding | deleterious(0) | probably_damaging(0.921) | TCGA-BH-A0HF-01 | Breast | breast invasive carcinoma | Female | >=65 | I/II | Hormone Therapy | arimidex | SD |
| CEBPZOS | SNV | Missense_Mutation | novel | c.58G>A | p.Glu20Lys | p.E20K | A8MTT3 | protein_coding | deleterious(0.01) | probably_damaging(0.996) | TCGA-AA-3984-01 | Colorectum | colon adenocarcinoma | Female | <65 | I/II | Unknown | Unknown | SD |
| CEBPZOS | SNV | Missense_Mutation | novel | c.58N>A | p.Glu20Lys | p.E20K | A8MTT3 | protein_coding | deleterious(0.01) | probably_damaging(0.996) | TCGA-AA-A010-01 | Colorectum | colon adenocarcinoma | Female | <65 | I/II | Chemotherapy | folinic | CR |
| CEBPZOS | SNV | Missense_Mutation | novel | c.58N>A | p.Glu20Lys | p.E20K | A8MTT3 | protein_coding | deleterious(0.01) | probably_damaging(0.996) | TCGA-A5-A2K5-01 | Endometrium | uterine corpus endometrioid carcinoma | Female | >=65 | I/II | Unknown | Unknown | SD |
| CEBPZOS | SNV | Missense_Mutation | novel | c.31N>G | p.Lys11Glu | p.K11E | A8MTT3 | protein_coding | tolerated(0.09) | possibly_damaging(0.896) | TCGA-AJ-A5DW-01 | Endometrium | uterine corpus endometrioid carcinoma | Female | <65 | I/II | Unknown | Unknown | SD |
| CEBPZOS | SNV | Missense_Mutation | novel | c.58N>A | p.Glu20Lys | p.E20K | A8MTT3 | protein_coding | deleterious(0.01) | probably_damaging(0.996) | TCGA-AP-A1DV-01 | Endometrium | uterine corpus endometrioid carcinoma | Female | <65 | I/II | Unknown | Unknown | SD |
| CEBPZOS | SNV | Missense_Mutation | novel | c.58N>A | p.Glu20Lys | p.E20K | A8MTT3 | protein_coding | deleterious(0.01) | probably_damaging(0.996) | TCGA-AP-A1E0-01 | Endometrium | uterine corpus endometrioid carcinoma | Female | <65 | III/IV | Chemotherapy | paclitaxel | SD |
| CEBPZOS | SNV | Missense_Mutation | novel | c.5N>T | p.Ala2Val | p.A2V | A8MTT3 | protein_coding | tolerated(0.08) | benign(0.025) | TCGA-B5-A3FA-01 | Endometrium | uterine corpus endometrioid carcinoma | Female | >=65 | I/II | Unknown | Unknown | SD |
| CEBPZOS | SNV | Missense_Mutation | novel | c.58N>A | p.Glu20Lys | p.E20K | A8MTT3 | protein_coding | deleterious(0.01) | probably_damaging(0.996) | TCGA-BK-A6W3-01 | Endometrium | uterine corpus endometrioid carcinoma | Female | <65 | I/II | Unknown | Unknown | SD |
| CEBPZOS | SNV | Missense_Mutation | novel | c.58N>A | p.Glu20Lys | p.E20K | A8MTT3 | protein_coding | deleterious(0.01) | probably_damaging(0.996) | TCGA-EO-A3AV-01 | Endometrium | uterine corpus endometrioid carcinoma | Female | <65 | III/IV | Chemotherapy | carboplatin | CR |
| Page: 1 2 |
Top |
Related drugs of malignant transformation related genes |
| Identification of chemicals and drugs interact with genes involved in malignant transfromation |
| (DGIdb 4.0) |
| Entrez ID | Symbol | Category | Interaction Types | Drug Claim Name | Drug Name | PMIDs |
| Page: 1 |

Copyright 2023-Present -The University of Texas Health Science Center at Houston |