
|
|||||
|
 | |
| |
| |
| |
| |
| |
|
Gene: CEBPZ |
Gene summary for CEBPZ |
| Gene information | Species | Human | Gene symbol | CEBPZ | Gene ID | 10153 |
| Gene name | CCAAT enhancer binding protein zeta | |
| Gene Alias | CBF | |
| Cytomap | 2p22.2 | |
| Gene Type | protein-coding | GO ID | GO:0006139 | UniProtAcc | Q03701 |
Top |
Malignant transformation analysis |
| Identification of the aberrant gene expression in precancerous and cancerous lesions by comparing the gene expression of stem-like cells in diseased tissues with normal stem cells |
| Entrez ID | Symbol | Replicates | Species | Organ | Tissue | Adj P-value | Log2FC | Malignancy |
| 10153 | CEBPZ | LZE4T | Human | Esophagus | ESCC | 9.17e-16 | 4.77e-01 | 0.0811 |
| 10153 | CEBPZ | LZE7T | Human | Esophagus | ESCC | 1.37e-07 | 4.45e-01 | 0.0667 |
| 10153 | CEBPZ | LZE8T | Human | Esophagus | ESCC | 2.76e-09 | 5.90e-02 | 0.067 |
| 10153 | CEBPZ | LZE22T | Human | Esophagus | ESCC | 1.66e-02 | 2.65e-01 | 0.068 |
| 10153 | CEBPZ | LZE24T | Human | Esophagus | ESCC | 2.69e-11 | 3.86e-01 | 0.0596 |
| 10153 | CEBPZ | LZE21T | Human | Esophagus | ESCC | 8.65e-08 | 3.26e-01 | 0.0655 |
| 10153 | CEBPZ | LZE6T | Human | Esophagus | ESCC | 5.01e-03 | 3.12e-03 | 0.0845 |
| 10153 | CEBPZ | P1T-E | Human | Esophagus | ESCC | 1.78e-10 | 3.84e-01 | 0.0875 |
| 10153 | CEBPZ | P2T-E | Human | Esophagus | ESCC | 2.02e-16 | 5.11e-01 | 0.1177 |
| 10153 | CEBPZ | P4T-E | Human | Esophagus | ESCC | 2.07e-18 | 5.93e-01 | 0.1323 |
| 10153 | CEBPZ | P5T-E | Human | Esophagus | ESCC | 7.94e-15 | 3.48e-01 | 0.1327 |
| 10153 | CEBPZ | P8T-E | Human | Esophagus | ESCC | 1.75e-13 | 4.03e-01 | 0.0889 |
| 10153 | CEBPZ | P9T-E | Human | Esophagus | ESCC | 3.49e-17 | 4.43e-01 | 0.1131 |
| 10153 | CEBPZ | P10T-E | Human | Esophagus | ESCC | 7.12e-26 | 6.84e-01 | 0.116 |
| 10153 | CEBPZ | P11T-E | Human | Esophagus | ESCC | 8.03e-12 | 5.00e-01 | 0.1426 |
| 10153 | CEBPZ | P12T-E | Human | Esophagus | ESCC | 5.12e-21 | 5.20e-01 | 0.1122 |
| 10153 | CEBPZ | P15T-E | Human | Esophagus | ESCC | 4.42e-24 | 4.75e-01 | 0.1149 |
| 10153 | CEBPZ | P16T-E | Human | Esophagus | ESCC | 4.44e-25 | 4.18e-01 | 0.1153 |
| 10153 | CEBPZ | P17T-E | Human | Esophagus | ESCC | 4.21e-08 | 3.15e-01 | 0.1278 |
| 10153 | CEBPZ | P20T-E | Human | Esophagus | ESCC | 3.12e-23 | 3.62e-01 | 0.1124 |
| Page: 1 2 3 4 5 6 |
| Tissue | Expression Dynamics | Abbreviation |
| Esophagus | 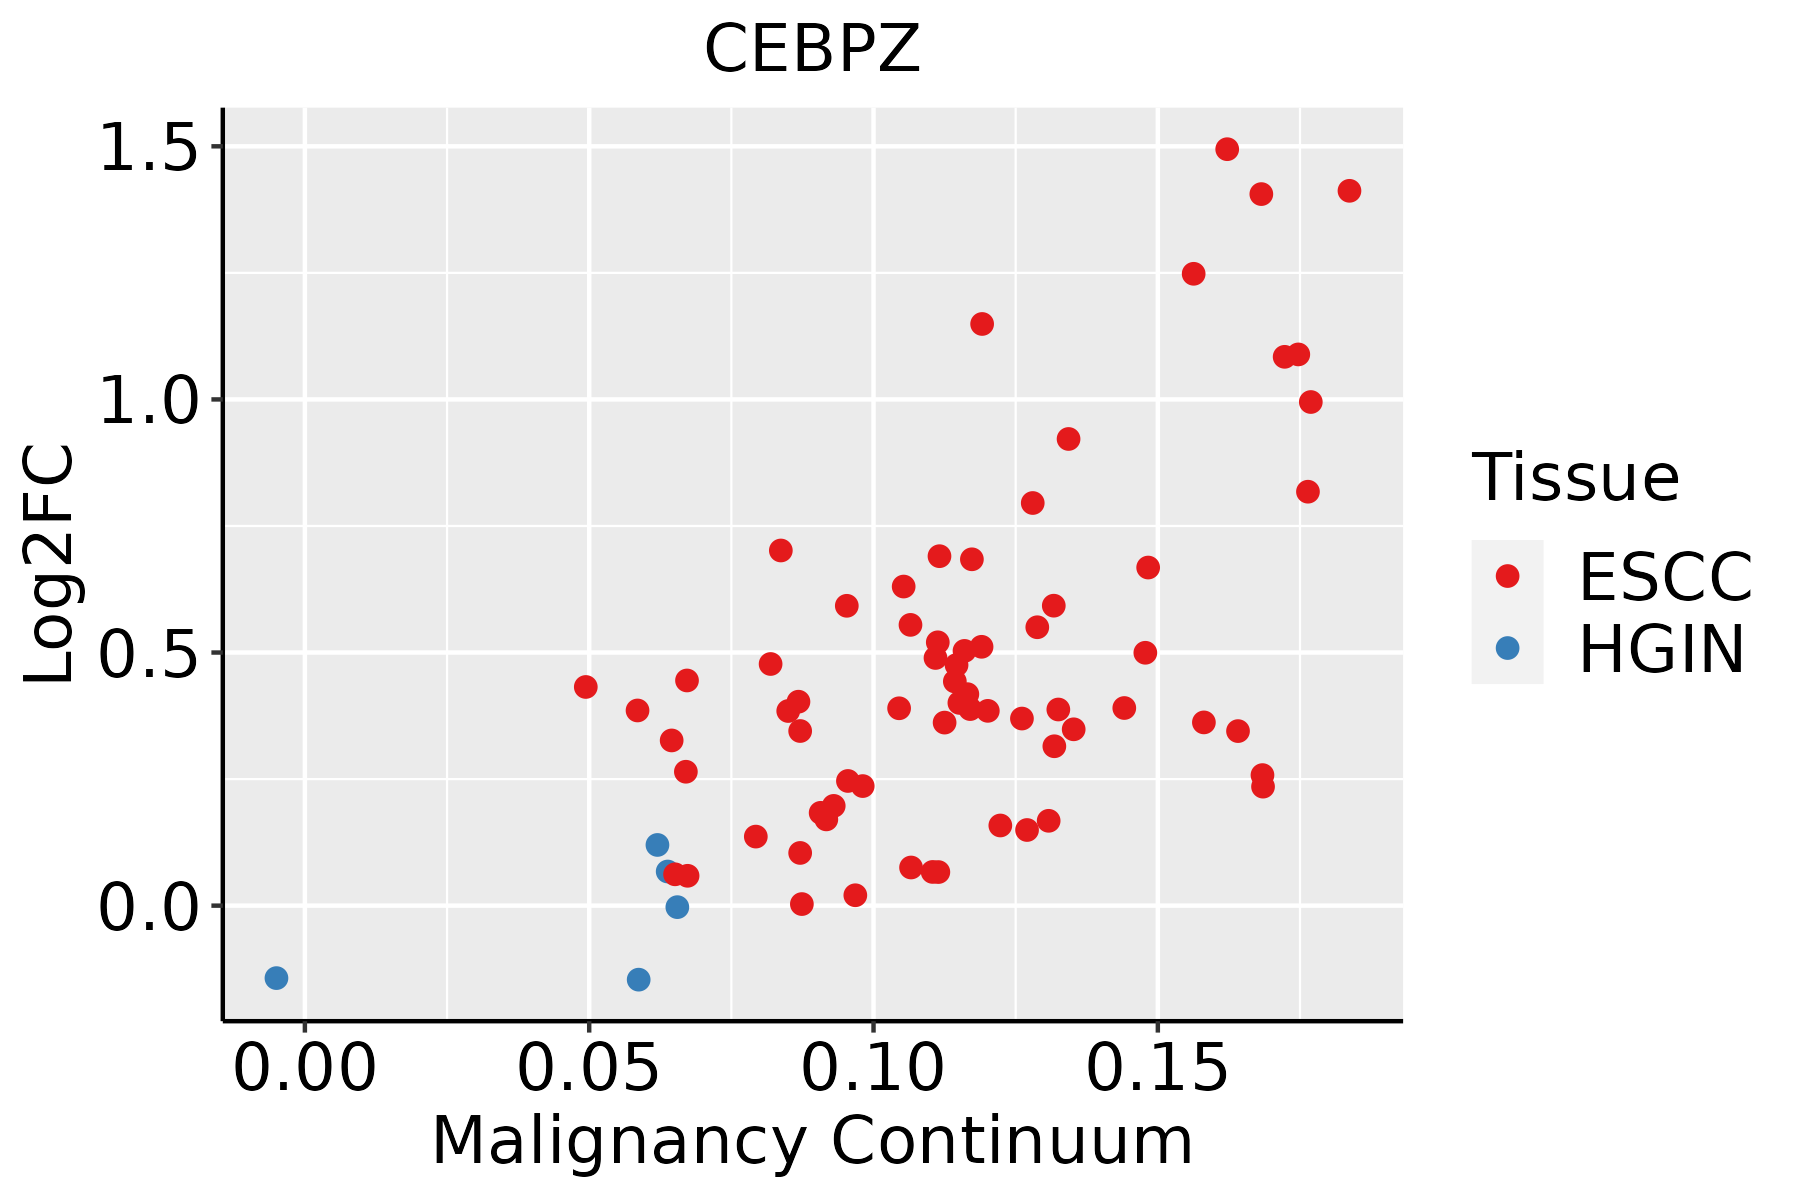 | ESCC: Esophageal squamous cell carcinoma |
| HGIN: High-grade intraepithelial neoplasias | ||
| LGIN: Low-grade intraepithelial neoplasias | ||
| Liver | 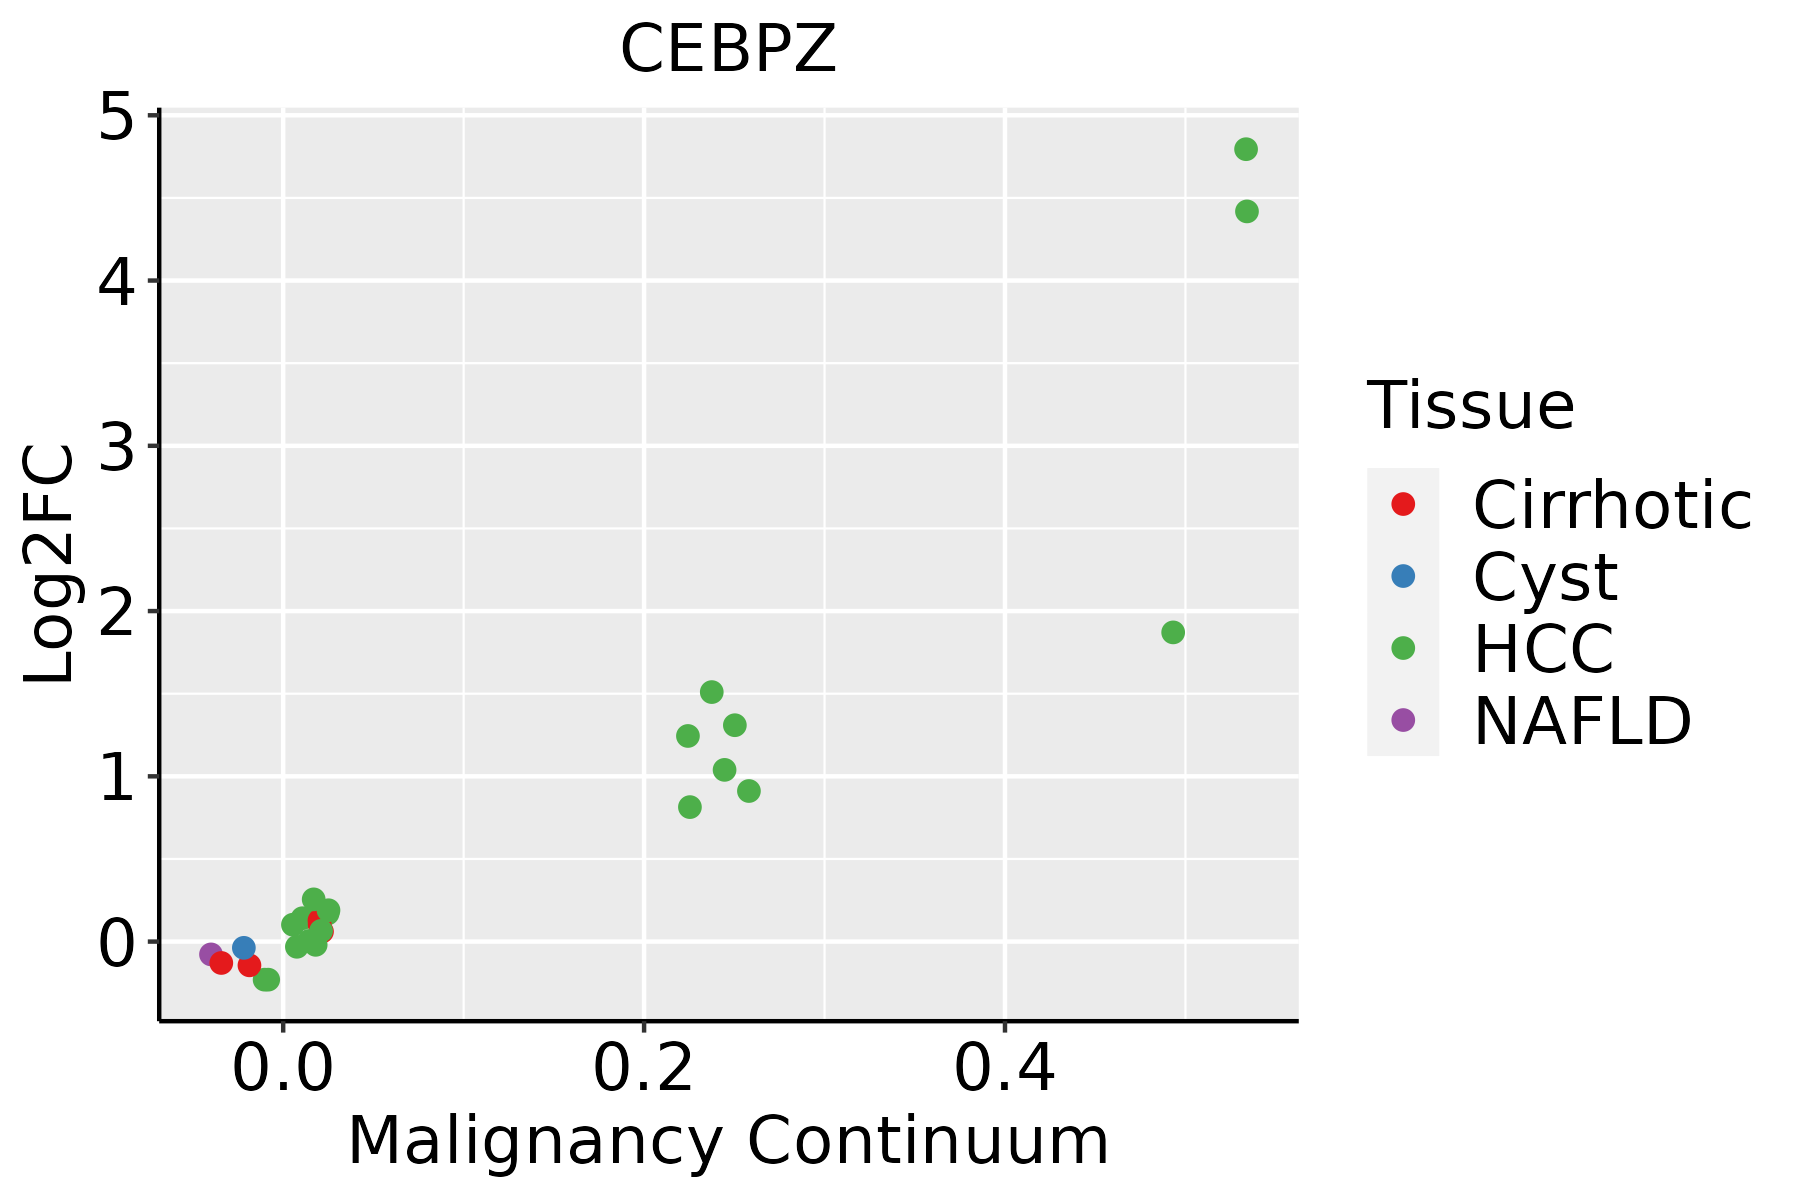 | HCC: Hepatocellular carcinoma |
| NAFLD: Non-alcoholic fatty liver disease | ||
| Oral Cavity | 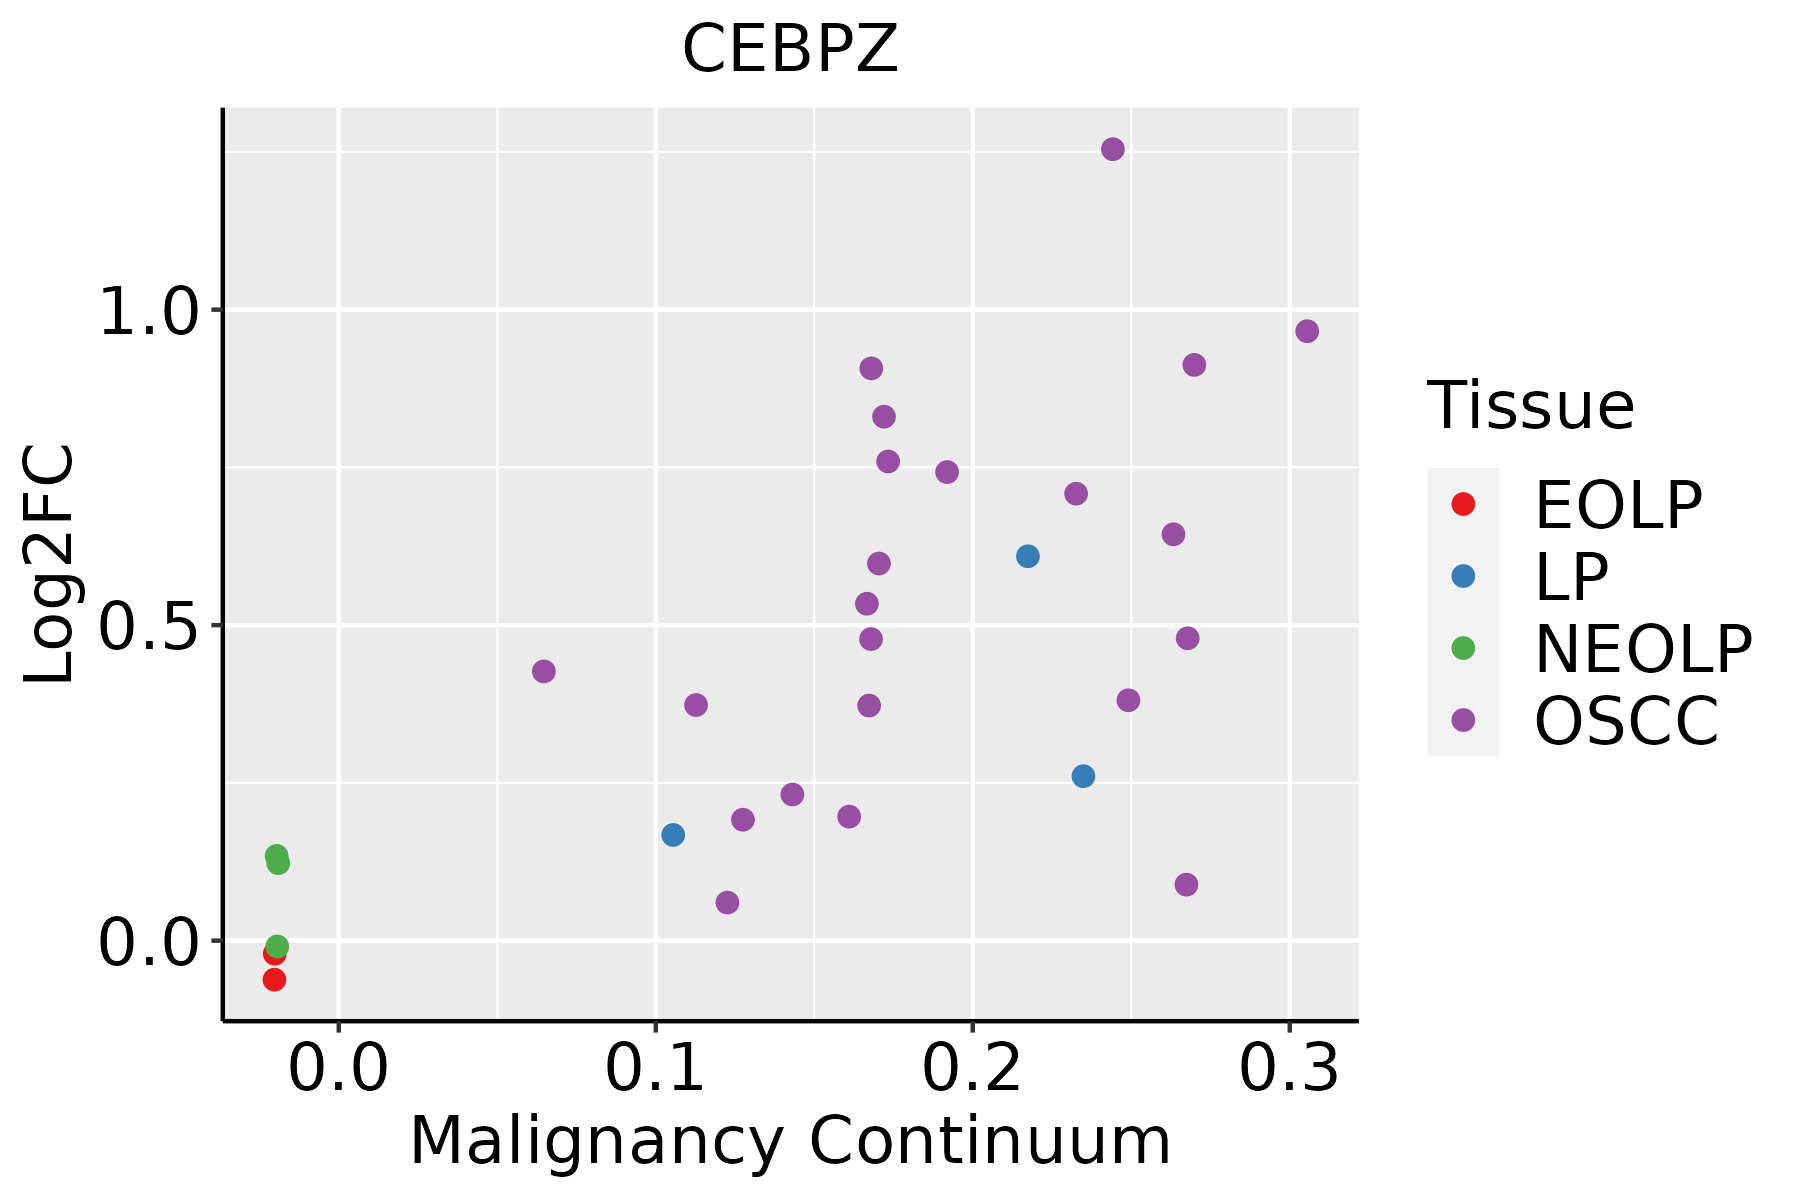 | EOLP: Erosive Oral lichen planus |
| LP: leukoplakia | ||
| NEOLP: Non-erosive oral lichen planus | ||
| OSCC: Oral squamous cell carcinoma | ||
| Skin | 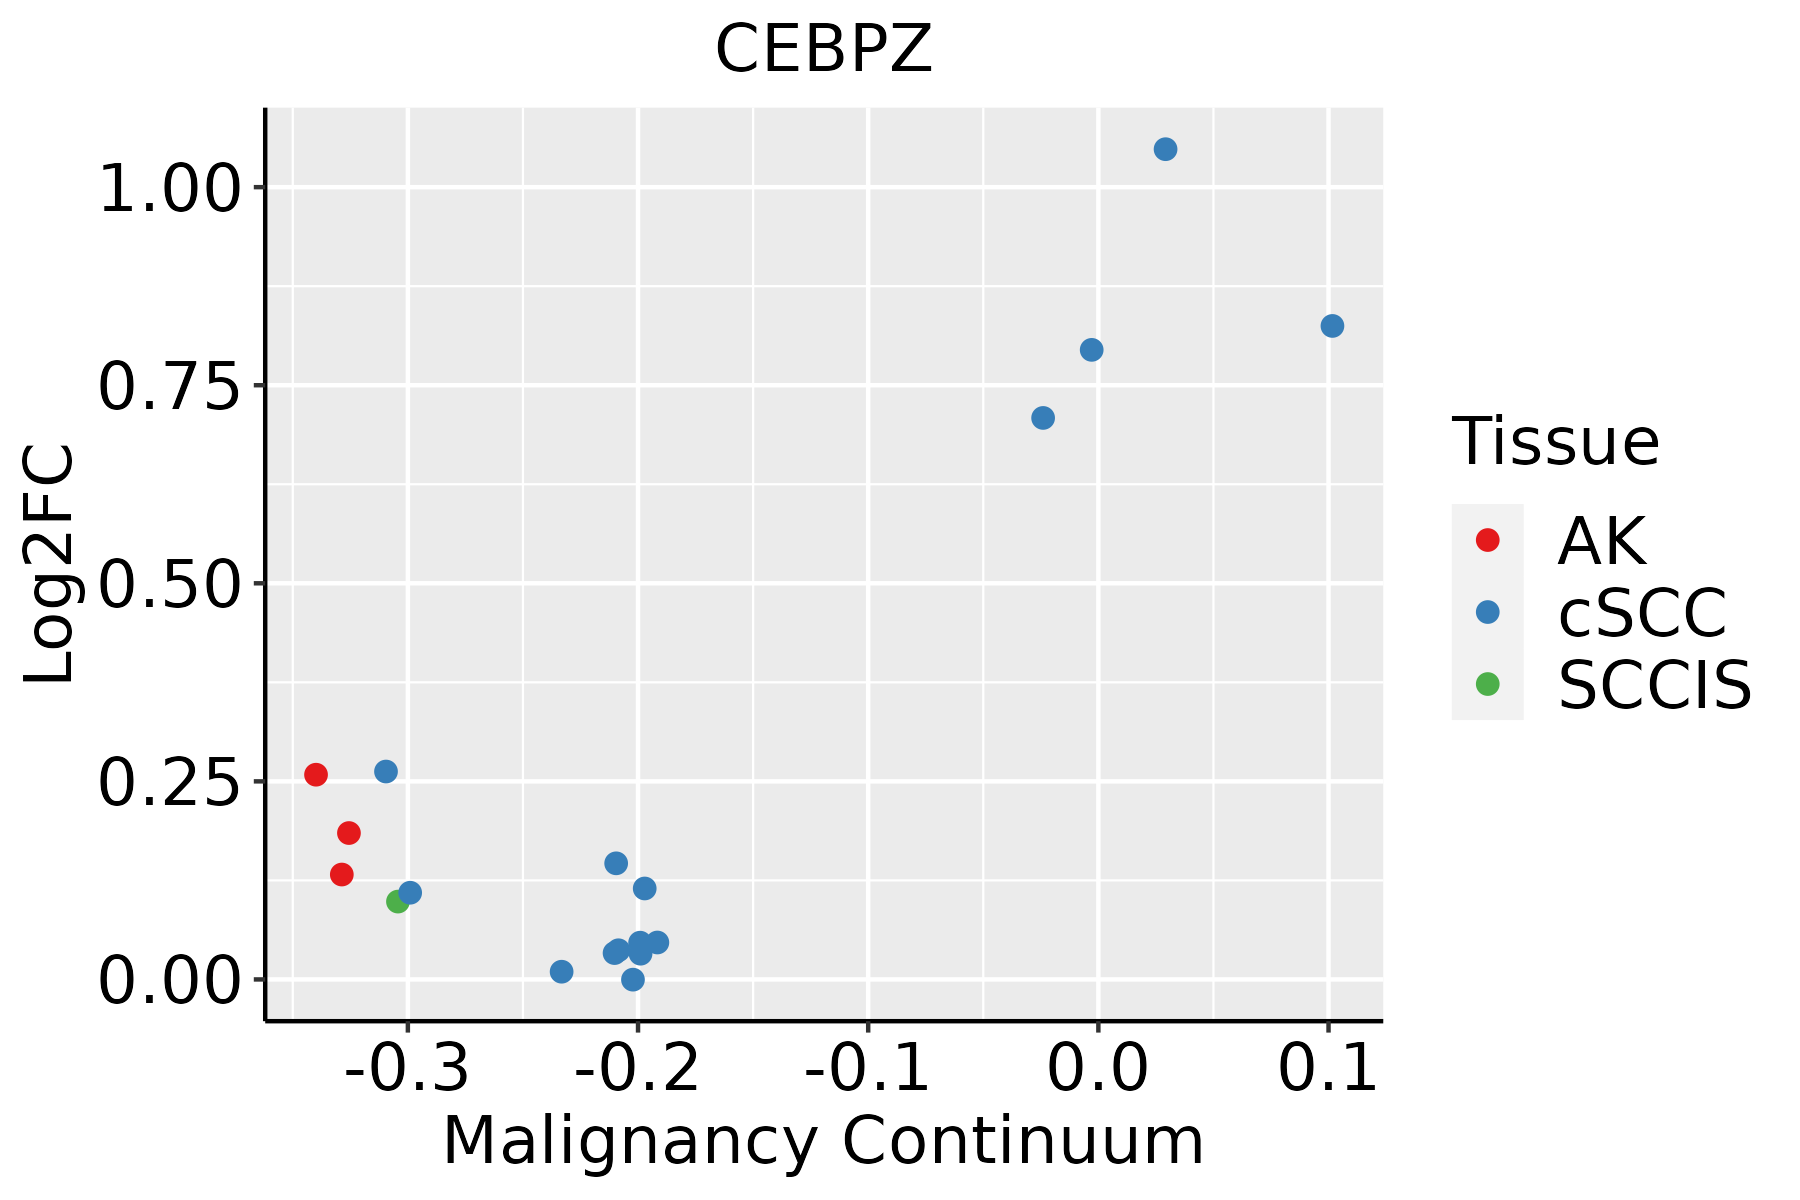 | AK: Actinic keratosis |
| cSCC: Cutaneous squamous cell carcinoma | ||
| SCCIS:squamous cell carcinoma in situ | ||
| Thyroid |  | ATC: Anaplastic thyroid cancer |
| HT: Hashimoto's thyroiditis | ||
| PTC: Papillary thyroid cancer |
| ∗log2FC in expression of this searched gene in stem-like cells from each diseased tissue sample relative to stem-like cells in normal samples in each tissue plotted against the malignancy continuum. Samples are colored based on if they are from different disease stage. |
Top |
Malignant transformation related pathway analysis |
| Find out the enriched GO biological processes and KEGG pathways involved in transition from healthy to precancer to cancer |
| Tissue | Disease Stage | Enriched GO biological Processes |
| Colorectum | AD |  |
| Colorectum | SER |  |
| Colorectum | MSS |  |
| Colorectum | MSI-H |  |
| Colorectum | FAP |  |
| ∗Top 15 enriched GO BP terms are showed in the bar plot of each disease state in each tissue. Each row represents a significant GO biological process which is colored according to the -log10(p.adjust). |
| Page: 1 2 3 4 5 6 7 8 9 |
| GO ID | Tissue | Disease Stage | Description | Gene Ratio | Bg Ratio | pvalue | p.adjust | Count |
| Page: 1 |
| Pathway ID | Tissue | Disease Stage | Description | Gene Ratio | Bg Ratio | pvalue | p.adjust | qvalue | Count |
| Page: 1 |
Top |
Cell-cell communication analysis |
| Identification of potential cell-cell interactions between two cell types and their ligand-receptor pairs for different disease states |
| Ligand | Receptor | LRpair | Pathway | Tissue | Disease Stage |
| Page: 1 |
Top |
Single-cell gene regulatory network inference analysis |
| Find out the significant the regulons (TFs) and the target genes of each regulon across cell types for different disease states |
| TF | Cell Type | Tissue | Disease Stage | Target Gene | RSS | Regulon Activity |
| CEBPZ | INCAF | Colorectum | CRC | ZMAT3,SMIM14,ANKRD28, etc. | 4.64e-01 |  |
| CEBPZ | INCAF | Colorectum | FAP | ZMAT3,SMIM14,ANKRD28, etc. | 1.23e-01 |  |
| CEBPZ | INCAF | Colorectum | Healthy | ZMAT3,SMIM14,ANKRD28, etc. | 1.53e-01 |  |
| CEBPZ | AT2L | Lung | AAH | CYP2J2,RSAD2,KTI12, etc. | 2.16e-01 |  |
| CEBPZ | AT2 | Lung | AAH | CYP2J2,RSAD2,KTI12, etc. | 4.19e-01 | |
| CEBPZ | AT2 | Lung | ADJ | CYP2J2,RSAD2,KTI12, etc. | 3.31e-01 |  |
| CEBPZ | AT2 | Lung | MIAC | CYP2J2,RSAD2,KTI12, etc. | 2.71e-01 |  |
| CEBPZ | TFH | Lung | MIAC | C12orf43,DMAP1,ZNF709, etc. | 1.59e-01 | |
| CEBPZ | ADIPO | Skin | ADJ | SYS1,GABPA,TFAP4, etc. | 1.86e-02 |  |
| CEBPZ | MYOFIB | Skin | cSCC | SYS1,GABPA,TFAP4, etc. | 1.80e-01 |  |
| ∗The dot plots of a searched regulon are shown for all cell subpopulations in each disease state of each tissue based on the regulon specific score inferred using pySCENIC and by calculating the average expression. |
| Page: 1 2 |
Top |
Somatic mutation of malignant transformation related genes |
| Annotation of somatic variants for genes involved in malignant transformation |
| Hugo Symbol | Variant Class | Variant Classification | dbSNP RS | HGVSc | HGVSp | HGVSp Short | SWISSPROT | BIOTYPE | SIFT | PolyPhen | Tumor Sample Barcode | Tissue | Histology | Sex | Age | Stage | Therapy Types | Drugs | Outcome |
| CEBPZ | SNV | Missense_Mutation | c.1477N>T | p.Ala493Ser | p.A493S | Q03701 | protein_coding | deleterious(0) | probably_damaging(0.999) | TCGA-A2-A25C-01 | Breast | breast invasive carcinoma | Female | <65 | I/II | Chemotherapy | taxotere | SD | |
| CEBPZ | SNV | Missense_Mutation | c.1477G>T | p.Ala493Ser | p.A493S | Q03701 | protein_coding | deleterious(0) | probably_damaging(0.999) | TCGA-E2-A1B6-01 | Breast | breast invasive carcinoma | Female | <65 | I/II | Unspecific | Adriamycin | SD | |
| CEBPZ | SNV | Missense_Mutation | c.335N>G | p.Asn112Ser | p.N112S | Q03701 | protein_coding | tolerated(0.52) | benign(0) | TCGA-GM-A2DB-01 | Breast | breast invasive carcinoma | Female | <65 | I/II | Chemotherapy | taxol | CR | |
| CEBPZ | SNV | Missense_Mutation | novel | c.2228C>T | p.Ser743Leu | p.S743L | Q03701 | protein_coding | deleterious(0.01) | benign(0.164) | TCGA-GM-A5PX-01 | Breast | breast invasive carcinoma | Female | >=65 | I/II | Hormone Therapy | arimidex | CR |
| CEBPZ | insertion | Frame_Shift_Ins | novel | c.600_601insTATGCAATTTGCTTTTTAAATCAAATGGCTCTGTCCCATGAAG | p.Val201TyrfsTer18 | p.V201Yfs*18 | Q03701 | protein_coding | TCGA-AO-A0JB-01 | Breast | breast invasive carcinoma | Female | <65 | III/IV | Chemotherapy | cyclophosphamide | SD | ||
| CEBPZ | deletion | Frame_Shift_Del | rs763090473 | c.1428delN | p.Asp477MetfsTer11 | p.D477Mfs*11 | Q03701 | protein_coding | TCGA-D8-A1XQ-01 | Breast | breast invasive carcinoma | Female | >=65 | I/II | Unknown | Unknown | SD | ||
| CEBPZ | SNV | Missense_Mutation | novel | c.1132N>A | p.Glu378Lys | p.E378K | Q03701 | protein_coding | deleterious(0) | probably_damaging(0.992) | TCGA-C5-A1M6-01 | Cervix | cervical & endocervical cancer | Female | <65 | I/II | Chemotherapy | cisplatin | PD |
| CEBPZ | SNV | Missense_Mutation | rs372639283 | c.2485N>T | p.Arg829Trp | p.R829W | Q03701 | protein_coding | deleterious(0.02) | possibly_damaging(0.852) | TCGA-EA-A3HS-01 | Cervix | cervical & endocervical cancer | Female | <65 | I/II | Unknown | Unknown | SD |
| CEBPZ | SNV | Missense_Mutation | novel | c.392N>A | p.Ser131Asn | p.S131N | Q03701 | protein_coding | tolerated(0.46) | benign(0) | TCGA-EA-A3HU-01 | Cervix | cervical & endocervical cancer | Female | <65 | I/II | Unknown | Unknown | SD |
| CEBPZ | insertion | Frame_Shift_Ins | novel | c.3153dupA | p.Gln1052ThrfsTer7 | p.Q1052Tfs*7 | Q03701 | protein_coding | TCGA-FU-A5XV-01 | Cervix | cervical & endocervical cancer | Female | <65 | III/IV | Unknown | Unknown | SD |
| Page: 1 2 3 4 5 6 7 8 9 10 |
Top |
Related drugs of malignant transformation related genes |
| Identification of chemicals and drugs interact with genes involved in malignant transfromation |
| (DGIdb 4.0) |
| Entrez ID | Symbol | Category | Interaction Types | Drug Claim Name | Drug Name | PMIDs |
| Page: 1 |

Copyright 2023-Present -The University of Texas Health Science Center at Houston |