
|
|||||
|
 | |
| |
| |
| |
| |
| |
|
Gene: CEBPG |
Gene summary for CEBPG |
| Gene information | Species | Human | Gene symbol | CEBPG | Gene ID | 1054 |
| Gene name | CCAAT enhancer binding protein gamma | |
| Gene Alias | GPE1BP | |
| Cytomap | 19q13.11 | |
| Gene Type | protein-coding | GO ID | GO:0001775 | UniProtAcc | P53567 |
Top |
Malignant transformation analysis |
| Identification of the aberrant gene expression in precancerous and cancerous lesions by comparing the gene expression of stem-like cells in diseased tissues with normal stem cells |
| Entrez ID | Symbol | Replicates | Species | Organ | Tissue | Adj P-value | Log2FC | Malignancy |
| 1054 | CEBPG | HTA11_347_2000001011 | Human | Colorectum | AD | 3.91e-07 | 3.57e-01 | -0.1954 |
| 1054 | CEBPG | HTA11_99999971662_82457 | Human | Colorectum | MSS | 3.60e-05 | 2.88e-01 | 0.3859 |
| 1054 | CEBPG | A015-C-203 | Human | Colorectum | FAP | 3.85e-03 | -1.41e-01 | -0.1294 |
| 1054 | CEBPG | LZE2T | Human | Esophagus | ESCC | 3.76e-06 | 8.66e-01 | 0.082 |
| 1054 | CEBPG | LZE4T | Human | Esophagus | ESCC | 1.24e-18 | 6.58e-01 | 0.0811 |
| 1054 | CEBPG | LZE5T | Human | Esophagus | ESCC | 6.55e-07 | 2.97e-01 | 0.0514 |
| 1054 | CEBPG | LZE7T | Human | Esophagus | ESCC | 5.83e-05 | 4.84e-01 | 0.0667 |
| 1054 | CEBPG | LZE8T | Human | Esophagus | ESCC | 5.52e-08 | 3.11e-02 | 0.067 |
| 1054 | CEBPG | LZE20T | Human | Esophagus | ESCC | 9.15e-03 | 1.15e-01 | 0.0662 |
| 1054 | CEBPG | LZE22T | Human | Esophagus | ESCC | 1.23e-06 | 4.51e-01 | 0.068 |
| 1054 | CEBPG | LZE24T | Human | Esophagus | ESCC | 2.04e-28 | 9.02e-01 | 0.0596 |
| 1054 | CEBPG | LZE6T | Human | Esophagus | ESCC | 5.20e-03 | 2.25e-01 | 0.0845 |
| 1054 | CEBPG | P1T-E | Human | Esophagus | ESCC | 2.78e-09 | 7.88e-01 | 0.0875 |
| 1054 | CEBPG | P2T-E | Human | Esophagus | ESCC | 1.01e-32 | 7.09e-01 | 0.1177 |
| 1054 | CEBPG | P4T-E | Human | Esophagus | ESCC | 4.33e-32 | 1.10e+00 | 0.1323 |
| 1054 | CEBPG | P5T-E | Human | Esophagus | ESCC | 3.95e-32 | 7.99e-01 | 0.1327 |
| 1054 | CEBPG | P8T-E | Human | Esophagus | ESCC | 2.71e-14 | 4.10e-01 | 0.0889 |
| 1054 | CEBPG | P9T-E | Human | Esophagus | ESCC | 8.74e-46 | 1.21e+00 | 0.1131 |
| 1054 | CEBPG | P10T-E | Human | Esophagus | ESCC | 2.99e-49 | 1.05e+00 | 0.116 |
| 1054 | CEBPG | P11T-E | Human | Esophagus | ESCC | 1.51e-14 | 7.52e-01 | 0.1426 |
| Page: 1 2 3 4 5 6 |
| Tissue | Expression Dynamics | Abbreviation |
| Colorectum (GSE201348) |  | FAP: Familial adenomatous polyposis |
| CRC: Colorectal cancer | ||
| Colorectum (HTA11) |  | AD: Adenomas |
| SER: Sessile serrated lesions | ||
| MSI-H: Microsatellite-high colorectal cancer | ||
| MSS: Microsatellite stable colorectal cancer | ||
| Esophagus | 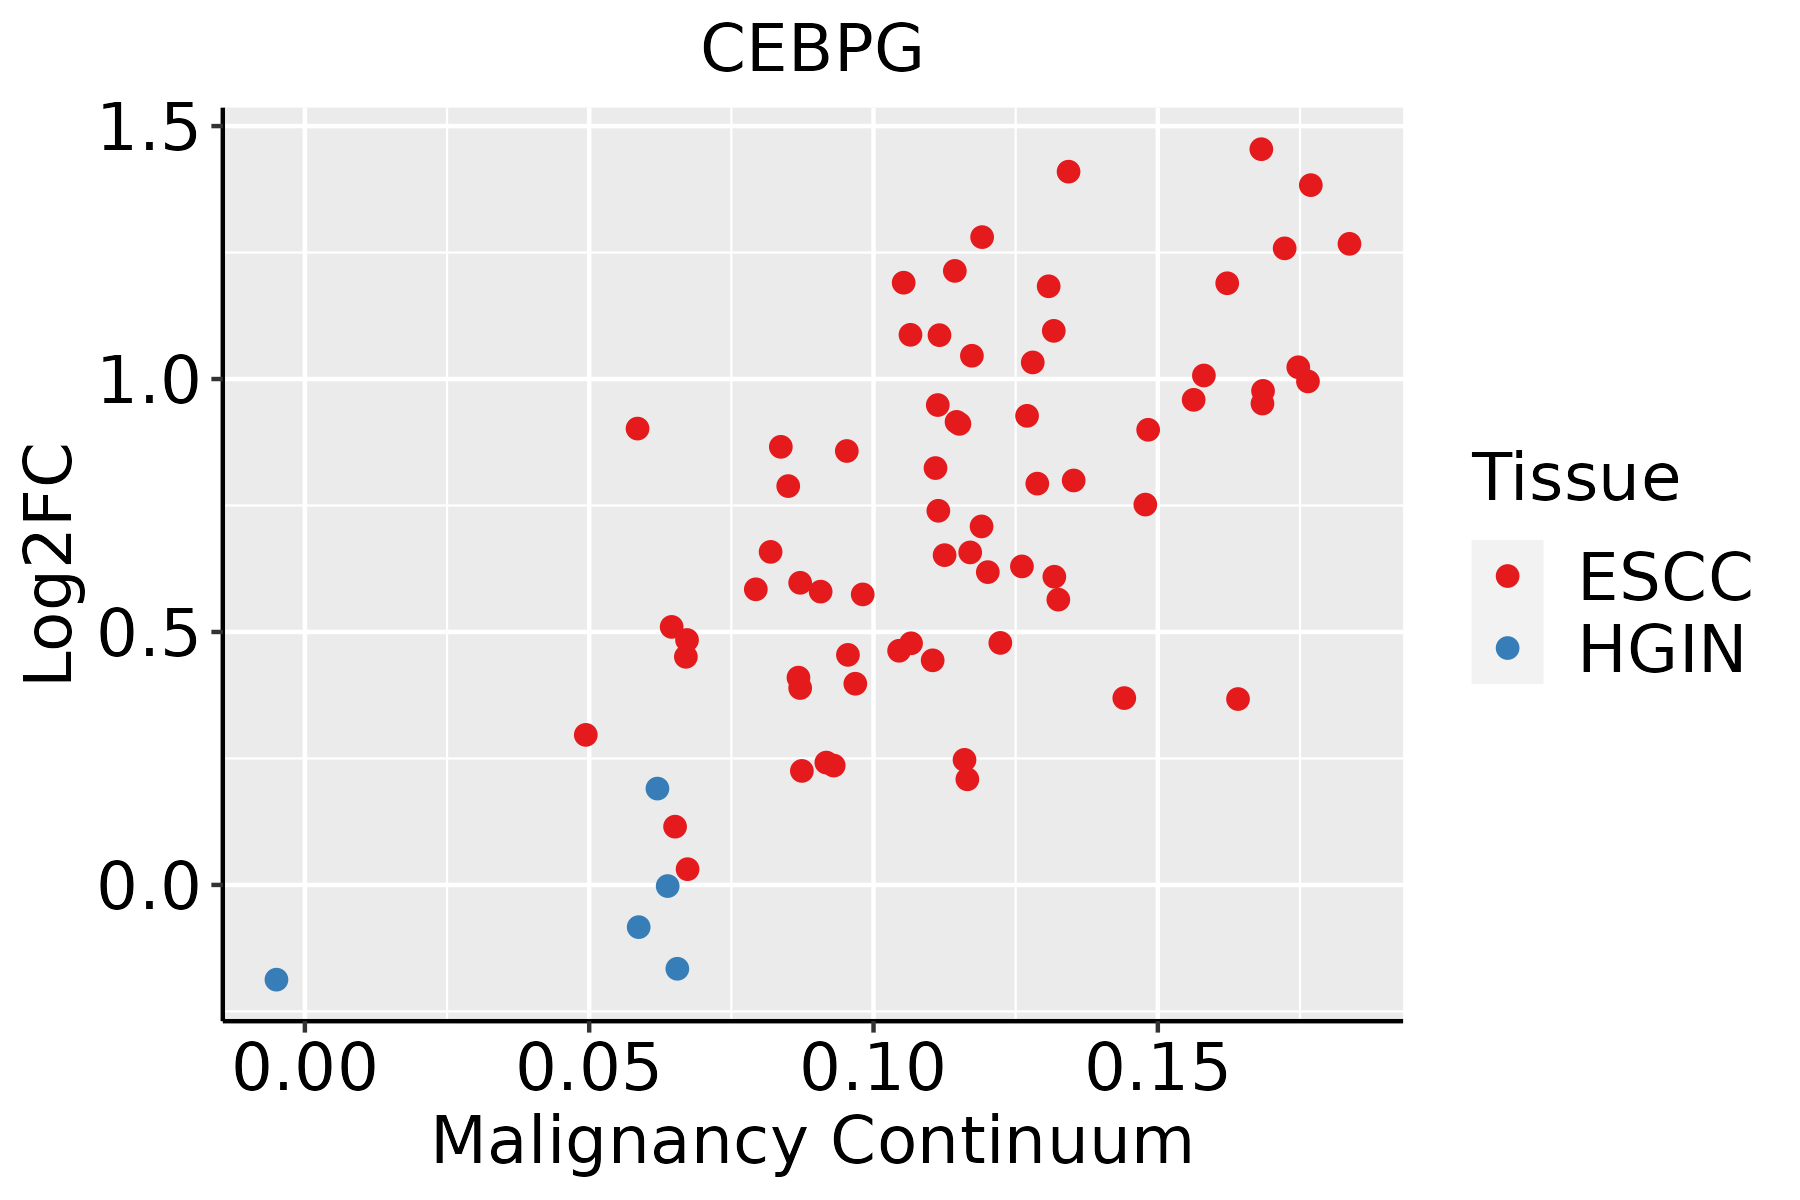 | ESCC: Esophageal squamous cell carcinoma |
| HGIN: High-grade intraepithelial neoplasias | ||
| LGIN: Low-grade intraepithelial neoplasias | ||
| Liver | 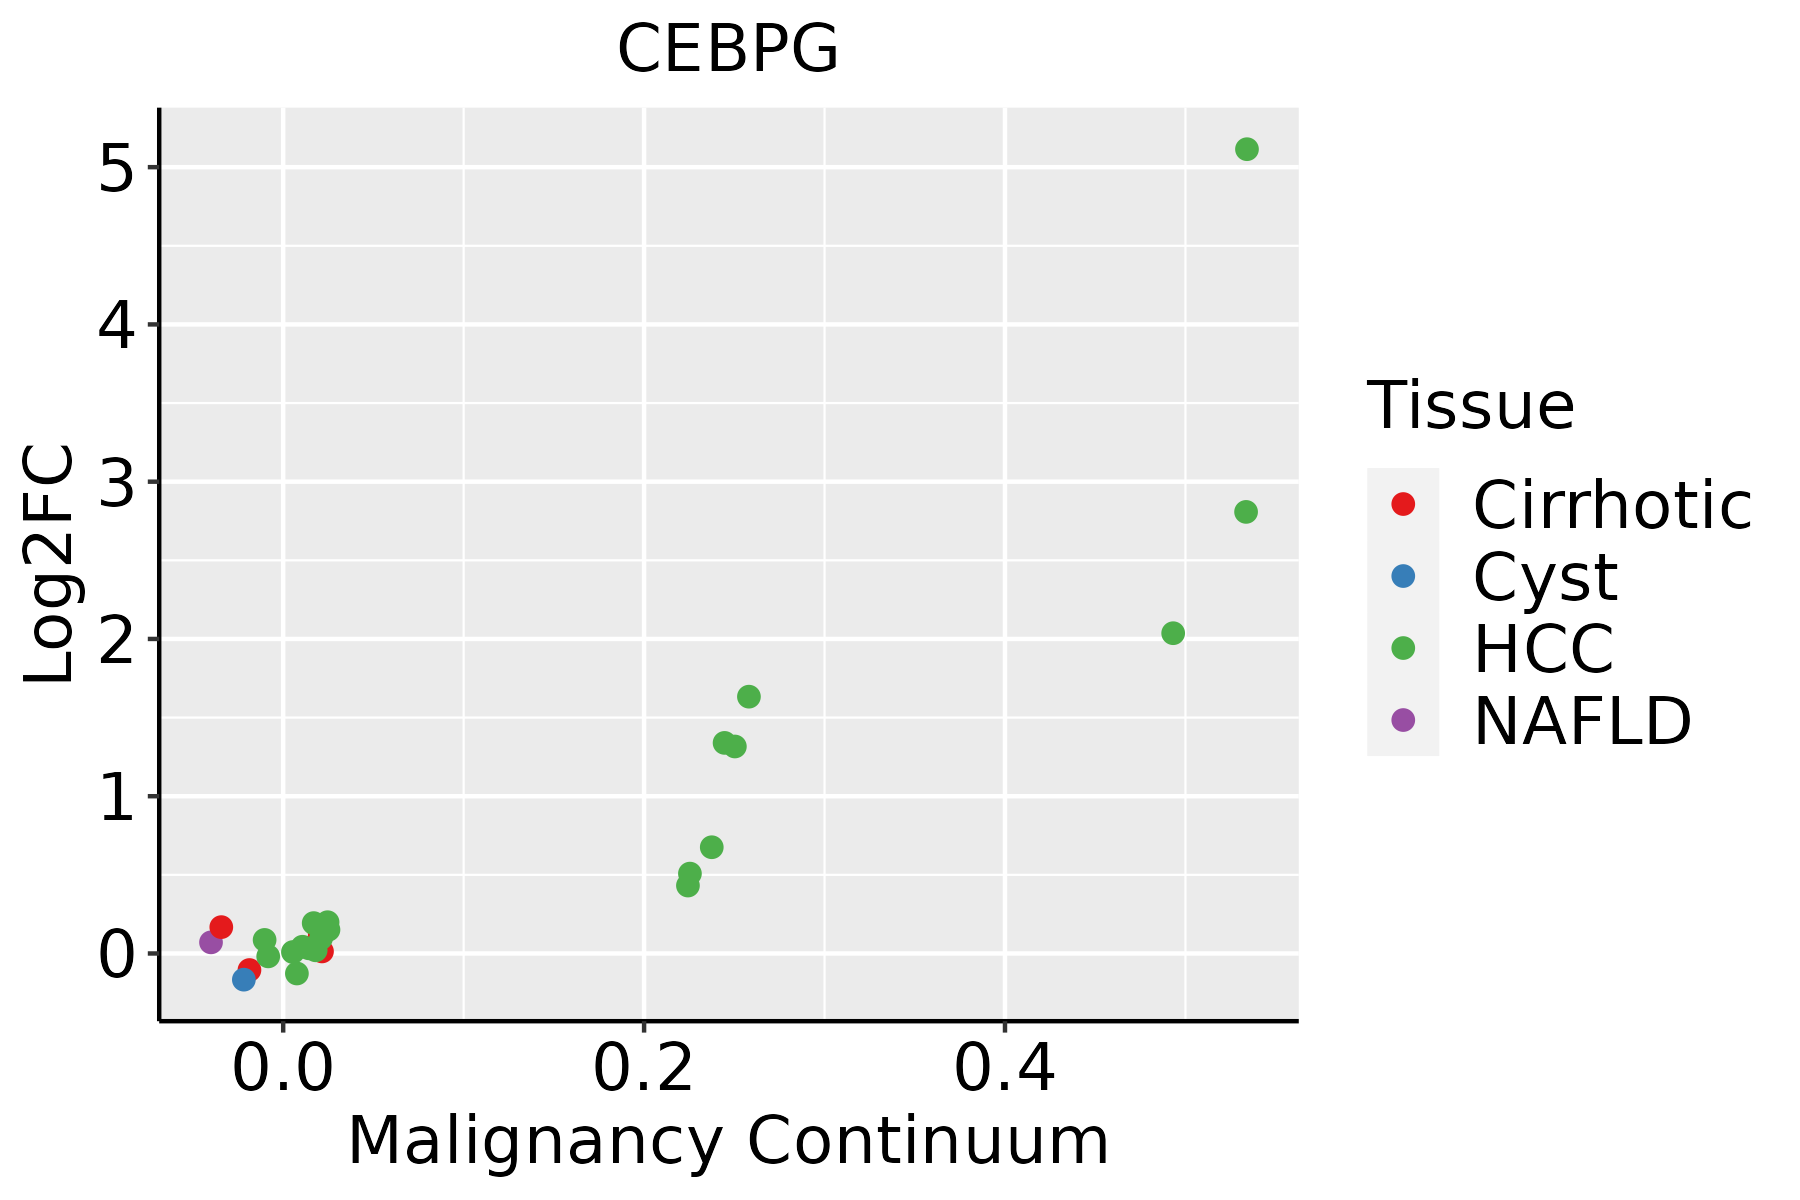 | HCC: Hepatocellular carcinoma |
| NAFLD: Non-alcoholic fatty liver disease | ||
| Oral Cavity | 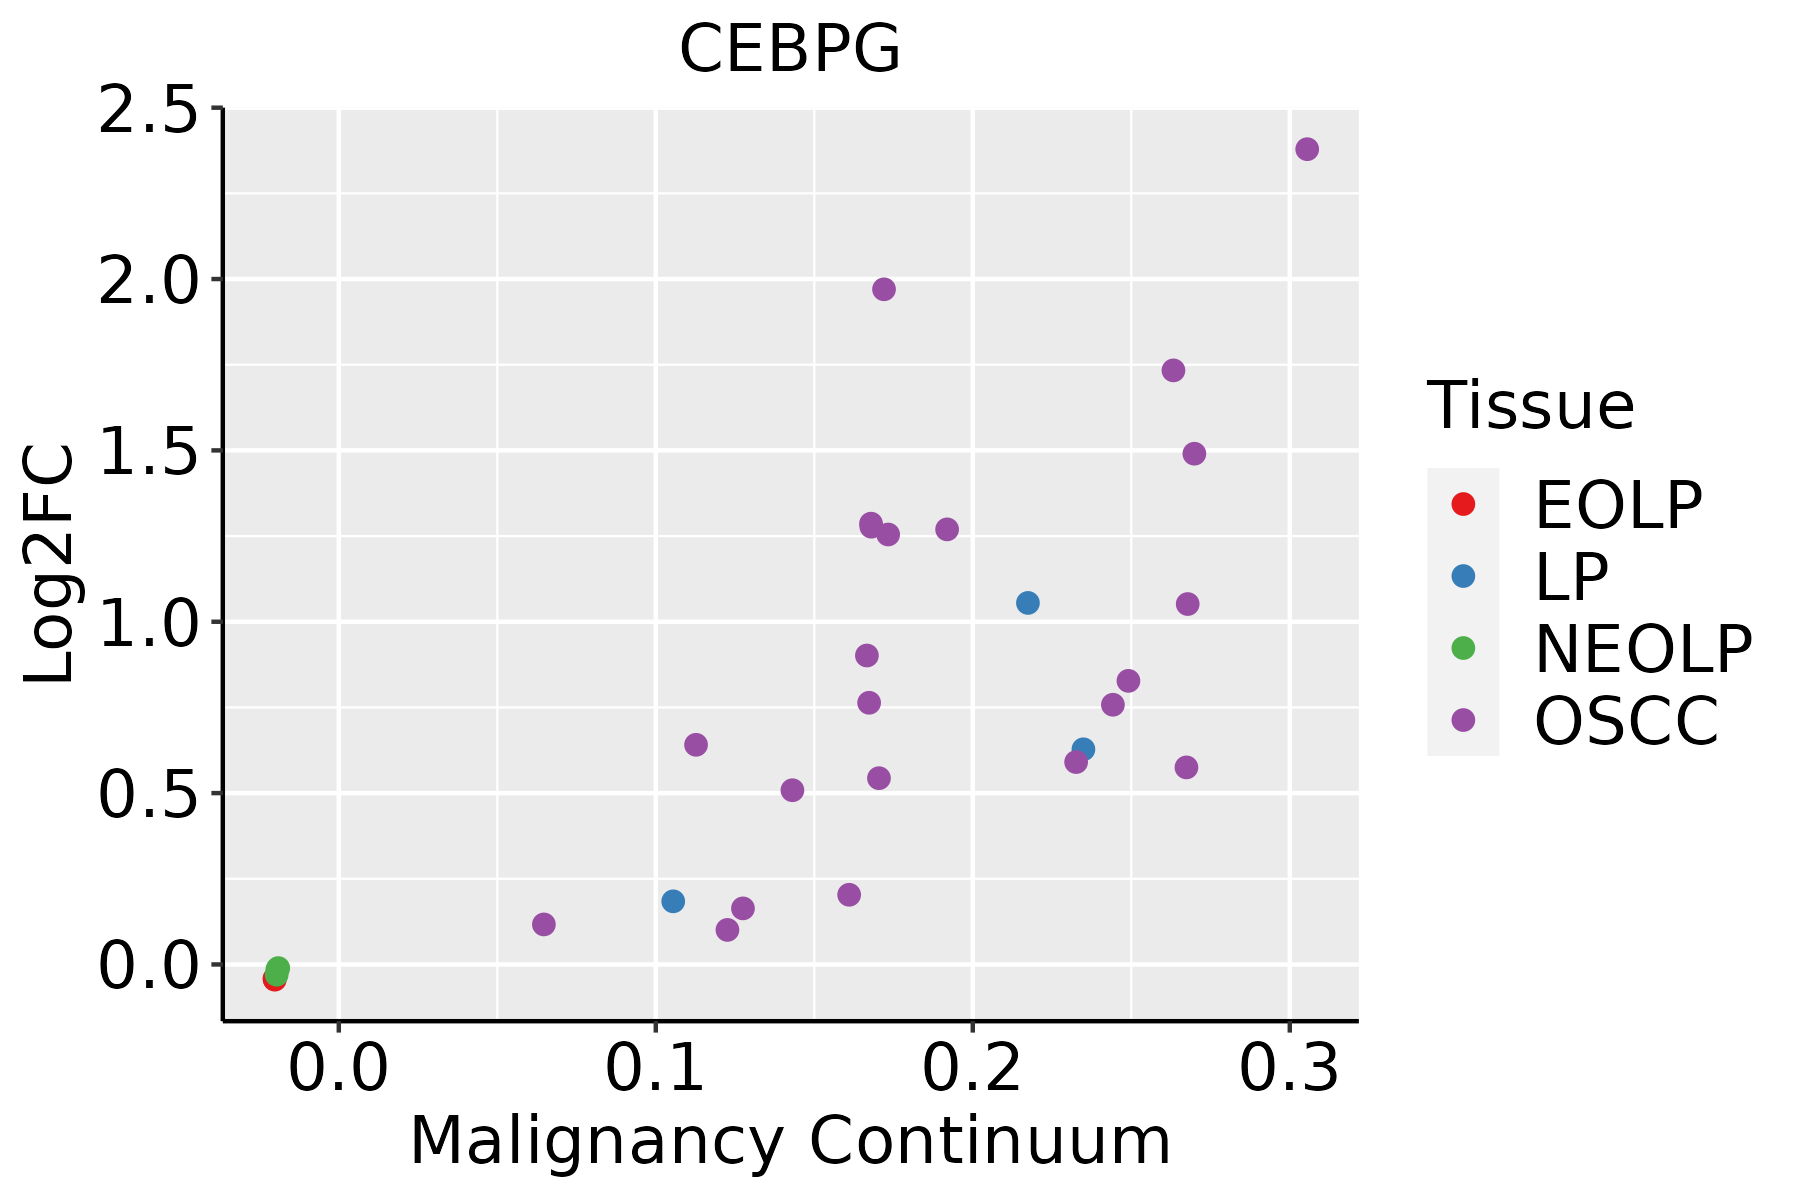 | EOLP: Erosive Oral lichen planus |
| LP: leukoplakia | ||
| NEOLP: Non-erosive oral lichen planus | ||
| OSCC: Oral squamous cell carcinoma | ||
| Skin |  | AK: Actinic keratosis |
| cSCC: Cutaneous squamous cell carcinoma | ||
| SCCIS:squamous cell carcinoma in situ | ||
| Thyroid | 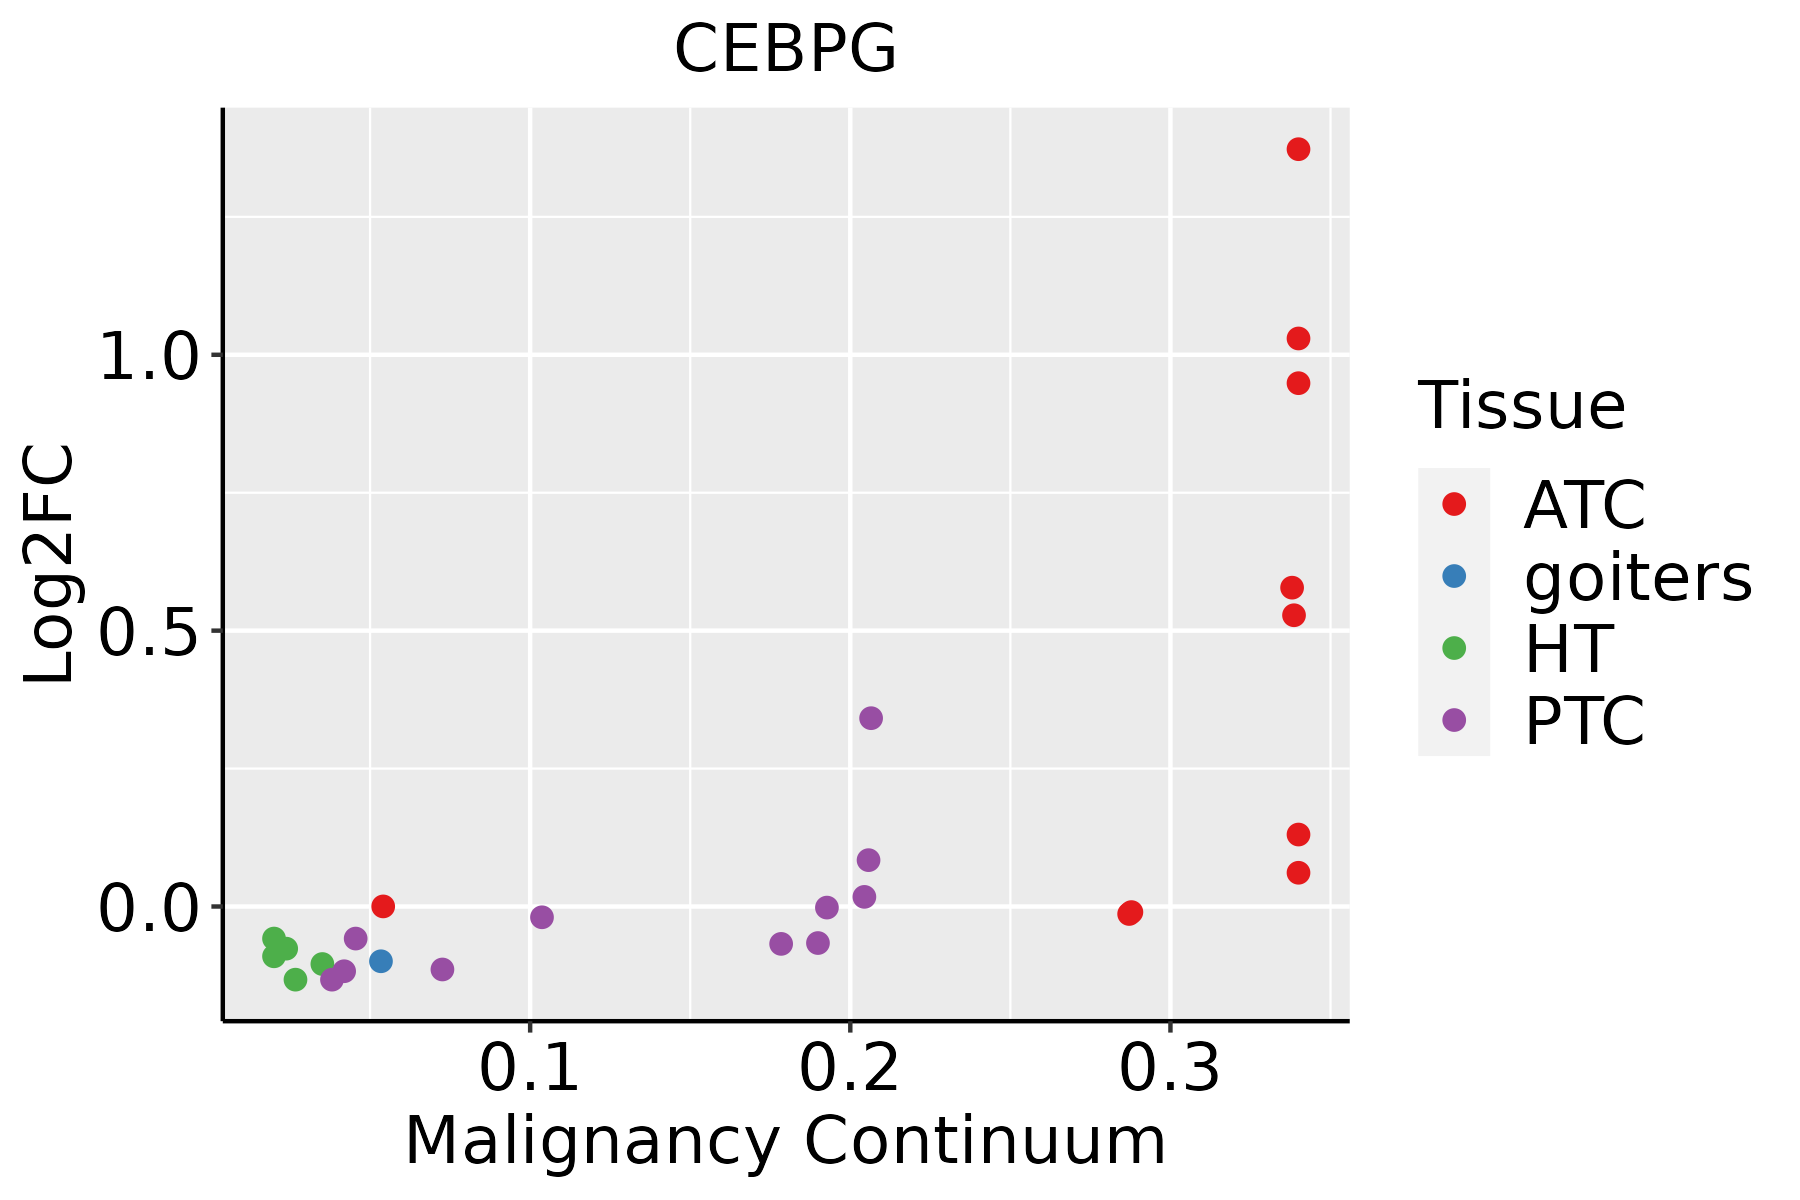 | ATC: Anaplastic thyroid cancer |
| HT: Hashimoto's thyroiditis | ||
| PTC: Papillary thyroid cancer |
| ∗log2FC in expression of this searched gene in stem-like cells from each diseased tissue sample relative to stem-like cells in normal samples in each tissue plotted against the malignancy continuum. Samples are colored based on if they are from different disease stage. |
Top |
Malignant transformation related pathway analysis |
| Find out the enriched GO biological processes and KEGG pathways involved in transition from healthy to precancer to cancer |
| Tissue | Disease Stage | Enriched GO biological Processes |
| Colorectum | AD |  |
| Colorectum | SER |  |
| Colorectum | MSS |  |
| Colorectum | MSI-H |  |
| Colorectum | FAP |  |
| ∗Top 15 enriched GO BP terms are showed in the bar plot of each disease state in each tissue. Each row represents a significant GO biological process which is colored according to the -log10(p.adjust). |
| Page: 1 2 3 4 5 6 7 8 9 |
| GO ID | Tissue | Disease Stage | Description | Gene Ratio | Bg Ratio | pvalue | p.adjust | Count |
| GO:0048732 | Colorectum | AD | gland development | 149/3918 | 436/18723 | 6.07e-11 | 6.33e-09 | 149 |
| GO:0051098 | Colorectum | AD | regulation of binding | 126/3918 | 363/18723 | 6.01e-10 | 4.88e-08 | 126 |
| GO:0051099 | Colorectum | AD | positive regulation of binding | 66/3918 | 173/18723 | 1.47e-07 | 6.64e-06 | 66 |
| GO:0051052 | Colorectum | AD | regulation of DNA metabolic process | 116/3918 | 359/18723 | 2.47e-07 | 1.00e-05 | 116 |
| GO:0051054 | Colorectum | AD | positive regulation of DNA metabolic process | 73/3918 | 201/18723 | 3.27e-07 | 1.29e-05 | 73 |
| GO:0034101 | Colorectum | AD | erythrocyte homeostasis | 51/3918 | 129/18723 | 1.07e-06 | 3.59e-05 | 51 |
| GO:0030099 | Colorectum | AD | myeloid cell differentiation | 119/3918 | 381/18723 | 1.24e-06 | 4.01e-05 | 119 |
| GO:0002262 | Colorectum | AD | myeloid cell homeostasis | 57/3918 | 157/18723 | 6.17e-06 | 1.56e-04 | 57 |
| GO:0061008 | Colorectum | AD | hepaticobiliary system development | 55/3918 | 150/18723 | 6.34e-06 | 1.59e-04 | 55 |
| GO:0001889 | Colorectum | AD | liver development | 54/3918 | 147/18723 | 7.20e-06 | 1.77e-04 | 54 |
| GO:0048872 | Colorectum | AD | homeostasis of number of cells | 87/3918 | 272/18723 | 1.16e-05 | 2.61e-04 | 87 |
| GO:0030218 | Colorectum | AD | erythrocyte differentiation | 45/3918 | 120/18723 | 2.22e-05 | 4.39e-04 | 45 |
| GO:2001020 | Colorectum | AD | regulation of response to DNA damage stimulus | 71/3918 | 219/18723 | 4.38e-05 | 7.65e-04 | 71 |
| GO:0051101 | Colorectum | AD | regulation of DNA binding | 42/3918 | 118/18723 | 1.62e-04 | 2.23e-03 | 42 |
| GO:0043388 | Colorectum | AD | positive regulation of DNA binding | 23/3918 | 56/18723 | 4.91e-04 | 5.32e-03 | 23 |
| GO:2001022 | Colorectum | AD | positive regulation of response to DNA damage stimulus | 36/3918 | 105/18723 | 1.02e-03 | 9.47e-03 | 36 |
| GO:0006282 | Colorectum | AD | regulation of DNA repair | 42/3918 | 130/18723 | 1.57e-03 | 1.32e-02 | 42 |
| GO:0051091 | Colorectum | AD | positive regulation of DNA-binding transcription factor activity | 73/3918 | 260/18723 | 3.52e-03 | 2.54e-02 | 73 |
| GO:00487322 | Colorectum | MSS | gland development | 143/3467 | 436/18723 | 3.85e-13 | 8.01e-11 | 143 |
| GO:00510982 | Colorectum | MSS | regulation of binding | 113/3467 | 363/18723 | 3.55e-09 | 2.41e-07 | 113 |
| Page: 1 2 3 4 5 6 7 8 9 10 11 |
| Pathway ID | Tissue | Disease Stage | Description | Gene Ratio | Bg Ratio | pvalue | p.adjust | qvalue | Count |
| hsa051527 | Esophagus | ESCC | Tuberculosis | 111/4205 | 180/8465 | 7.14e-04 | 2.32e-03 | 1.19e-03 | 111 |
| hsa0515212 | Esophagus | ESCC | Tuberculosis | 111/4205 | 180/8465 | 7.14e-04 | 2.32e-03 | 1.19e-03 | 111 |
| hsa051526 | Oral cavity | OSCC | Tuberculosis | 105/3704 | 180/8465 | 5.00e-05 | 2.04e-04 | 1.04e-04 | 105 |
| hsa0515211 | Oral cavity | OSCC | Tuberculosis | 105/3704 | 180/8465 | 5.00e-05 | 2.04e-04 | 1.04e-04 | 105 |
| hsa0515221 | Oral cavity | LP | Tuberculosis | 65/2418 | 180/8465 | 1.60e-02 | 4.92e-02 | 3.17e-02 | 65 |
| hsa0515231 | Oral cavity | LP | Tuberculosis | 65/2418 | 180/8465 | 1.60e-02 | 4.92e-02 | 3.17e-02 | 65 |
| Page: 1 |
Top |
Cell-cell communication analysis |
| Identification of potential cell-cell interactions between two cell types and their ligand-receptor pairs for different disease states |
| Ligand | Receptor | LRpair | Pathway | Tissue | Disease Stage |
| Page: 1 |
Top |
Single-cell gene regulatory network inference analysis |
| Find out the significant the regulons (TFs) and the target genes of each regulon across cell types for different disease states |
| TF | Cell Type | Tissue | Disease Stage | Target Gene | RSS | Regulon Activity |
| CEBPG | PLA | Lung | Healthy | ACSL4,LPGAT1,SLC18A2, etc. | 7.97e-02 |  |
| CEBPG | MAST | Lung | IAC | AL353135.2,TNF,ACTA2, etc. | 4.50e-02 |  |
| CEBPG | MMC | Lung | IAC | AL353135.2,TNF,ACTA2, etc. | 4.60e-02 | |
| CEBPG | COR | Oral cavity | Healthy | NDUFA4L2,KRT6A,SPRR1A, etc. | 1.63e-01 |  |
| CEBPG | MVA | Pancreas | ADJ | POU2F2,HLA-E,FABP5, etc. | 6.94e-01 |  |
| CEBPG | MEGA | Pancreas | Healthy | POU2F2,HLA-E,FABP5, etc. | 6.90e-01 |  |
| CEBPG | PVA | Pancreas | Healthy | POU2F2,HLA-E,FABP5, etc. | 4.86e-02 | |
| CEBPG | MEGA | Pancreas | PanIN | POU2F2,HLA-E,FABP5, etc. | 6.96e-01 |  |
| CEBPG | PVA | Pancreas | PDAC | POU2F2,HLA-E,FABP5, etc. | 3.77e-01 |  |
| CEBPG | MVA | Pancreas | PDAC | POU2F2,HLA-E,FABP5, etc. | 1.96e-01 | |
| ∗The dot plots of a searched regulon are shown for all cell subpopulations in each disease state of each tissue based on the regulon specific score inferred using pySCENIC and by calculating the average expression. |
| Page: 1 2 |
Top |
Somatic mutation of malignant transformation related genes |
| Annotation of somatic variants for genes involved in malignant transformation |
| Hugo Symbol | Variant Class | Variant Classification | dbSNP RS | HGVSc | HGVSp | HGVSp Short | SWISSPROT | BIOTYPE | SIFT | PolyPhen | Tumor Sample Barcode | Tissue | Histology | Sex | Age | Stage | Therapy Types | Drugs | Outcome |
| CEBPG | SNV | Missense_Mutation | novel | c.258N>C | p.Lys86Asn | p.K86N | P53567 | protein_coding | deleterious(0) | benign(0.066) | TCGA-AZ-4315-01 | Colorectum | colon adenocarcinoma | Male | <65 | I/II | Unknown | Unknown | SD |
| CEBPG | SNV | Missense_Mutation | c.337N>G | p.Lys113Glu | p.K113E | P53567 | protein_coding | deleterious(0) | probably_damaging(0.996) | TCGA-EI-6882-01 | Colorectum | rectum adenocarcinoma | Male | <65 | I/II | Unknown | Unknown | SD | |
| CEBPG | SNV | Missense_Mutation | novel | c.64C>A | p.Gln22Lys | p.Q22K | P53567 | protein_coding | deleterious(0) | benign(0) | TCGA-A5-A0G2-01 | Endometrium | uterine corpus endometrioid carcinoma | Female | <65 | III/IV | Unknown | Unknown | SD |
| CEBPG | SNV | Missense_Mutation | c.374N>G | p.His125Arg | p.H125R | P53567 | protein_coding | deleterious(0) | possibly_damaging(0.723) | TCGA-A5-A0GW-01 | Endometrium | uterine corpus endometrioid carcinoma | Female | <65 | I/II | Unknown | Unknown | SD | |
| CEBPG | SNV | Missense_Mutation | novel | c.339N>T | p.Lys113Asn | p.K113N | P53567 | protein_coding | deleterious(0) | probably_damaging(0.998) | TCGA-AP-A1DV-01 | Endometrium | uterine corpus endometrioid carcinoma | Female | <65 | I/II | Unknown | Unknown | SD |
| CEBPG | SNV | Missense_Mutation | c.358G>T | p.Asp120Tyr | p.D120Y | P53567 | protein_coding | deleterious(0) | probably_damaging(0.972) | TCGA-B5-A11E-01 | Endometrium | uterine corpus endometrioid carcinoma | Female | <65 | I/II | Unknown | Unknown | SD | |
| CEBPG | SNV | Missense_Mutation | novel | c.115N>A | p.Pro39Thr | p.P39T | P53567 | protein_coding | deleterious(0) | benign(0.001) | TCGA-EY-A1GF-01 | Endometrium | uterine corpus endometrioid carcinoma | Female | >=65 | I/II | Unknown | Unknown | SD |
| CEBPG | SNV | Missense_Mutation | novel | c.206G>A | p.Arg69Gln | p.R69Q | P53567 | protein_coding | deleterious(0) | probably_damaging(0.943) | TCGA-EY-A549-01 | Endometrium | uterine corpus endometrioid carcinoma | Female | >=65 | I/II | Unknown | Unknown | SD |
| CEBPG | SNV | Missense_Mutation | novel | c.278N>A | p.Arg93Lys | p.R93K | P53567 | protein_coding | tolerated(0.37) | benign(0.01) | TCGA-FI-A2D5-01 | Endometrium | uterine corpus endometrioid carcinoma | Female | <65 | III/IV | Chemotherapy | carboplatinum | PD |
| CEBPG | insertion | Frame_Shift_Ins | novel | c.402_403insGTAGAAA | p.Ser135ValfsTer5 | p.S135Vfs*5 | P53567 | protein_coding | TCGA-AP-A053-01 | Endometrium | uterine corpus endometrioid carcinoma | Female | >=65 | I/II | Unknown | Unknown | SD |
| Page: 1 2 |
Top |
Related drugs of malignant transformation related genes |
| Identification of chemicals and drugs interact with genes involved in malignant transfromation |
| (DGIdb 4.0) |
| Entrez ID | Symbol | Category | Interaction Types | Drug Claim Name | Drug Name | PMIDs |
| Page: 1 |

Copyright 2023-Present -The University of Texas Health Science Center at Houston |