
|
|||||
|
 | |
| |
| |
| |
| |
| |
|
Gene: CEACAM7 |
Gene summary for CEACAM7 |
| Gene information | Species | Human | Gene symbol | CEACAM7 | Gene ID | 1087 |
| Gene name | CEA cell adhesion molecule 7 | |
| Gene Alias | CGM2 | |
| Cytomap | 19q13.2 | |
| Gene Type | protein-coding | GO ID | GO:0005575 | UniProtAcc | Q14002 |
Top |
Malignant transformation analysis |
| Identification of the aberrant gene expression in precancerous and cancerous lesions by comparing the gene expression of stem-like cells in diseased tissues with normal stem cells |
| Entrez ID | Symbol | Replicates | Species | Organ | Tissue | Adj P-value | Log2FC | Malignancy |
| 1087 | CEACAM7 | CA_HPV_2 | Human | Cervix | CC | 7.65e-03 | 1.55e-01 | 0.0391 |
| 1087 | CEACAM7 | Tumor | Human | Cervix | CC | 4.00e-05 | 1.95e-01 | 0.1241 |
| 1087 | CEACAM7 | sample3 | Human | Cervix | CC | 5.84e-20 | 4.85e-01 | 0.1387 |
| 1087 | CEACAM7 | H2 | Human | Cervix | HSIL_HPV | 8.49e-22 | 5.62e-01 | 0.0632 |
| 1087 | CEACAM7 | T3 | Human | Cervix | CC | 3.78e-18 | 5.11e-01 | 0.1389 |
| 1087 | CEACAM7 | HTA11_3410_2000001011 | Human | Colorectum | AD | 2.93e-16 | -4.67e-01 | 0.0155 |
| 1087 | CEACAM7 | HTA11_1938_2000001011 | Human | Colorectum | AD | 1.39e-04 | -4.54e-01 | -0.0811 |
| 1087 | CEACAM7 | HTA11_866_2000001011 | Human | Colorectum | AD | 1.04e-02 | -4.21e-02 | -0.1001 |
| 1087 | CEACAM7 | HTA11_5212_2000001011 | Human | Colorectum | AD | 1.80e-07 | 2.13e+00 | -0.2061 |
| 1087 | CEACAM7 | HTA11_7862_2000001011 | Human | Colorectum | AD | 3.35e-03 | -4.67e-01 | -0.0179 |
| 1087 | CEACAM7 | HTA11_866_3004761011 | Human | Colorectum | AD | 3.31e-14 | -4.67e-01 | 0.096 |
| 1087 | CEACAM7 | HTA11_8622_2000001021 | Human | Colorectum | SER | 2.12e-02 | -4.67e-01 | 0.0528 |
| 1087 | CEACAM7 | HTA11_10711_2000001011 | Human | Colorectum | AD | 2.69e-06 | -4.57e-01 | 0.0338 |
| 1087 | CEACAM7 | HTA11_7696_3000711011 | Human | Colorectum | AD | 7.53e-14 | -4.47e-01 | 0.0674 |
| 1087 | CEACAM7 | HTA11_6818_2000001011 | Human | Colorectum | AD | 4.10e-03 | -4.67e-01 | 0.0112 |
| 1087 | CEACAM7 | HTA11_6818_2000001021 | Human | Colorectum | AD | 3.29e-04 | -4.54e-01 | 0.0588 |
| 1087 | CEACAM7 | HTA11_99999970781_79442 | Human | Colorectum | MSS | 2.56e-14 | -4.57e-01 | 0.294 |
| 1087 | CEACAM7 | HTA11_99999965104_69814 | Human | Colorectum | MSS | 8.22e-03 | -3.93e-01 | 0.281 |
| 1087 | CEACAM7 | HTA11_99999971662_82457 | Human | Colorectum | MSS | 7.63e-19 | -4.67e-01 | 0.3859 |
| 1087 | CEACAM7 | HTA11_99999973899_84307 | Human | Colorectum | MSS | 6.67e-05 | -4.67e-01 | 0.2585 |
| Page: 1 2 3 |
| Tissue | Expression Dynamics | Abbreviation |
| Cervix | 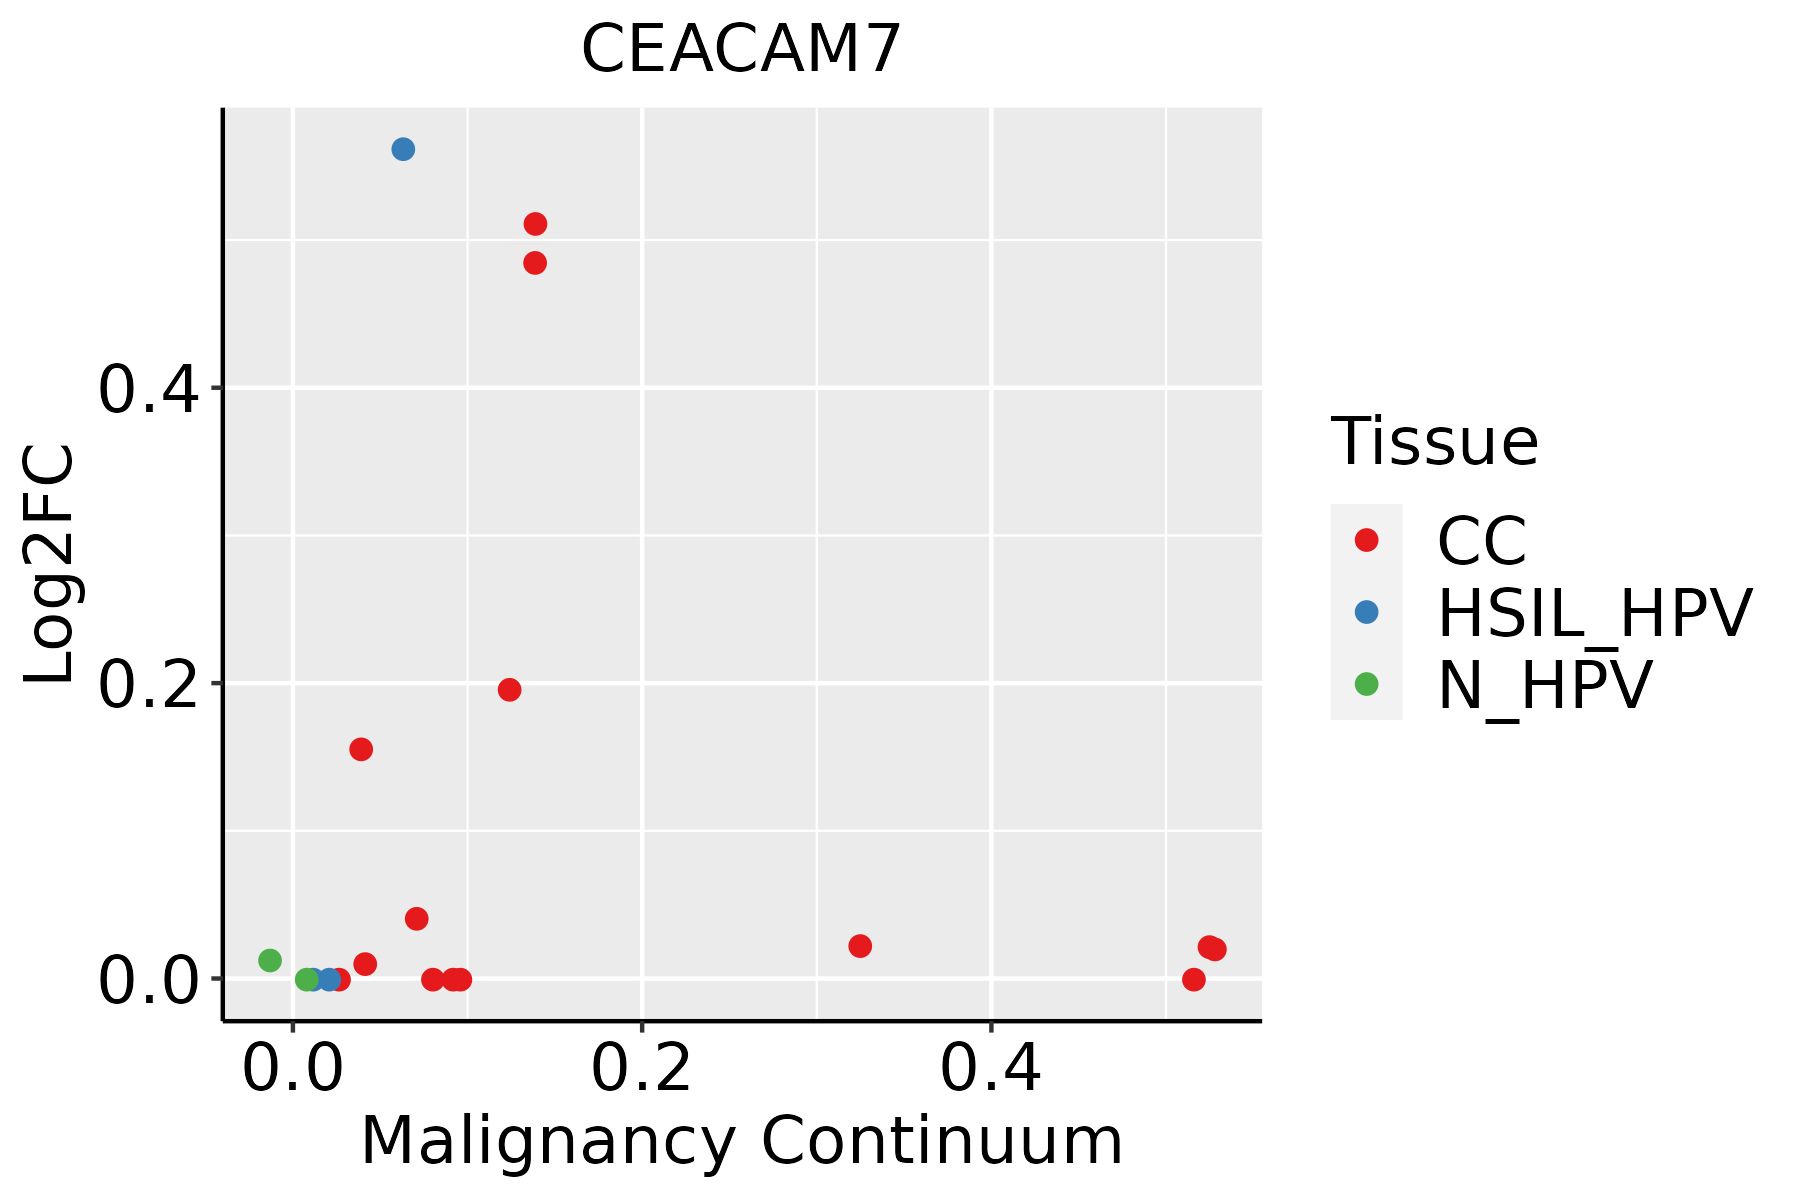 | CC: Cervix cancer |
| HSIL_HPV: HPV-infected high-grade squamous intraepithelial lesions | ||
| N_HPV: HPV-infected normal cervix | ||
| Colorectum (GSE201348) |  | FAP: Familial adenomatous polyposis |
| CRC: Colorectal cancer | ||
| Colorectum (HTA11) |  | AD: Adenomas |
| SER: Sessile serrated lesions | ||
| MSI-H: Microsatellite-high colorectal cancer | ||
| MSS: Microsatellite stable colorectal cancer |
| ∗log2FC in expression of this searched gene in stem-like cells from each diseased tissue sample relative to stem-like cells in normal samples in each tissue plotted against the malignancy continuum. Samples are colored based on if they are from different disease stage. |
Top |
Malignant transformation related pathway analysis |
| Find out the enriched GO biological processes and KEGG pathways involved in transition from healthy to precancer to cancer |
| Tissue | Disease Stage | Enriched GO biological Processes |
| Colorectum | AD |  |
| Colorectum | SER |  |
| Colorectum | MSS |  |
| Colorectum | MSI-H |  |
| Colorectum | FAP |  |
| ∗Top 15 enriched GO BP terms are showed in the bar plot of each disease state in each tissue. Each row represents a significant GO biological process which is colored according to the -log10(p.adjust). |
| Page: 1 2 3 4 5 6 7 8 9 |
| GO ID | Tissue | Disease Stage | Description | Gene Ratio | Bg Ratio | pvalue | p.adjust | Count |
| Page: 1 |
| Pathway ID | Tissue | Disease Stage | Description | Gene Ratio | Bg Ratio | pvalue | p.adjust | qvalue | Count |
| Page: 1 |
Top |
Cell-cell communication analysis |
| Identification of potential cell-cell interactions between two cell types and their ligand-receptor pairs for different disease states |
| Ligand | Receptor | LRpair | Pathway | Tissue | Disease Stage |
| Page: 1 |
Top |
Single-cell gene regulatory network inference analysis |
| Find out the significant the regulons (TFs) and the target genes of each regulon across cell types for different disease states |
| TF | Cell Type | Tissue | Disease Stage | Target Gene | RSS | Regulon Activity |
| ∗The dot plots of a searched regulon are shown for all cell subpopulations in each disease state of each tissue based on the regulon specific score inferred using pySCENIC and by calculating the average expression. |
| Page: 1 |
Top |
Somatic mutation of malignant transformation related genes |
| Annotation of somatic variants for genes involved in malignant transformation |
| Hugo Symbol | Variant Class | Variant Classification | dbSNP RS | HGVSc | HGVSp | HGVSp Short | SWISSPROT | BIOTYPE | SIFT | PolyPhen | Tumor Sample Barcode | Tissue | Histology | Sex | Age | Stage | Therapy Types | Drugs | Outcome |
| CEACAM7 | insertion | Nonsense_Mutation | novel | c.441_442insGGCAGCTGCTTGGGGTGAGGCCTGGCCTCAGA | p.Pro148GlyfsTer6 | p.P148Gfs*6 | Q14002 | protein_coding | TCGA-AN-A0FY-01 | Breast | breast invasive carcinoma | Female | <65 | I/II | Unknown | Unknown | SD | ||
| CEACAM7 | insertion | Nonsense_Mutation | novel | c.438_439insCTTCTACCCCAGATATATCTTACGAGTTAGGAGCAAACCTTAG | p.Lys147LeufsTer10 | p.K147Lfs*10 | Q14002 | protein_coding | TCGA-AO-A03T-01 | Breast | breast invasive carcinoma | Female | <65 | I/II | Chemotherapy | cyclophosphamide | SD | ||
| CEACAM7 | SNV | Missense_Mutation | novel | c.218N>G | p.Val73Gly | p.V73G | Q14002 | protein_coding | deleterious(0.02) | probably_damaging(0.978) | TCGA-C5-A1BF-01 | Cervix | cervical & endocervical cancer | Female | <65 | I/II | Chemotherapy | cisplatin | PD |
| CEACAM7 | SNV | Missense_Mutation | rs782285346 | c.136N>A | p.Ala46Thr | p.A46T | Q14002 | protein_coding | tolerated(0.06) | benign(0.416) | TCGA-EA-A3QD-01 | Cervix | cervical & endocervical cancer | Female | <65 | III/IV | Chemotherapy | cisplatin | CR |
| CEACAM7 | SNV | Missense_Mutation | rs199608746 | c.68N>T | p.Ser23Leu | p.S23L | Q14002 | protein_coding | deleterious(0.04) | probably_damaging(1) | TCGA-LP-A4AV-01 | Cervix | cervical & endocervical cancer | Female | <65 | I/II | Unknown | Unknown | SD |
| CEACAM7 | insertion | In_Frame_Ins | novel | c.490_491insGCTGCA | p.Val164delinsGlyCysMet | p.V164delinsGCM | Q14002 | protein_coding | TCGA-DS-A1OB-01 | Cervix | cervical & endocervical cancer | Female | <65 | I/II | Chemotherapy | carboplatin | PD | ||
| CEACAM7 | SNV | Missense_Mutation | c.765G>T | p.Met255Ile | p.M255I | Q14002 | protein_coding | tolerated(0.13) | benign(0) | TCGA-AA-A010-01 | Colorectum | colon adenocarcinoma | Female | <65 | I/II | Chemotherapy | folinic | CR | |
| CEACAM7 | SNV | Missense_Mutation | novel | c.119N>C | p.Val40Ala | p.V40A | Q14002 | protein_coding | tolerated(0.49) | benign(0.001) | TCGA-AG-3892-01 | Colorectum | rectum adenocarcinoma | Female | <65 | I/II | Unknown | Unknown | SD |
| CEACAM7 | SNV | Missense_Mutation | rs201819691 | c.233N>A | p.Arg78Gln | p.R78Q | Q14002 | protein_coding | tolerated(0.72) | benign(0.138) | TCGA-AG-A002-01 | Colorectum | rectum adenocarcinoma | Male | <65 | I/II | Unknown | Unknown | SD |
| CEACAM7 | SNV | Missense_Mutation | c.778N>A | p.Ala260Thr | p.A260T | Q14002 | protein_coding | deleterious(0.01) | probably_damaging(0.993) | TCGA-A5-A0R7-01 | Endometrium | uterine corpus endometrioid carcinoma | Female | <65 | I/II | Unknown | Unknown | SD |
| Page: 1 2 3 4 |
Top |
Related drugs of malignant transformation related genes |
| Identification of chemicals and drugs interact with genes involved in malignant transfromation |
| (DGIdb 4.0) |
| Entrez ID | Symbol | Category | Interaction Types | Drug Claim Name | Drug Name | PMIDs |
| 1087 | CEACAM7 | DRUGGABLE GENOME | IFN | 14636419 |
| Page: 1 |

Copyright 2023-Present -The University of Texas Health Science Center at Houston |