Schematic overview of the cellular and molecular mechanisms involved in the cancer progression, including the proposed cellular and molecular mechanisms in cancer cells trajectory. AT1: alveolar type 1 cells; AT2: alveolar type 2 cells; AAH: atypical adenomatous hyperplasia; AIS: adenocarcinoma in situ; MIA: minimally invasive adenocarcinoma; IA: invasive adenocarcinoma; EMT: epithelial-mesenchymal transition

Home

Download

Statistics

Help

Contact

Center for Computational Systems Medicine
leaf

Gene summary

leaf

Malignant transformation analysis

leaf

Malignant transformation related pathway analysis

leaf

Cell-cell communication analysis

leaf

Single-cell gene regulatory network inference analysis

leaf

Somatic mutation of malignant transformation related genes

leaf

Related drugs of malignant transformation related genes

Gene: CEACAM6

Gene summary for CEACAM6

check button Gene summary.

Gene informationSpeciesHuman
Gene symbol

CEACAM6

Gene ID

4680

Gene nameCEA cell adhesion molecule 6
Gene AliasCD66c
Cytomap19q13.2
Gene Typeprotein-coding
GO ID

GO:0001952

UniProtAcc

P40199


Top

Malignant transformation analysis

check button Identification of the aberrant gene expression in precancerous and cancerous lesions by comparing the gene expression of stem-like cells in diseased tissues with normal stem cells
check button Malignant transformation involving gene list.
Entrez IDSymbolReplicatesSpeciesOrganTissueAdj P-valueLog2FCMalignancy
4680CEACAM6HTA11_3410_2000001011HumanColorectumAD2.49e-05-3.34e-010.0155
4680CEACAM6HTA11_7696_3000711011HumanColorectumAD1.28e-04-2.93e-010.0674
4680CEACAM6HTA11_99999970781_79442HumanColorectumMSS6.57e-06-2.91e-010.294
4680CEACAM6HTA11_99999965104_69814HumanColorectumMSS1.13e-081.23e+000.281
4680CEACAM6HTA11_99999971662_82457HumanColorectumMSS4.74e-087.54e-010.3859
4680CEACAM6HTA11_99999973899_84307HumanColorectumMSS1.49e-171.55e+000.2585
4680CEACAM6A015-C-203HumanColorectumFAP1.28e-07-2.82e-01-0.1294
4680CEACAM6A001-C-119HumanColorectumFAP1.07e-02-3.19e-01-0.1557
4680CEACAM6A002-C-205HumanColorectumFAP9.77e-06-3.17e-01-0.1236
4680CEACAM6A014-C-108HumanColorectumFAP1.31e-03-3.28e-01-0.124
4680CEACAM6A001-C-104HumanColorectumFAP3.29e-04-2.69e-010.0184
4680CEACAM6A015-C-006HumanColorectumFAP2.14e-03-3.22e-01-0.0994
4680CEACAM6A015-C-106HumanColorectumFAP3.28e-04-2.59e-01-0.0511
4680CEACAM6A002-C-114HumanColorectumFAP7.47e-03-2.71e-01-0.1561
4680CEACAM6A015-C-104HumanColorectumFAP6.27e-09-3.09e-01-0.1899
4680CEACAM6A015-C-202HumanColorectumFAP2.33e-09-3.45e-01-0.0849
4680CEACAM6A001-C-014HumanColorectumFAP1.06e-04-2.22e-010.0135
4680CEACAM6A002-C-016HumanColorectumFAP4.35e-02-9.82e-020.0521
4680CEACAM6A001-C-203HumanColorectumFAP2.42e-07-3.17e-01-0.0481
4680CEACAM6A002-C-116HumanColorectumFAP2.63e-06-2.42e-01-0.0452
Page: 1 2 3 4 5 

check button Transcriptomic changes along malignancy continuum.
TissueExpression DynamicsAbbreviation
Colorectum (GSE201348)The image shows the transcriptomic changes along malignancy continuum.log2FC in expression of this searched gene in stem-like cells from each diseased tissue sample relative to stem-like cells in normal samples in each tissue plotted against the malignancy continuum. Samples are colored based on if they are from different disease stage.FAP: Familial adenomatous polyposis
CRC: Colorectal cancer
Colorectum (HTA11)The image shows the transcriptomic changes along malignancy continuum.log2FC in expression of this searched gene in stem-like cells from each diseased tissue sample relative to stem-like cells in normal samples in each tissue plotted against the malignancy continuum. Samples are colored based on if they are from different disease stage.AD: Adenomas
SER: Sessile serrated lesions
MSI-H: Microsatellite-high colorectal cancer
MSS: Microsatellite stable colorectal cancer
EsophagusThe image shows the transcriptomic changes along malignancy continuum.log2FC in expression of this searched gene in stem-like cells from each diseased tissue sample relative to stem-like cells in normal samples in each tissue plotted against the malignancy continuum. Samples are colored based on if they are from different disease stage.
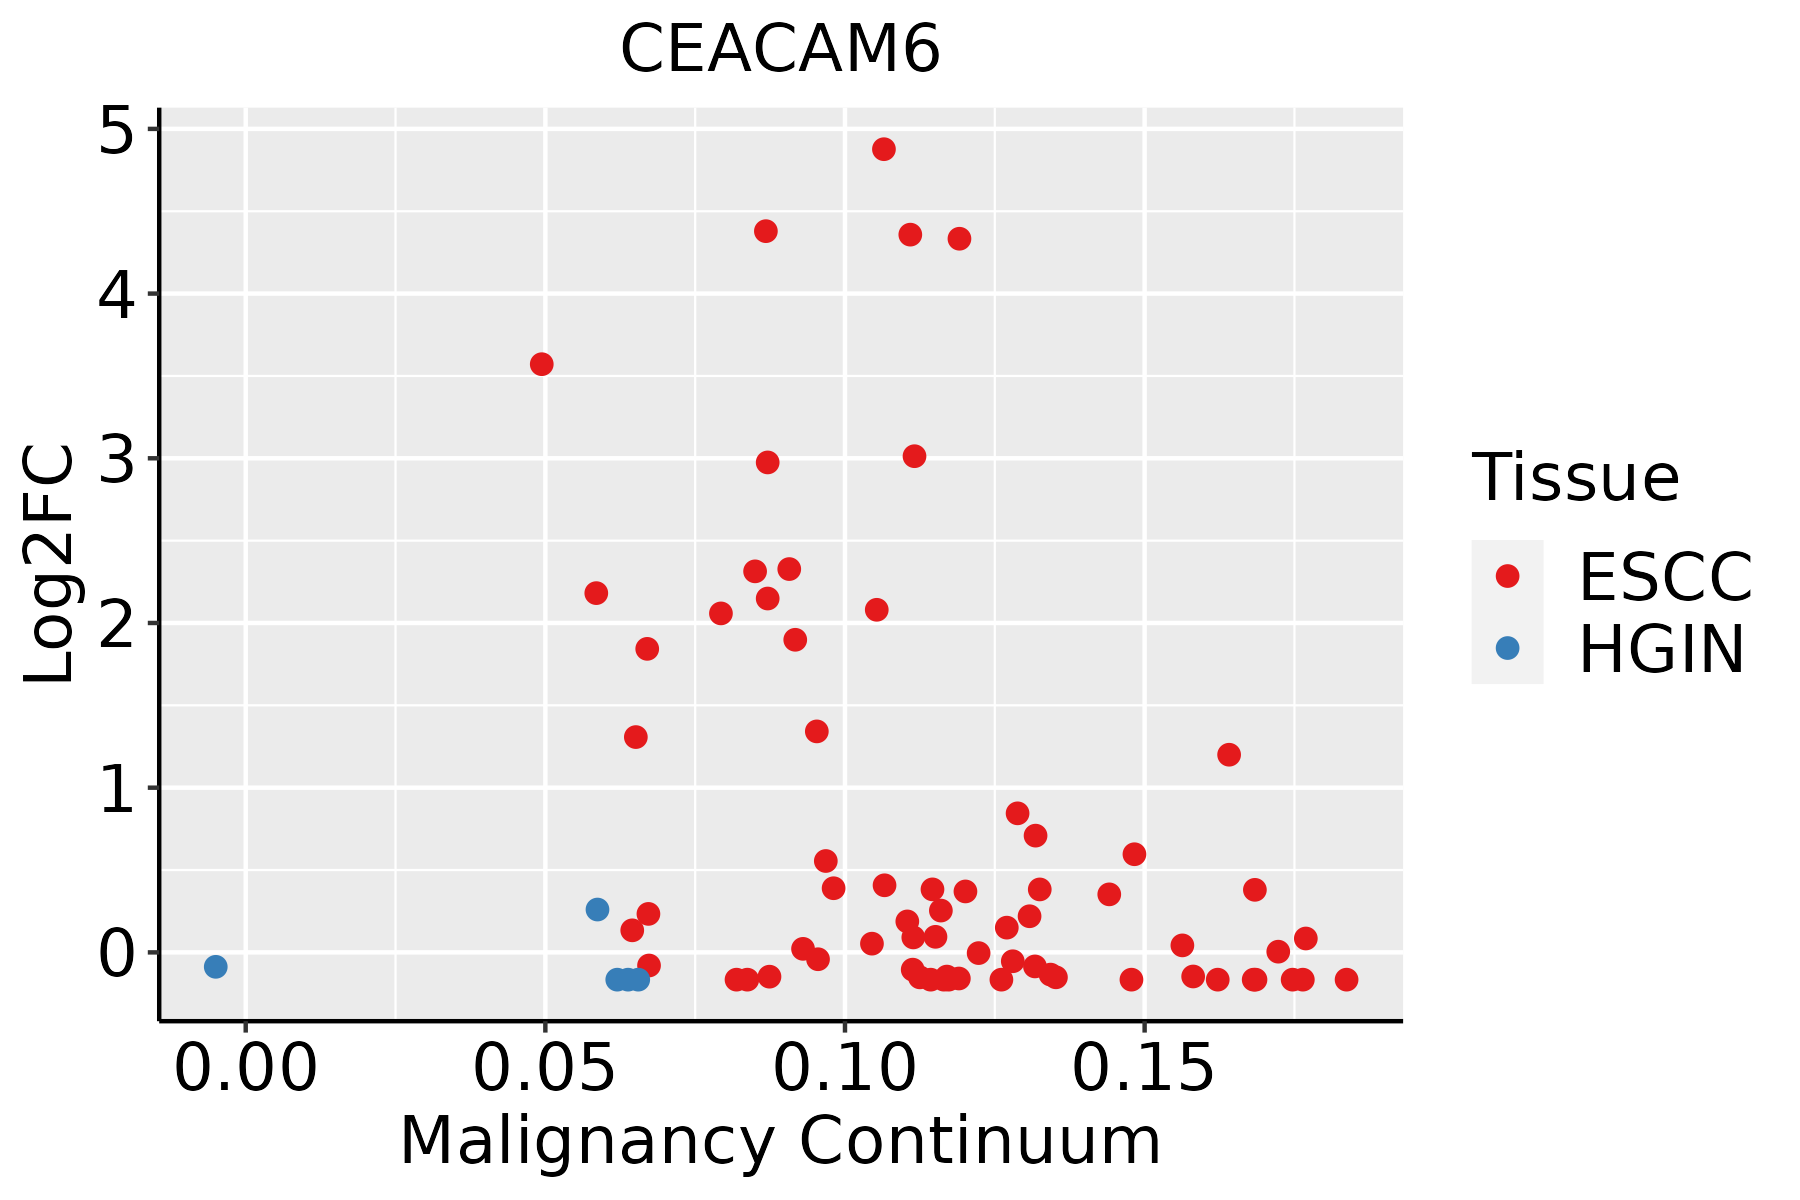
ESCC: Esophageal squamous cell carcinoma
HGIN: High-grade intraepithelial neoplasias
LGIN: Low-grade intraepithelial neoplasias
GCThe image shows the transcriptomic changes along malignancy continuum.log2FC in expression of this searched gene in stem-like cells from each diseased tissue sample relative to stem-like cells in normal samples in each tissue plotted against the malignancy continuum. Samples are colored based on if they are from different disease stage.
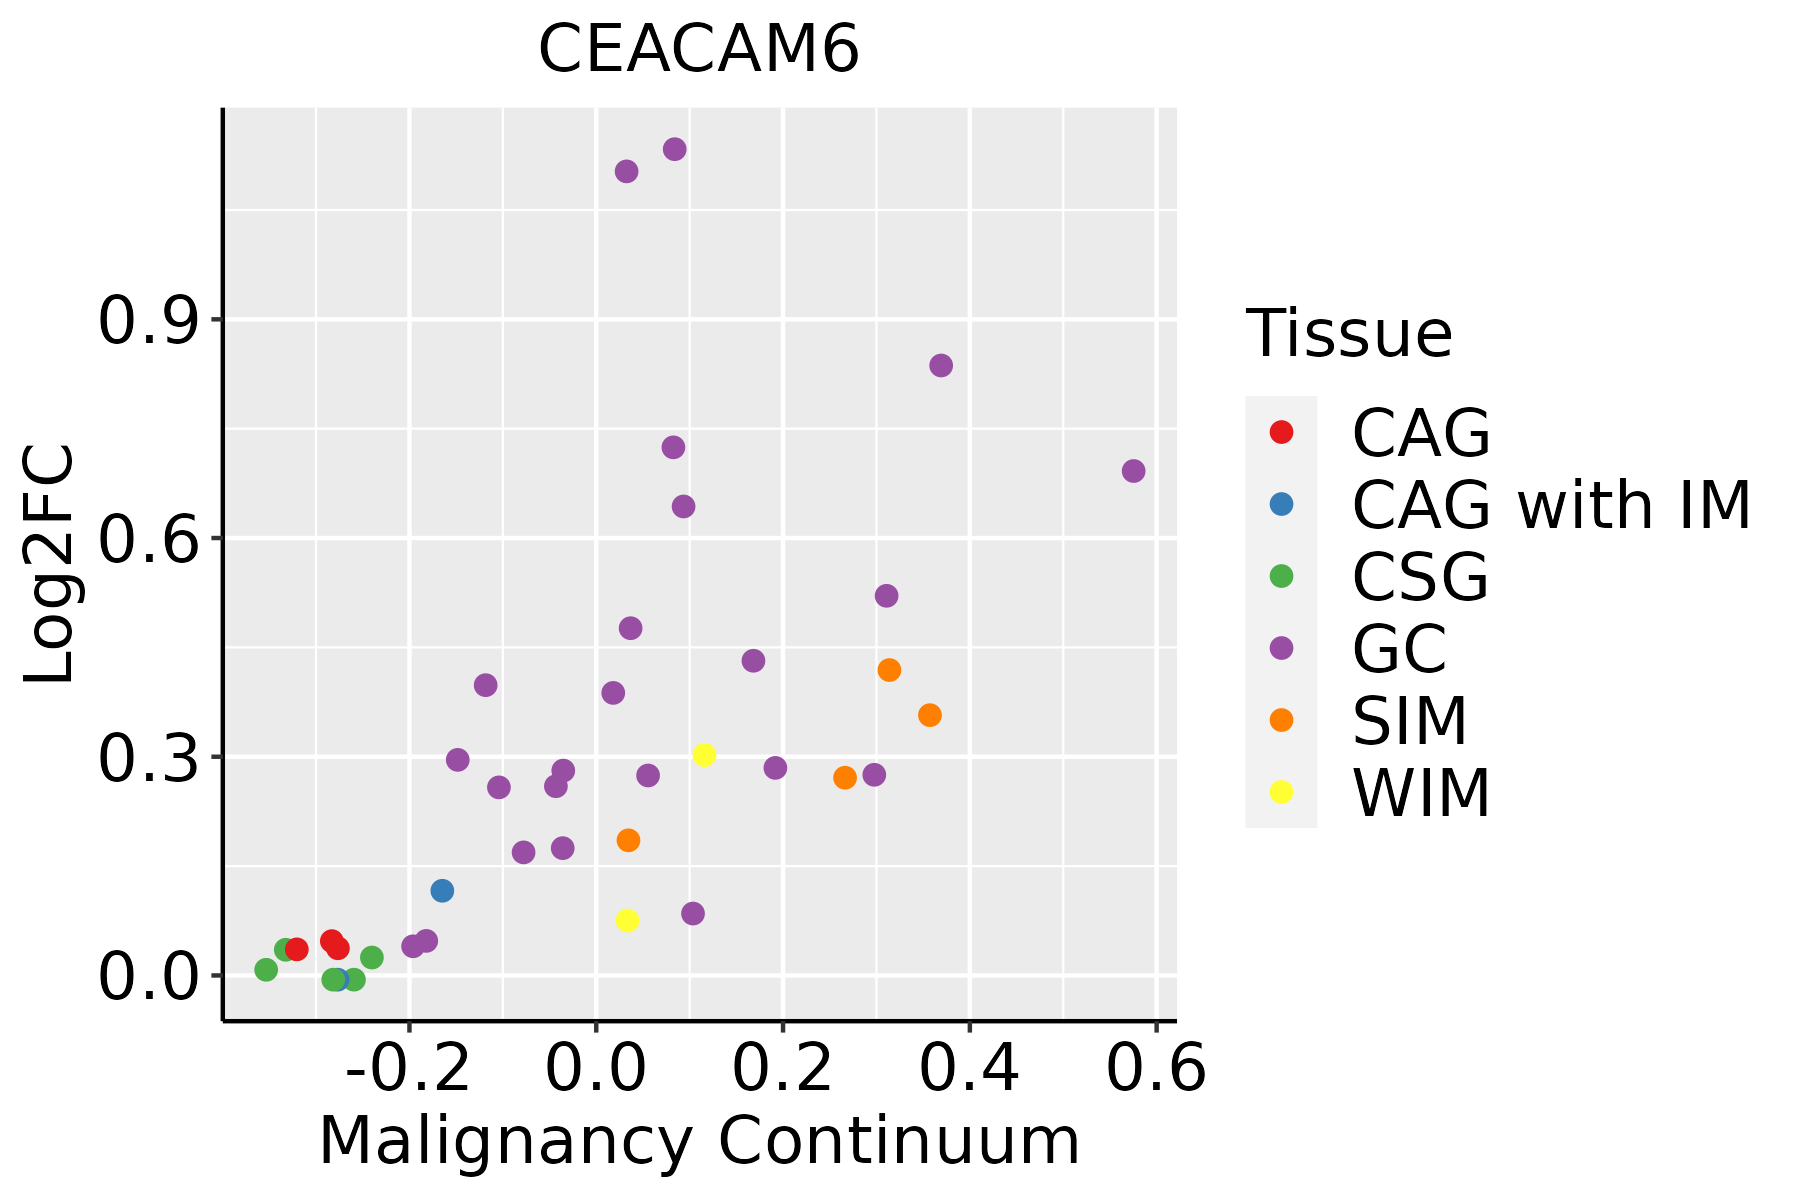
CAG: Chronic atrophic gastritis
CAG with IM: Chronic atrophic gastritis with intestinal metaplasia
CSG: Chronic superficial gastritis
GC: Gastric cancer
SIM: Severe intestinal metaplasia
WIM: Wild intestinal metaplasia
LungThe image shows the transcriptomic changes along malignancy continuum.log2FC in expression of this searched gene in stem-like cells from each diseased tissue sample relative to stem-like cells in normal samples in each tissue plotted against the malignancy continuum. Samples are colored based on if they are from different disease stage.
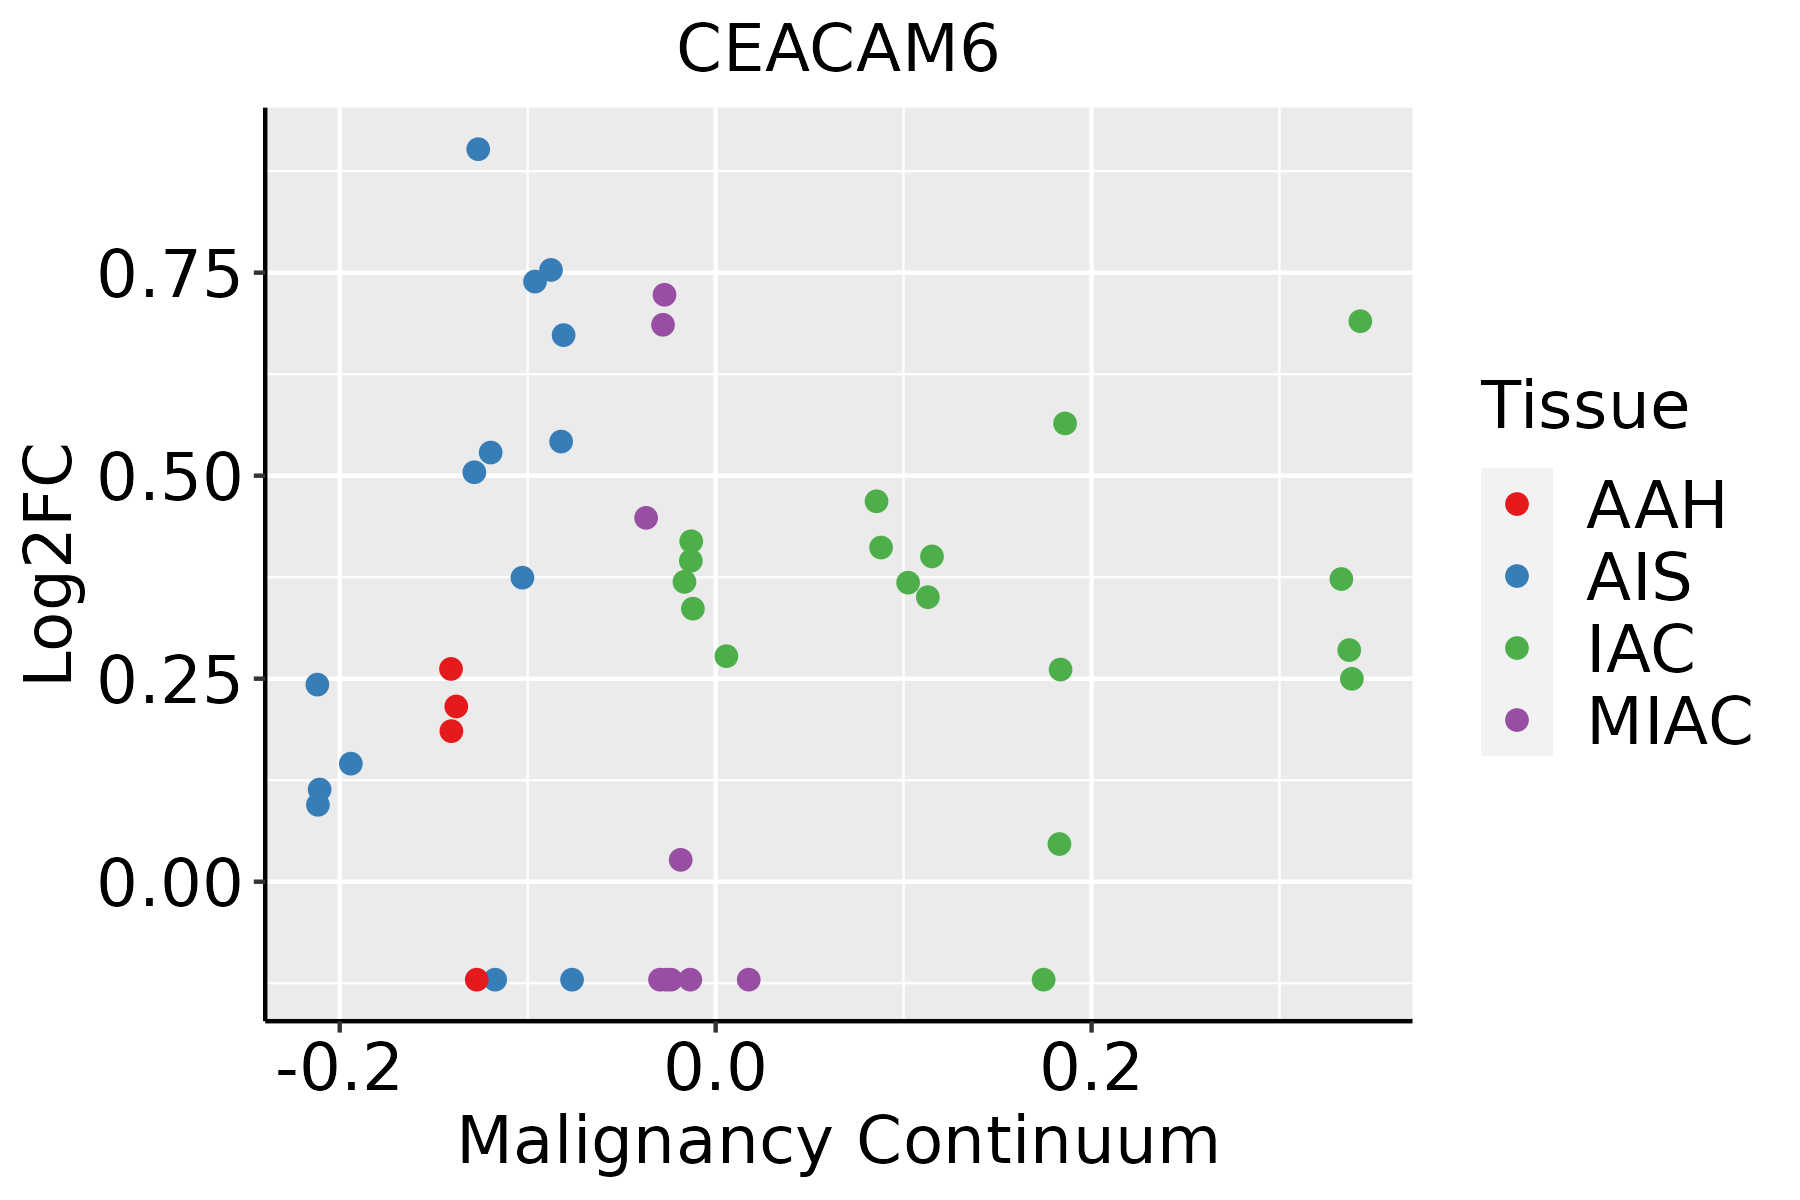
AAH: Atypical adenomatous hyperplasia
AIS: Adenocarcinoma in situ
IAC: Invasive lung adenocarcinoma
MIA: Minimally invasive adenocarcinoma
Oral CavityThe image shows the transcriptomic changes along malignancy continuum.log2FC in expression of this searched gene in stem-like cells from each diseased tissue sample relative to stem-like cells in normal samples in each tissue plotted against the malignancy continuum. Samples are colored based on if they are from different disease stage.
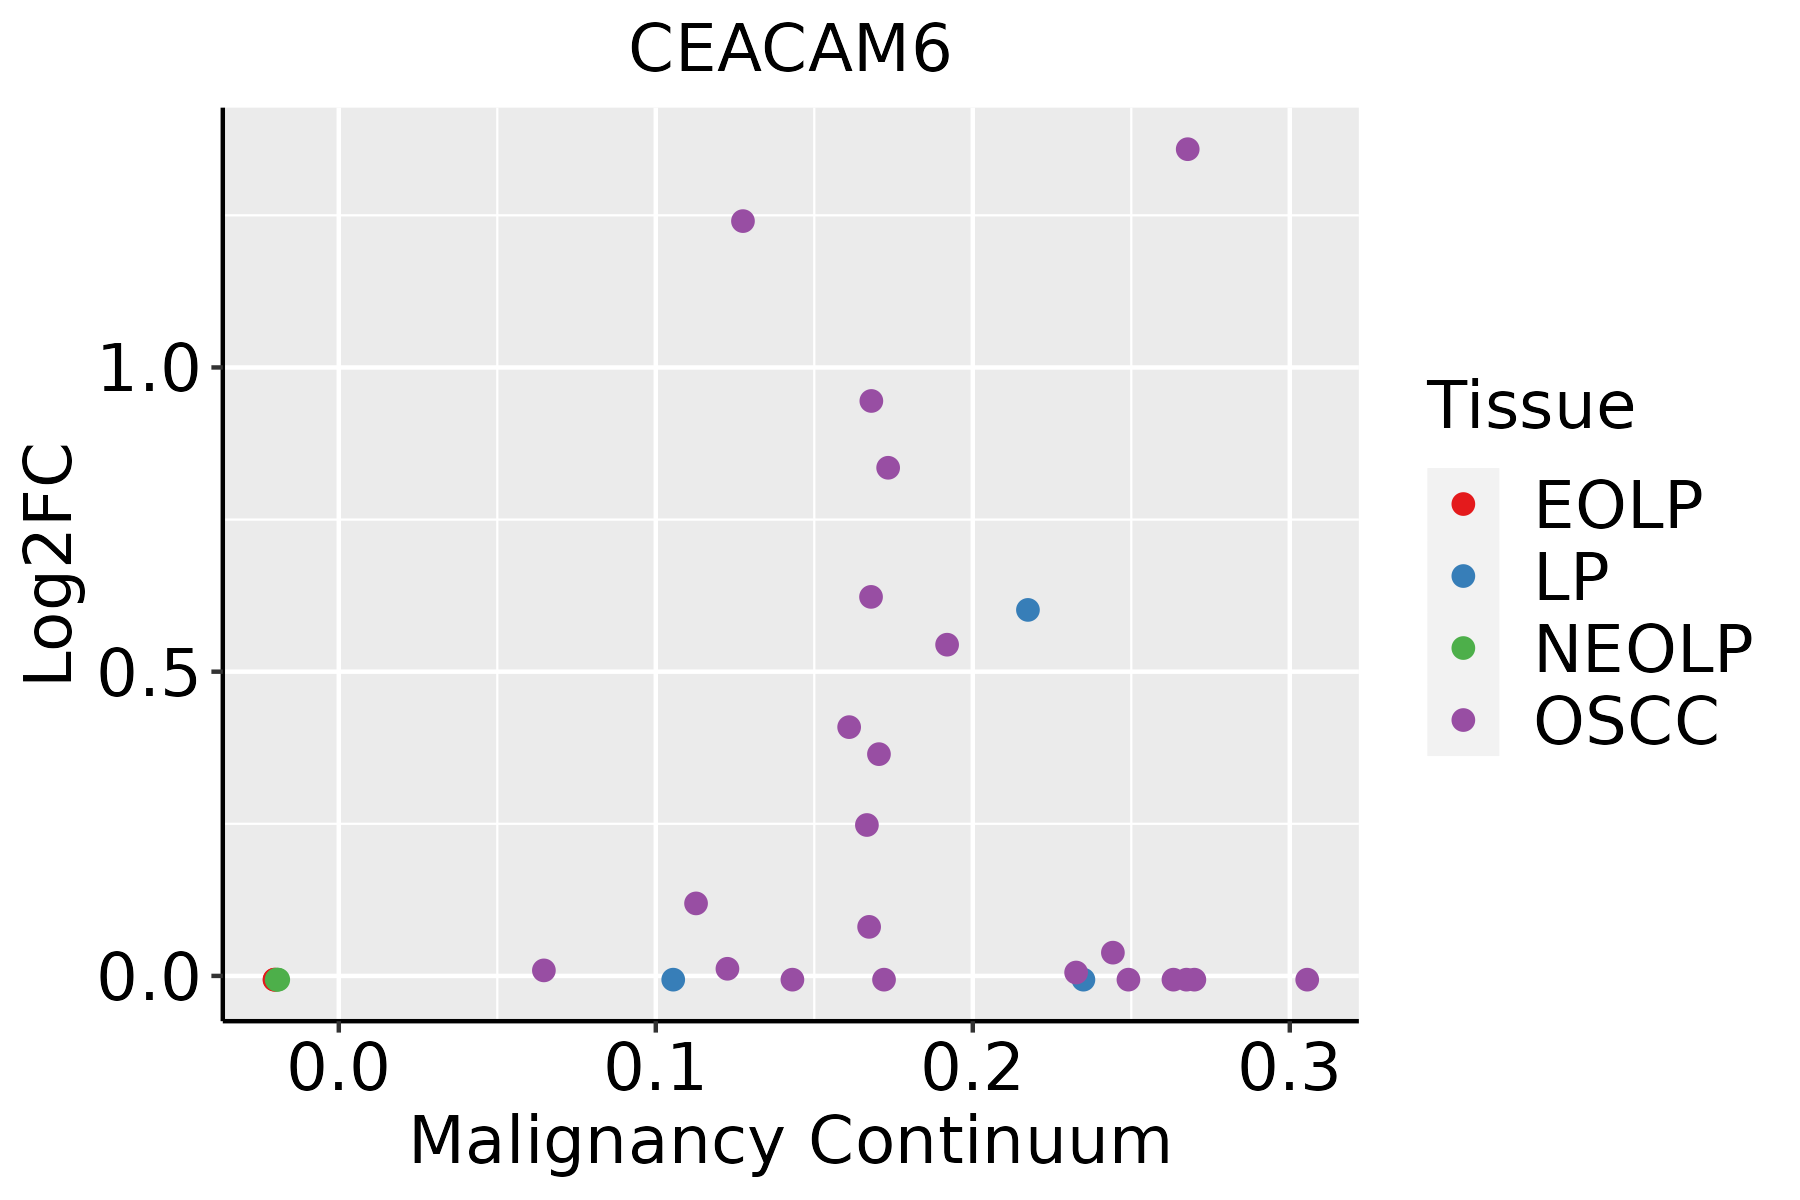
EOLP: Erosive Oral lichen planus
LP: leukoplakia
NEOLP: Non-erosive oral lichen planus
OSCC: Oral squamous cell carcinoma
∗log2FC in expression of this searched gene in stem-like cells from each diseased tissue sample relative to stem-like cells in normal samples in each tissue plotted against the malignancy continuum. Samples are colored based on if they are from different disease stage.

Top

Malignant transformation related pathway analysis

check buttonFind out the enriched GO biological processes and KEGG pathways involved in transition from healthy to precancer to cancer
check button Figure of enriched GO biological processes.
TissueDisease StageEnriched GO biological Processes
ColorectumADGO analysis - Figure of enriched GO biological processes: Top 15 enriched GO BP terms are showed in the bar plot of each disease state in each tissue. Each row represents a significant GO biological process which is colored according to the -log10(p.adjust).
ColorectumSERGO analysis - Figure of enriched GO biological processes: Top 15 enriched GO BP terms are showed in the bar plot of each disease state in each tissue. Each row represents a significant GO biological process which is colored according to the -log10(p.adjust).
ColorectumMSSGO analysis - Figure of enriched GO biological processes: Top 15 enriched GO BP terms are showed in the bar plot of each disease state in each tissue. Each row represents a significant GO biological process which is colored according to the -log10(p.adjust).
ColorectumMSI-HGO analysis - Figure of enriched GO biological processes: Top 15 enriched GO BP terms are showed in the bar plot of each disease state in each tissue. Each row represents a significant GO biological process which is colored according to the -log10(p.adjust).
ColorectumFAPGO analysis - Figure of enriched GO biological processes: Top 15 enriched GO BP terms are showed in the bar plot of each disease state in each tissue. Each row represents a significant GO biological process which is colored according to the -log10(p.adjust).
∗Top 15 enriched GO BP terms are showed in the bar plot of each disease state in each tissue. Each row represents a significant GO biological process which is colored according to the -log10(p.adjust).
Page: 1 2 3 4 5 6 7 8 9 

check button Enriched GO biological processes.
GO IDTissueDisease StageDescriptionGene RatioBg Ratiopvaluep.adjustCount
GO:0010811ColorectumADpositive regulation of cell-substrate adhesion53/3918123/187232.30e-081.27e-0653
GO:0010810ColorectumADregulation of cell-substrate adhesion81/3918221/187234.80e-082.55e-0681
GO:0031589ColorectumADcell-substrate adhesion116/3918363/187234.68e-071.76e-05116
GO:0001952ColorectumADregulation of cell-matrix adhesion50/3918128/187232.05e-066.05e-0550
GO:0001954ColorectumADpositive regulation of cell-matrix adhesion27/391858/187231.12e-052.55e-0427
GO:0007160ColorectumADcell-matrix adhesion75/3918233/187233.56e-056.45e-0475
GO:0045785ColorectumADpositive regulation of cell adhesion122/3918437/187232.65e-043.28e-03122
GO:00108102ColorectumMSSregulation of cell-substrate adhesion73/3467221/187231.56e-077.16e-0673
GO:00108112ColorectumMSSpositive regulation of cell-substrate adhesion47/3467123/187232.28e-079.79e-0647
GO:00315892ColorectumMSScell-substrate adhesion104/3467363/187231.35e-064.51e-05104
GO:00019522ColorectumMSSregulation of cell-matrix adhesion45/3467128/187235.75e-061.53e-0445
GO:00019542ColorectumMSSpositive regulation of cell-matrix adhesion23/346758/187231.39e-042.06e-0323
GO:00071602ColorectumMSScell-matrix adhesion65/3467233/187232.77e-043.67e-0365
GO:00457852ColorectumMSSpositive regulation of cell adhesion110/3467437/187232.94e-043.87e-03110
GO:00108104ColorectumFAPregulation of cell-substrate adhesion68/2622221/187239.67e-112.96e-0868
GO:00315893ColorectumFAPcell-substrate adhesion93/2622363/187232.48e-094.61e-0793
GO:00108114ColorectumFAPpositive regulation of cell-substrate adhesion43/2622123/187233.82e-096.33e-0743
GO:00019523ColorectumFAPregulation of cell-matrix adhesion42/2622128/187234.73e-083.86e-0642
GO:00071603ColorectumFAPcell-matrix adhesion63/2622233/187231.13e-077.43e-0663
GO:00019543ColorectumFAPpositive regulation of cell-matrix adhesion22/262258/187235.19e-061.68e-0422
Page: 1 2 3 4 5 

check button Enriched KEGG pathways.
Pathway IDTissueDisease StageDescriptionGene RatioBg Ratiopvaluep.adjustqvalueCount
Page: 1 

Top

Cell-cell communication analysis

check buttonIdentification of potential cell-cell interactions between two cell types and their ligand-receptor pairs for different disease states
LigandReceptorLRpairPathwayTissueDisease Stage
Page: 1 

Top

Single-cell gene regulatory network inference analysis

check buttonFind out the significant the regulons (TFs) and the target genes of each regulon across cell types for different disease states
TFCell TypeTissueDisease StageTarget GeneRSSRegulon Activity
∗The dot plots of a searched regulon are shown for all cell subpopulations in each disease state of each tissue based on the regulon specific score inferred using pySCENIC and by calculating the average expression.
Page: 1 

Top

Somatic mutation of malignant transformation related genes

check buttonAnnotation of somatic variants for genes involved in malignant transformation
Hugo SymbolVariant ClassVariant ClassificationdbSNP RSHGVScHGVSpHGVSp ShortSWISSPROTBIOTYPESIFTPolyPhenTumor Sample BarcodeTissueHistologySexAgeStageTherapy TypesDrugsOutcome
CEACAM6SNVMissense_Mutationrs782366279c.557N>Tp.Pro186Leup.P186LP40199protein_codingtolerated(0.1)benign(0.077)TCGA-EW-A1IZ-01Breastbreast invasive carcinomaFemale<65III/IVChemotherapytaxotereSD
CEACAM6insertionFrame_Shift_Insnovelc.651_652insTp.Gln218SerfsTer10p.Q218Sfs*10P40199protein_codingTCGA-A8-A07F-01Breastbreast invasive carcinomaFemale>=65I/IIHormone TherapytamoxiphenSD
CEACAM6insertionNonsense_Mutationnovelc.652_653insGTGCATCTGTTGTGTGACACACACACCTGCCAGGGGCTTTTAp.Gln218delinsArgAlaSerValValTerHisThrHisLeuProGlyAlaPheLysp.Q218delinsRASVV*HTHLPGAFKP40199protein_codingTCGA-A8-A07F-01Breastbreast invasive carcinomaFemale>=65I/IIHormone TherapytamoxiphenSD
CEACAM6insertionNonsense_Mutationnovelc.706_707insCACACAGAAAATACAGCTAGGGGGGCAAAGTAGGACTAAAGCTTp.Gly236AlafsTer7p.G236Afs*7P40199protein_codingTCGA-A8-A07J-01Breastbreast invasive carcinomaFemale<65I/IIChemotherapy5-fluorouracilCR
CEACAM6SNVMissense_Mutationrs143238640c.994N>Ap.Gly332Serp.G332SP40199protein_codingtolerated(0.75)benign(0.08)TCGA-2W-A8YY-01Cervixcervical & endocervical cancerFemale<65I/IIChemotherapycisplatinCR
CEACAM6SNVMissense_Mutationc.29G>Ap.Arg10Lysp.R10KP40199protein_codingtolerated(0.36)benign(0.331)TCGA-JW-A5VL-01Cervixcervical & endocervical cancerFemale<65I/IIUnknownUnknownSD
CEACAM6SNVMissense_Mutationnovelc.215N>Cp.Arg72Thrp.R72TP40199protein_codingtolerated(0.68)benign(0.012)TCGA-VS-A8EL-01Cervixcervical & endocervical cancerFemale<65I/IIChemotherapycisplatinCR
CEACAM6SNVMissense_Mutationc.808N>Ap.Ser270Thrp.S270TP40199protein_codingtolerated(0.11)probably_damaging(0.936)TCGA-F4-6570-01Colorectumcolon adenocarcinomaFemale>=65I/IIUnknownUnknownSD
CEACAM6insertionFrame_Shift_Insnovelc.650_651insGp.Ile217MetfsTer11p.I217Mfs*11P40199protein_codingTCGA-AA-3856-01Colorectumcolon adenocarcinomaMale<65I/IIUnknownUnknownSD
CEACAM6insertionFrame_Shift_Insnovelc.650_651insGp.Ile217MetfsTer11p.I217Mfs*11P40199protein_codingTCGA-AA-3952-01Colorectumcolon adenocarcinomaMale>=65III/IVUnknownUnknownPD
Page: 1 2 3 4 

Top

Related drugs of malignant transformation related genes

check buttonIdentification of chemicals and drugs interact with genes involved in malignant transfromation
(DGIdb 4.0)
Entrez IDSymbolCategoryInteraction TypesDrug Claim NameDrug NamePMIDs
4680CEACAM6CELL SURFACE, DRUGGABLE GENOMEANTISERUM6388310
Page: 1