
|
|||||
|
 | |
| |
| |
| |
| |
| |
|
Gene: CEACAM5 |
Gene summary for CEACAM5 |
| Gene information | Species | Human | Gene symbol | CEACAM5 | Gene ID | 1048 |
| Gene name | CEA cell adhesion molecule 5 | |
| Gene Alias | CD66e | |
| Cytomap | 19q13.2 | |
| Gene Type | protein-coding | GO ID | GO:0006915 | UniProtAcc | A0A024R0K5 |
Top |
Malignant transformation analysis |
| Identification of the aberrant gene expression in precancerous and cancerous lesions by comparing the gene expression of stem-like cells in diseased tissues with normal stem cells |
| Entrez ID | Symbol | Replicates | Species | Organ | Tissue | Adj P-value | Log2FC | Malignancy |
| 1048 | CEACAM5 | CA_HPV_2 | Human | Cervix | CC | 5.88e-12 | 4.17e-01 | 0.0391 |
| 1048 | CEACAM5 | Tumor | Human | Cervix | CC | 1.11e-05 | 2.33e-01 | 0.1241 |
| 1048 | CEACAM5 | sample3 | Human | Cervix | CC | 9.52e-29 | 6.34e-01 | 0.1387 |
| 1048 | CEACAM5 | H2 | Human | Cervix | HSIL_HPV | 4.66e-17 | 5.18e-01 | 0.0632 |
| 1048 | CEACAM5 | T3 | Human | Cervix | CC | 6.98e-25 | 6.70e-01 | 0.1389 |
| 1048 | CEACAM5 | HTA11_3410_2000001011 | Human | Colorectum | AD | 2.12e-32 | 5.66e-01 | 0.0155 |
| 1048 | CEACAM5 | HTA11_2487_2000001011 | Human | Colorectum | SER | 3.57e-45 | 2.22e+00 | -0.1808 |
| 1048 | CEACAM5 | HTA11_2951_2000001011 | Human | Colorectum | AD | 2.17e-09 | 4.66e-01 | 0.0216 |
| 1048 | CEACAM5 | HTA11_1938_2000001011 | Human | Colorectum | AD | 2.78e-57 | 1.70e+00 | -0.0811 |
| 1048 | CEACAM5 | HTA11_78_2000001011 | Human | Colorectum | AD | 1.02e-49 | 1.32e+00 | -0.1088 |
| 1048 | CEACAM5 | HTA11_347_2000001011 | Human | Colorectum | AD | 5.98e-43 | 1.27e+00 | -0.1954 |
| 1048 | CEACAM5 | HTA11_411_2000001011 | Human | Colorectum | SER | 9.56e-24 | 3.39e+00 | -0.2602 |
| 1048 | CEACAM5 | HTA11_2112_2000001011 | Human | Colorectum | SER | 1.09e-30 | 2.65e+00 | -0.2196 |
| 1048 | CEACAM5 | HTA11_3361_2000001011 | Human | Colorectum | AD | 1.12e-31 | 9.94e-01 | -0.1207 |
| 1048 | CEACAM5 | HTA11_83_2000001011 | Human | Colorectum | SER | 1.71e-21 | 1.15e+00 | -0.1526 |
| 1048 | CEACAM5 | HTA11_696_2000001011 | Human | Colorectum | AD | 3.02e-84 | 1.77e+00 | -0.1464 |
| 1048 | CEACAM5 | HTA11_866_2000001011 | Human | Colorectum | AD | 1.31e-55 | 1.34e+00 | -0.1001 |
| 1048 | CEACAM5 | HTA11_1391_2000001011 | Human | Colorectum | AD | 6.80e-58 | 1.76e+00 | -0.059 |
| 1048 | CEACAM5 | HTA11_2992_2000001011 | Human | Colorectum | SER | 2.50e-12 | 8.16e-01 | -0.1706 |
| 1048 | CEACAM5 | HTA11_5212_2000001011 | Human | Colorectum | AD | 1.08e-24 | 1.39e+00 | -0.2061 |
| Page: 1 2 3 4 |
| Tissue | Expression Dynamics | Abbreviation |
| Cervix | 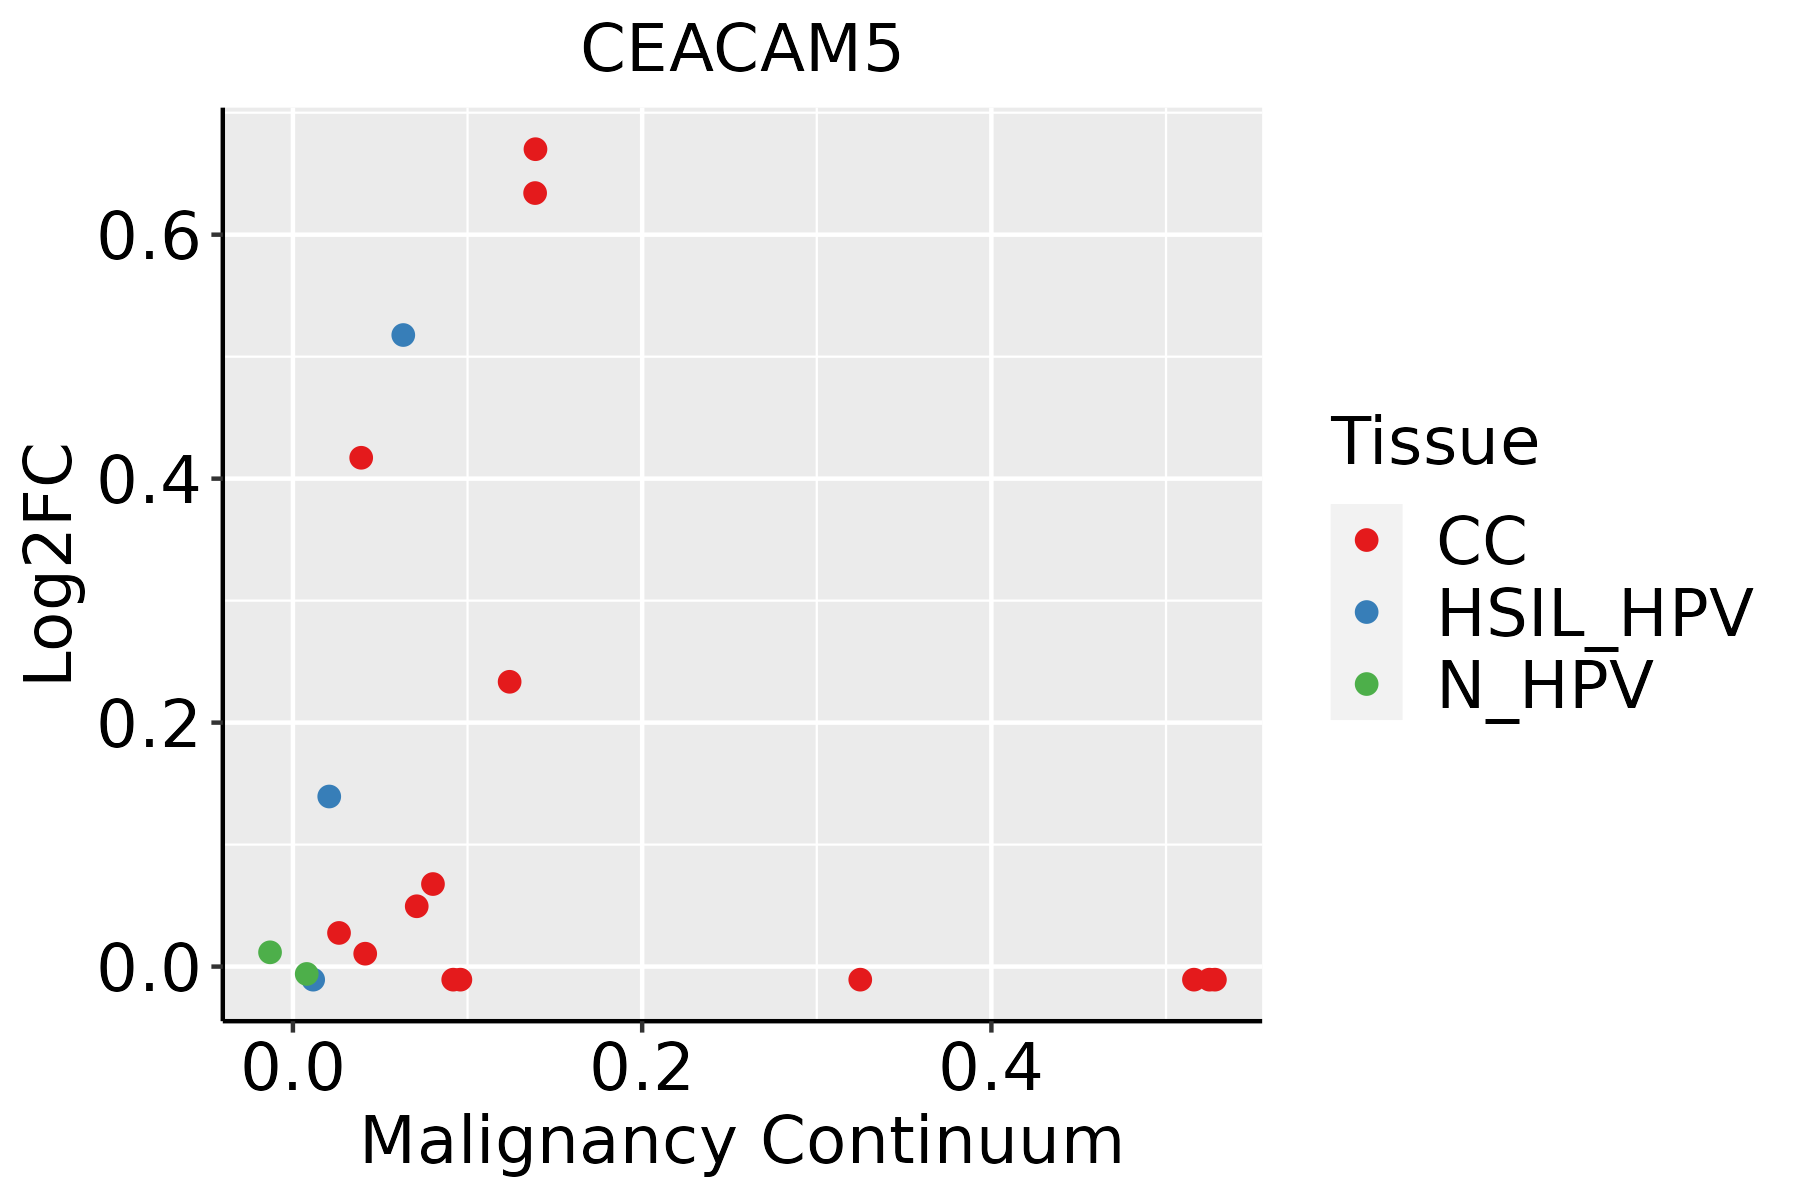 | CC: Cervix cancer |
| HSIL_HPV: HPV-infected high-grade squamous intraepithelial lesions | ||
| N_HPV: HPV-infected normal cervix | ||
| Colorectum (GSE201348) |  | FAP: Familial adenomatous polyposis |
| CRC: Colorectal cancer | ||
| Colorectum (HTA11) |  | AD: Adenomas |
| SER: Sessile serrated lesions | ||
| MSI-H: Microsatellite-high colorectal cancer | ||
| MSS: Microsatellite stable colorectal cancer | ||
| Esophagus |  | ESCC: Esophageal squamous cell carcinoma |
| HGIN: High-grade intraepithelial neoplasias | ||
| LGIN: Low-grade intraepithelial neoplasias | ||
| GC | 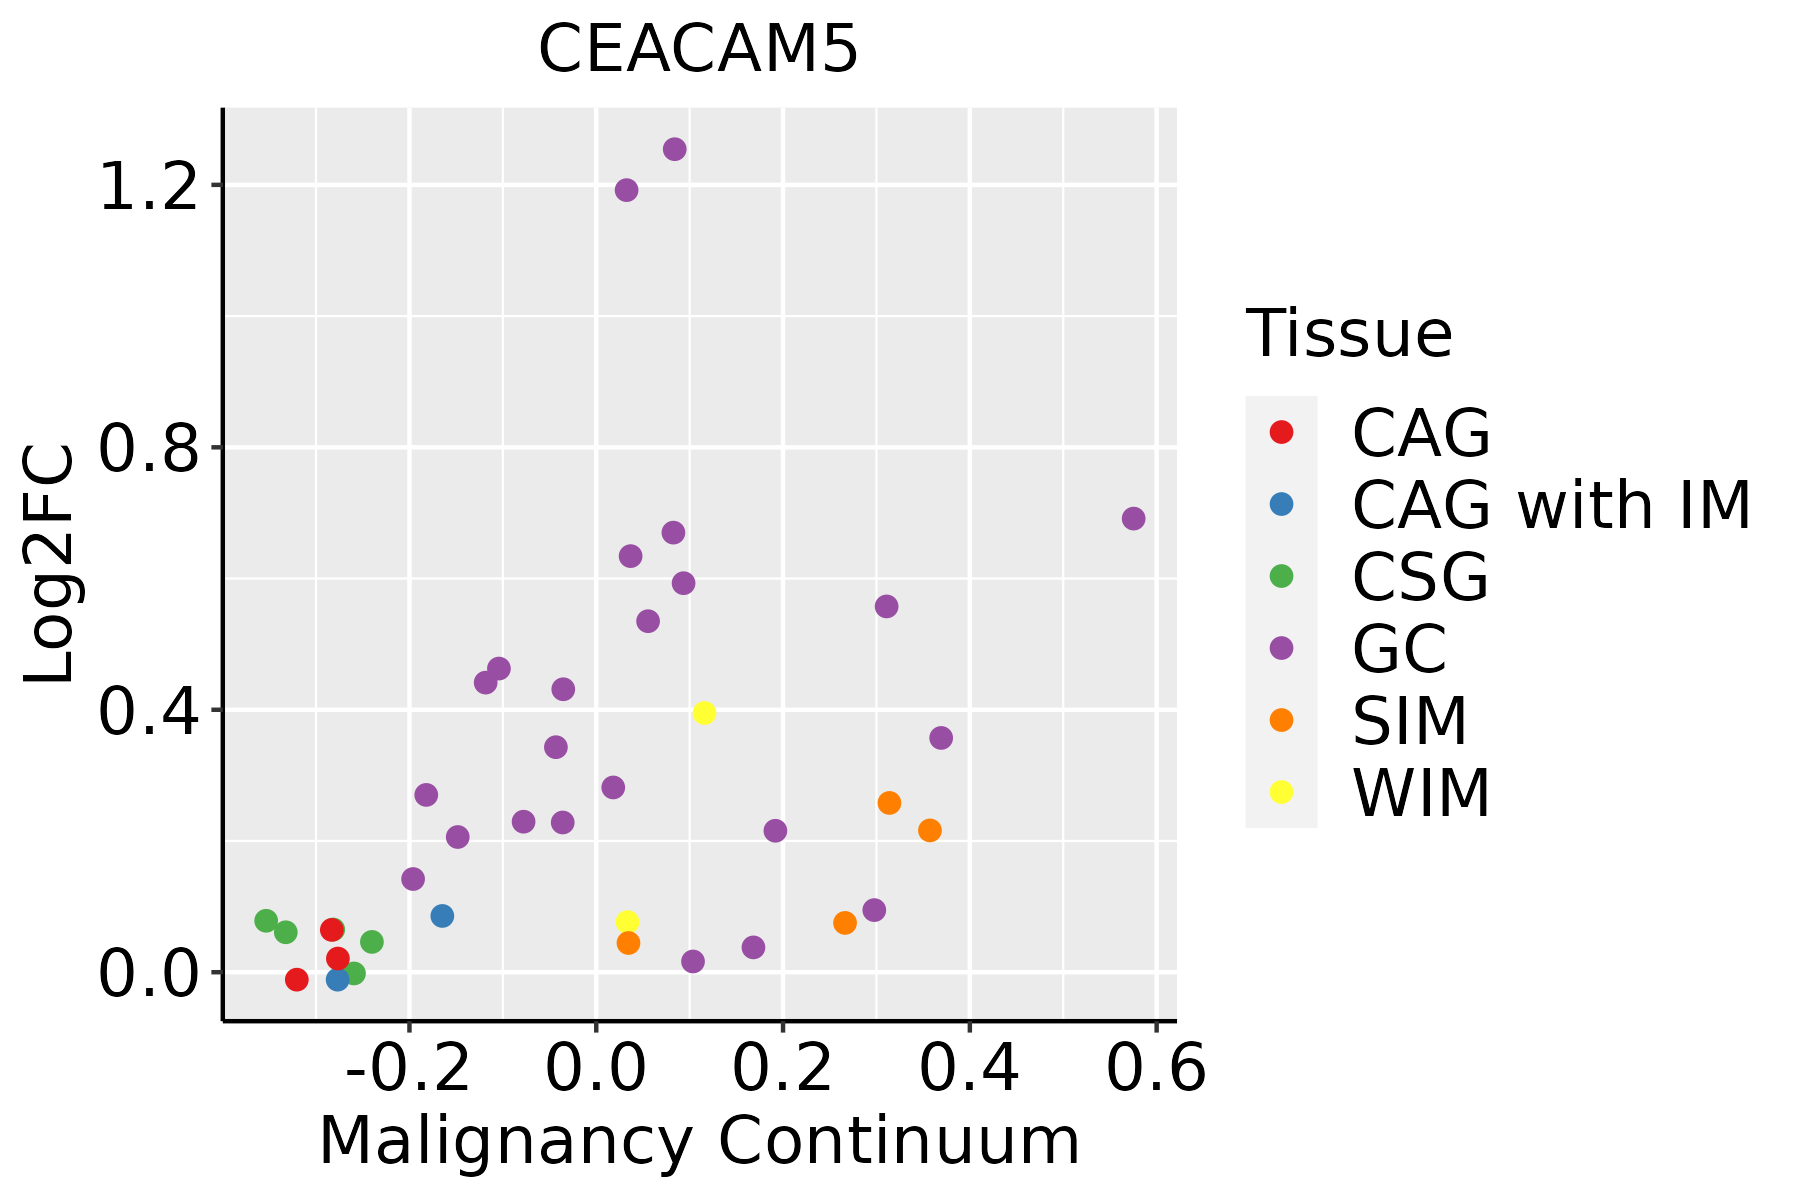 | CAG: Chronic atrophic gastritis |
| CAG with IM: Chronic atrophic gastritis with intestinal metaplasia | ||
| CSG: Chronic superficial gastritis | ||
| GC: Gastric cancer | ||
| SIM: Severe intestinal metaplasia | ||
| WIM: Wild intestinal metaplasia | ||
| Liver | 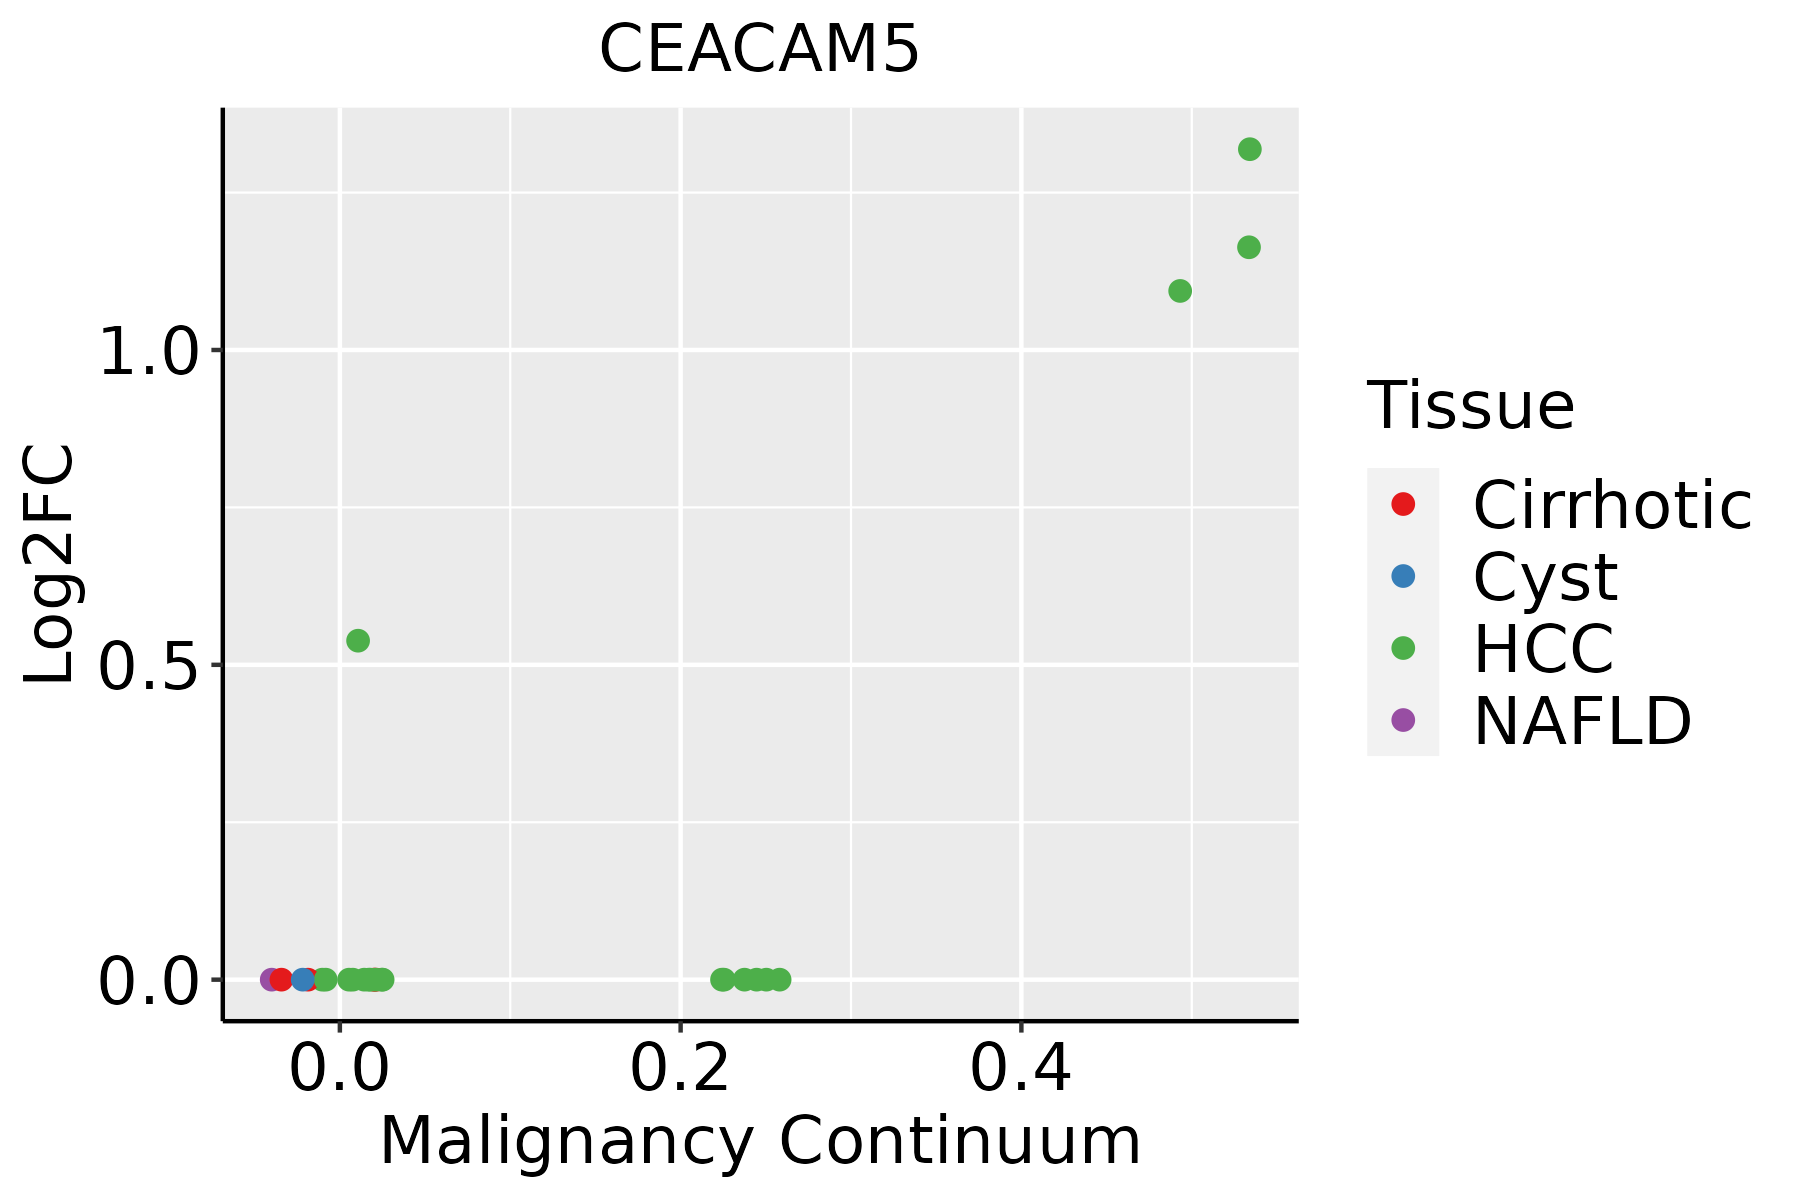 | HCC: Hepatocellular carcinoma |
| NAFLD: Non-alcoholic fatty liver disease | ||
| Lung | 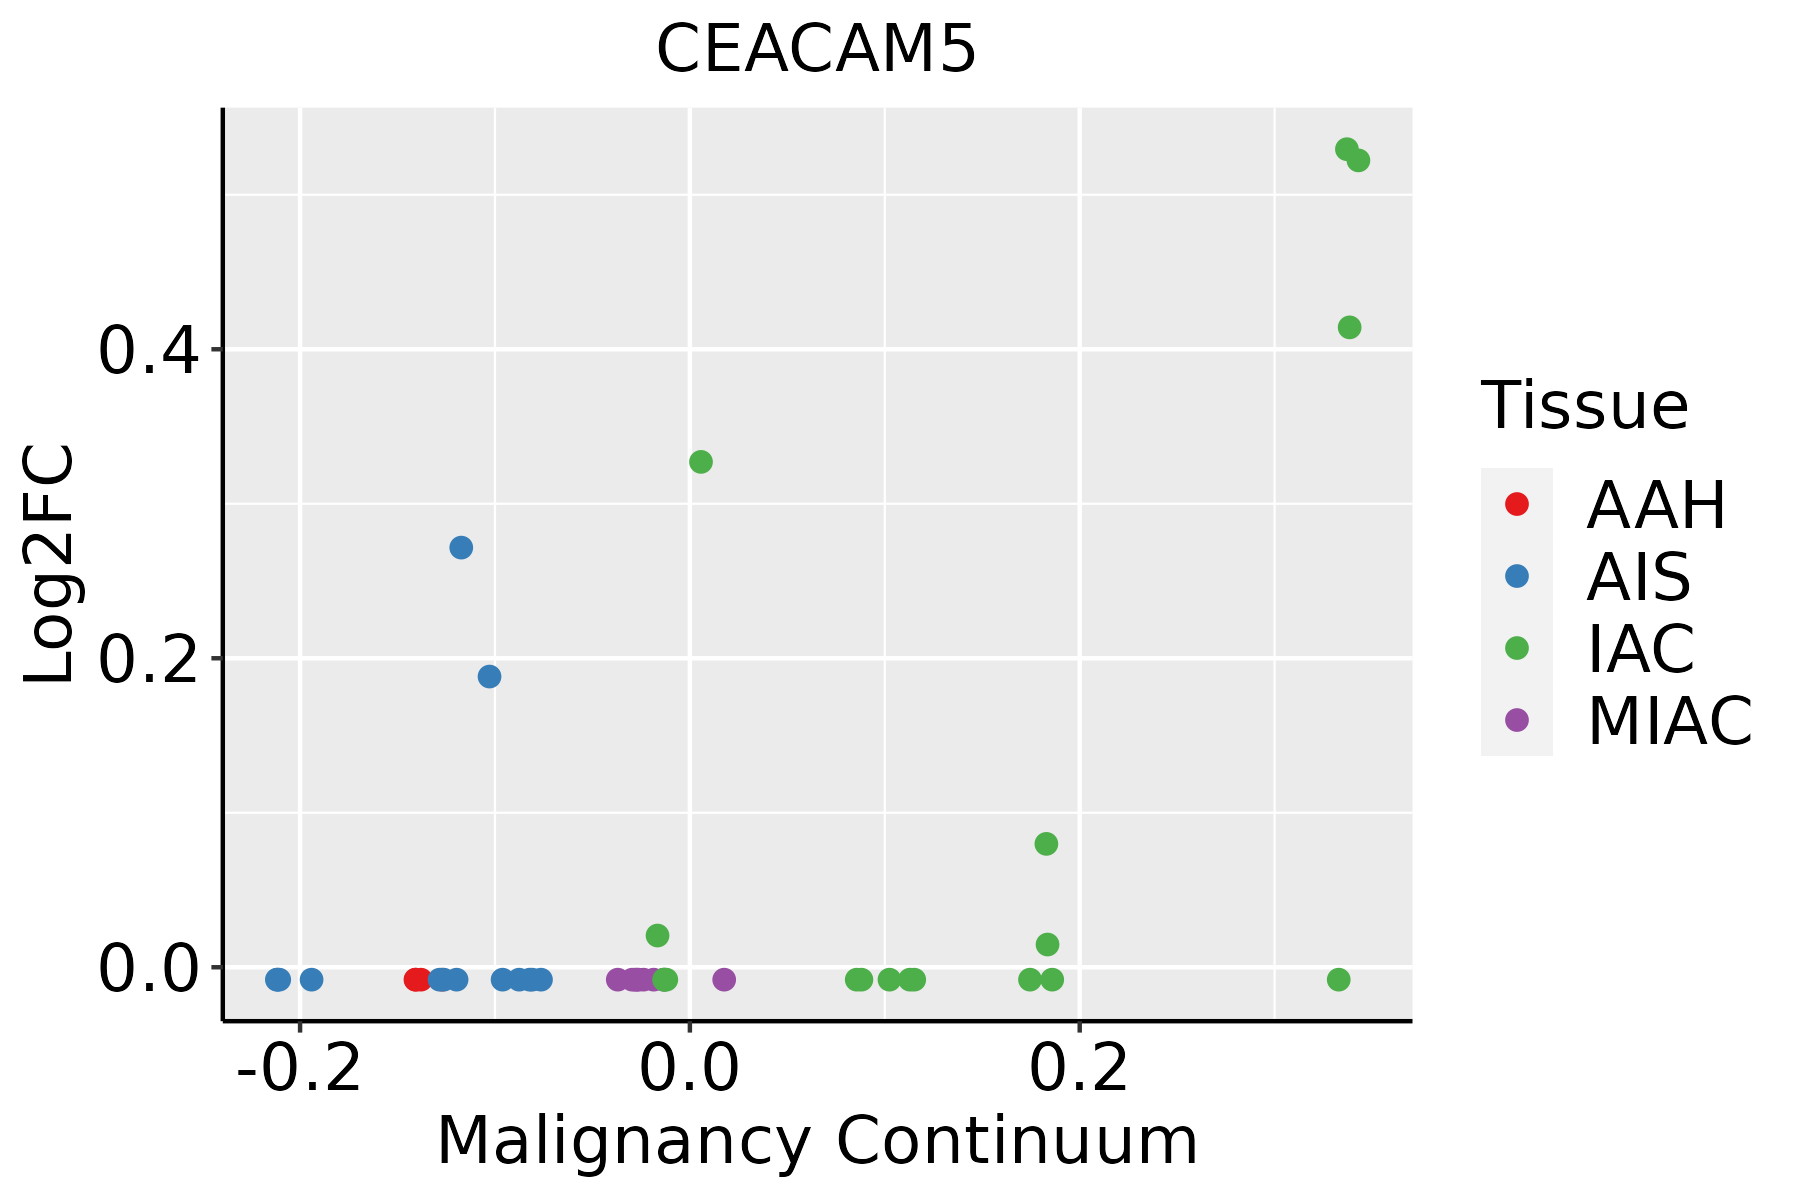 | AAH: Atypical adenomatous hyperplasia |
| AIS: Adenocarcinoma in situ | ||
| IAC: Invasive lung adenocarcinoma | ||
| MIA: Minimally invasive adenocarcinoma | ||
| Oral Cavity |  | EOLP: Erosive Oral lichen planus |
| LP: leukoplakia | ||
| NEOLP: Non-erosive oral lichen planus | ||
| OSCC: Oral squamous cell carcinoma |
| ∗log2FC in expression of this searched gene in stem-like cells from each diseased tissue sample relative to stem-like cells in normal samples in each tissue plotted against the malignancy continuum. Samples are colored based on if they are from different disease stage. |
Top |
Malignant transformation related pathway analysis |
| Find out the enriched GO biological processes and KEGG pathways involved in transition from healthy to precancer to cancer |
| Tissue | Disease Stage | Enriched GO biological Processes |
| Colorectum | AD |  |
| Colorectum | SER |  |
| Colorectum | MSS |  |
| Colorectum | MSI-H |  |
| Colorectum | FAP |  |
| ∗Top 15 enriched GO BP terms are showed in the bar plot of each disease state in each tissue. Each row represents a significant GO biological process which is colored according to the -log10(p.adjust). |
| Page: 1 2 3 4 5 6 7 8 9 |
| GO ID | Tissue | Disease Stage | Description | Gene Ratio | Bg Ratio | pvalue | p.adjust | Count |
| GO:003410910 | Cervix | CC | homotypic cell-cell adhesion | 26/2311 | 90/18723 | 2.12e-05 | 3.82e-04 | 26 |
| GO:00426924 | Cervix | CC | muscle cell differentiation | 69/2311 | 384/18723 | 8.12e-04 | 7.09e-03 | 69 |
| GO:00511464 | Cervix | CC | striated muscle cell differentiation | 50/2311 | 283/18723 | 5.53e-03 | 3.19e-02 | 50 |
| GO:003410914 | Cervix | HSIL_HPV | homotypic cell-cell adhesion | 13/737 | 90/18723 | 4.92e-05 | 1.23e-03 | 13 |
| GO:005114612 | Cervix | HSIL_HPV | striated muscle cell differentiation | 22/737 | 283/18723 | 1.94e-03 | 2.04e-02 | 22 |
| GO:0034109 | Colorectum | AD | homotypic cell-cell adhesion | 40/3918 | 90/18723 | 4.37e-07 | 1.67e-05 | 40 |
| GO:00341091 | Colorectum | SER | homotypic cell-cell adhesion | 32/2897 | 90/18723 | 2.23e-06 | 9.31e-05 | 32 |
| GO:00341092 | Colorectum | MSS | homotypic cell-cell adhesion | 36/3467 | 90/18723 | 1.62e-06 | 5.32e-05 | 36 |
| GO:00341093 | Colorectum | MSI-H | homotypic cell-cell adhesion | 20/1319 | 90/18723 | 3.43e-06 | 1.89e-04 | 20 |
| GO:20002093 | Esophagus | ESCC | regulation of anoikis | 20/8552 | 24/18723 | 1.69e-04 | 1.11e-03 | 20 |
| GO:00432761 | Esophagus | ESCC | anoikis | 26/8552 | 34/18723 | 2.53e-04 | 1.55e-03 | 26 |
| GO:20008113 | Esophagus | ESCC | negative regulation of anoikis | 14/8552 | 17/18723 | 2.22e-03 | 9.78e-03 | 14 |
| GO:003410920 | Esophagus | ESCC | homotypic cell-cell adhesion | 54/8552 | 90/18723 | 4.33e-03 | 1.72e-02 | 54 |
| GO:003410912 | Liver | HCC | homotypic cell-cell adhesion | 55/7958 | 90/18723 | 2.81e-04 | 2.02e-03 | 55 |
| GO:0042692 | Lung | IAC | muscle cell differentiation | 65/2061 | 384/18723 | 2.75e-04 | 4.54e-03 | 65 |
| GO:00511462 | Lung | IAC | striated muscle cell differentiation | 47/2061 | 283/18723 | 2.66e-03 | 2.45e-02 | 47 |
| GO:00341098 | Lung | IAC | homotypic cell-cell adhesion | 19/2061 | 90/18723 | 3.82e-03 | 3.18e-02 | 19 |
| GO:003410919 | Oral cavity | OSCC | homotypic cell-cell adhesion | 55/7305 | 90/18723 | 1.78e-05 | 1.73e-04 | 55 |
| GO:20008112 | Oral cavity | OSCC | negative regulation of anoikis | 15/7305 | 17/18723 | 4.02e-05 | 3.49e-04 | 15 |
| GO:0043276 | Oral cavity | OSCC | anoikis | 25/7305 | 34/18723 | 4.63e-05 | 3.90e-04 | 25 |
| Page: 1 2 |
| Pathway ID | Tissue | Disease Stage | Description | Gene Ratio | Bg Ratio | pvalue | p.adjust | qvalue | Count |
| Page: 1 |
Top |
Cell-cell communication analysis |
| Identification of potential cell-cell interactions between two cell types and their ligand-receptor pairs for different disease states |
| Ligand | Receptor | LRpair | Pathway | Tissue | Disease Stage |
| CD8A | CEACAM5 | CD8A_CEACAM5 | CEACAM | Cervix | CC |
| CEACAM1 | CEACAM5 | CEACAM1_CEACAM5 | CEACAM | Cervix | CC |
| CD8A | CEACAM5 | CD8A_CEACAM5 | CEACAM | CRC | AD |
| CD8A | CEACAM5 | CD8A_CEACAM5 | CEACAM | CRC | ADJ |
| CEACAM1 | CEACAM5 | CEACAM1_CEACAM5 | CEACAM | CRC | ADJ |
| CD8A | CEACAM5 | CD8A_CEACAM5 | CEACAM | CRC | MSI-H |
| CEACAM1 | CEACAM5 | CEACAM1_CEACAM5 | CEACAM | CRC | MSI-H |
| CD8A | CEACAM5 | CD8A_CEACAM5 | CEACAM | CRC | MSS |
| CEACAM1 | CEACAM5 | CEACAM1_CEACAM5 | CEACAM | CRC | MSS |
| CD8A | CEACAM5 | CD8A_CEACAM5 | CEACAM | CRC | SER |
| CEACAM1 | CEACAM5 | CEACAM1_CEACAM5 | CEACAM | CRC | SER |
| CEACAM1 | CEACAM5 | CEACAM1_CEACAM5 | CEACAM | Esophagus | ADJ |
| CD8A | CEACAM5 | CD8A_CEACAM5 | CEACAM | GC | ADJ |
| CD8A | CEACAM5 | CD8A_CEACAM5 | CEACAM | GC | GC |
| CD8A | CEACAM5 | CD8A_CEACAM5 | CEACAM | HNSCC | ADJ |
| CEACAM1 | CEACAM5 | CEACAM1_CEACAM5 | CEACAM | HNSCC | ADJ |
| CD8A | CEACAM5 | CD8A_CEACAM5 | CEACAM | HNSCC | OSCC |
| CEACAM1 | CEACAM5 | CEACAM1_CEACAM5 | CEACAM | HNSCC | OSCC |
| CD8A | CEACAM5 | CD8A_CEACAM5 | CEACAM | Lung | MIAC |
| CEACAM1 | CEACAM5 | CEACAM1_CEACAM5 | CEACAM | Lung | MIAC |
| Page: 1 |
Top |
Single-cell gene regulatory network inference analysis |
| Find out the significant the regulons (TFs) and the target genes of each regulon across cell types for different disease states |
| TF | Cell Type | Tissue | Disease Stage | Target Gene | RSS | Regulon Activity |
| ∗The dot plots of a searched regulon are shown for all cell subpopulations in each disease state of each tissue based on the regulon specific score inferred using pySCENIC and by calculating the average expression. |
| Page: 1 |
Top |
Somatic mutation of malignant transformation related genes |
| Annotation of somatic variants for genes involved in malignant transformation |
| Hugo Symbol | Variant Class | Variant Classification | dbSNP RS | HGVSc | HGVSp | HGVSp Short | SWISSPROT | BIOTYPE | SIFT | PolyPhen | Tumor Sample Barcode | Tissue | Histology | Sex | Age | Stage | Therapy Types | Drugs | Outcome |
| CEACAM5 | SNV | Missense_Mutation | c.122N>G | p.Thr41Arg | p.T41R | P06731 | protein_coding | tolerated(0.07) | benign(0.007) | TCGA-A7-A0CE-01 | Breast | breast invasive carcinoma | Female | <65 | I/II | Chemotherapy | adriamycin | SD | |
| CEACAM5 | SNV | Missense_Mutation | rs782202653 | c.89C>T | p.Pro30Leu | p.P30L | P06731 | protein_coding | tolerated(1) | benign(0.117) | TCGA-A8-A09D-01 | Breast | breast invasive carcinoma | Female | <65 | I/II | Chemotherapy | doxorubicin | CR |
| CEACAM5 | SNV | Missense_Mutation | c.1009N>A | p.Asp337Asn | p.D337N | P06731 | protein_coding | tolerated(0.74) | benign(0.003) | TCGA-AR-A256-01 | Breast | breast invasive carcinoma | Female | <65 | I/II | Chemotherapy | doxorubicin | PD | |
| CEACAM5 | SNV | Missense_Mutation | c.2010G>C | p.Lys670Asn | p.K670N | P06731 | protein_coding | deleterious(0.02) | benign(0.405) | TCGA-C5-A3HE-01 | Cervix | cervical & endocervical cancer | Female | <65 | I/II | Unknown | Unknown | PD | |
| CEACAM5 | SNV | Missense_Mutation | c.1318N>A | p.Ala440Thr | p.A440T | P06731 | protein_coding | tolerated(0.38) | probably_damaging(0.987) | TCGA-VS-A8EC-01 | Cervix | cervical & endocervical cancer | Female | <65 | III/IV | Chemotherapy | carboplatin | CR | |
| CEACAM5 | insertion | Frame_Shift_Ins | novel | c.2093_2094insT | p.Val699GlyfsTer10 | p.V699Gfs*10 | P06731 | protein_coding | TCGA-DS-A1OC-01 | Cervix | cervical & endocervical cancer | Female | <65 | I/II | Chemotherapy | gemcitabine | SD | ||
| CEACAM5 | SNV | Missense_Mutation | rs781903049 | c.1808N>T | p.Ser603Leu | p.S603L | P06731 | protein_coding | tolerated(0.21) | benign(0.031) | TCGA-A6-3809-01 | Colorectum | colon adenocarcinoma | Female | >=65 | I/II | Unknown | Unknown | SD |
| CEACAM5 | SNV | Missense_Mutation | c.1918C>A | p.Leu640Ile | p.L640I | P06731 | protein_coding | tolerated(0.05) | probably_damaging(0.989) | TCGA-AA-A010-01 | Colorectum | colon adenocarcinoma | Female | <65 | I/II | Chemotherapy | folinic | CR | |
| CEACAM5 | SNV | Missense_Mutation | c.328N>A | p.Gln110Lys | p.Q110K | P06731 | protein_coding | tolerated(0.06) | possibly_damaging(0.51) | TCGA-AA-A02H-01 | Colorectum | colon adenocarcinoma | Female | >=65 | III/IV | Unknown | Unknown | PD | |
| CEACAM5 | SNV | Missense_Mutation | rs782511943 | c.658N>T | p.Pro220Ser | p.P220S | P06731 | protein_coding | deleterious(0.03) | benign(0.039) | TCGA-AA-A02J-01 | Colorectum | colon adenocarcinoma | Female | >=65 | III/IV | Unknown | Unknown | PD |
| Page: 1 2 3 4 5 6 7 8 |
Top |
Related drugs of malignant transformation related genes |
| Identification of chemicals and drugs interact with genes involved in malignant transfromation |
| (DGIdb 4.0) |
| Entrez ID | Symbol | Category | Interaction Types | Drug Claim Name | Drug Name | PMIDs |
| 1048 | CEACAM5 | CELL SURFACE, DRUGGABLE GENOME | GENISTEIN | GENISTEIN | 9331108 | |
| 1048 | CEACAM5 | CELL SURFACE, DRUGGABLE GENOME | GEFITINIB | GEFITINIB | 15738541 | |
| 1048 | CEACAM5 | CELL SURFACE, DRUGGABLE GENOME | CIGB-M3 | |||
| 1048 | CEACAM5 | CELL SURFACE, DRUGGABLE GENOME | Anti-CEA CAR-T cells | |||
| 1048 | CEACAM5 | CELL SURFACE, DRUGGABLE GENOME | IDM-2101 | |||
| 1048 | CEACAM5 | CELL SURFACE, DRUGGABLE GENOME | CT84.66 | |||
| 1048 | CEACAM5 | CELL SURFACE, DRUGGABLE GENOME | Anti-CEA-CAR T | |||
| 1048 | CEACAM5 | CELL SURFACE, DRUGGABLE GENOME | Labetuzumab I-131 | |||
| 1048 | CEACAM5 | CELL SURFACE, DRUGGABLE GENOME | CAP1-6D | |||
| 1048 | CEACAM5 | CELL SURFACE, DRUGGABLE GENOME | CAR-T Cells targeting CEA |
| Page: 1 2 3 |

Copyright 2023-Present -The University of Texas Health Science Center at Houston |