
|
|||||
|
 | |
| |
| |
| |
| |
| |
|
Gene: CEACAM19 |
Gene summary for CEACAM19 |
| Gene information | Species | Human | Gene symbol | CEACAM19 | Gene ID | 56971 |
| Gene name | CEA cell adhesion molecule 19 | |
| Gene Alias | CEACM19 | |
| Cytomap | 19q13.31 | |
| Gene Type | protein-coding | GO ID | GO:0005575 | UniProtAcc | Q7Z692 |
Top |
Malignant transformation analysis |
| Identification of the aberrant gene expression in precancerous and cancerous lesions by comparing the gene expression of stem-like cells in diseased tissues with normal stem cells |
| Entrez ID | Symbol | Replicates | Species | Organ | Tissue | Adj P-value | Log2FC | Malignancy |
| 56971 | CEACAM19 | LZE4T | Human | Esophagus | ESCC | 3.18e-05 | 2.00e-01 | 0.0811 |
| 56971 | CEACAM19 | P1T-E | Human | Esophagus | ESCC | 2.97e-02 | 3.45e-01 | 0.0875 |
| 56971 | CEACAM19 | P4T-E | Human | Esophagus | ESCC | 3.78e-04 | 1.40e-01 | 0.1323 |
| 56971 | CEACAM19 | P5T-E | Human | Esophagus | ESCC | 4.41e-07 | 1.31e-01 | 0.1327 |
| 56971 | CEACAM19 | P8T-E | Human | Esophagus | ESCC | 1.66e-02 | 8.99e-02 | 0.0889 |
| 56971 | CEACAM19 | P10T-E | Human | Esophagus | ESCC | 2.03e-09 | 2.17e-01 | 0.116 |
| 56971 | CEACAM19 | P22T-E | Human | Esophagus | ESCC | 4.31e-06 | 1.30e-01 | 0.1236 |
| 56971 | CEACAM19 | P28T-E | Human | Esophagus | ESCC | 7.90e-03 | 1.26e-01 | 0.1149 |
| 56971 | CEACAM19 | P36T-E | Human | Esophagus | ESCC | 2.98e-06 | 1.76e-01 | 0.1187 |
| 56971 | CEACAM19 | P49T-E | Human | Esophagus | ESCC | 5.23e-14 | 7.65e-01 | 0.1768 |
| 56971 | CEACAM19 | P89T-E | Human | Esophagus | ESCC | 5.43e-13 | 8.22e-01 | 0.1752 |
| 56971 | CEACAM19 | P107T-E | Human | Esophagus | ESCC | 2.64e-07 | 1.79e-01 | 0.171 |
| 56971 | CEACAM19 | P130T-E | Human | Esophagus | ESCC | 9.20e-06 | 1.57e-01 | 0.1676 |
| Page: 1 |
| Tissue | Expression Dynamics | Abbreviation |
| Esophagus | 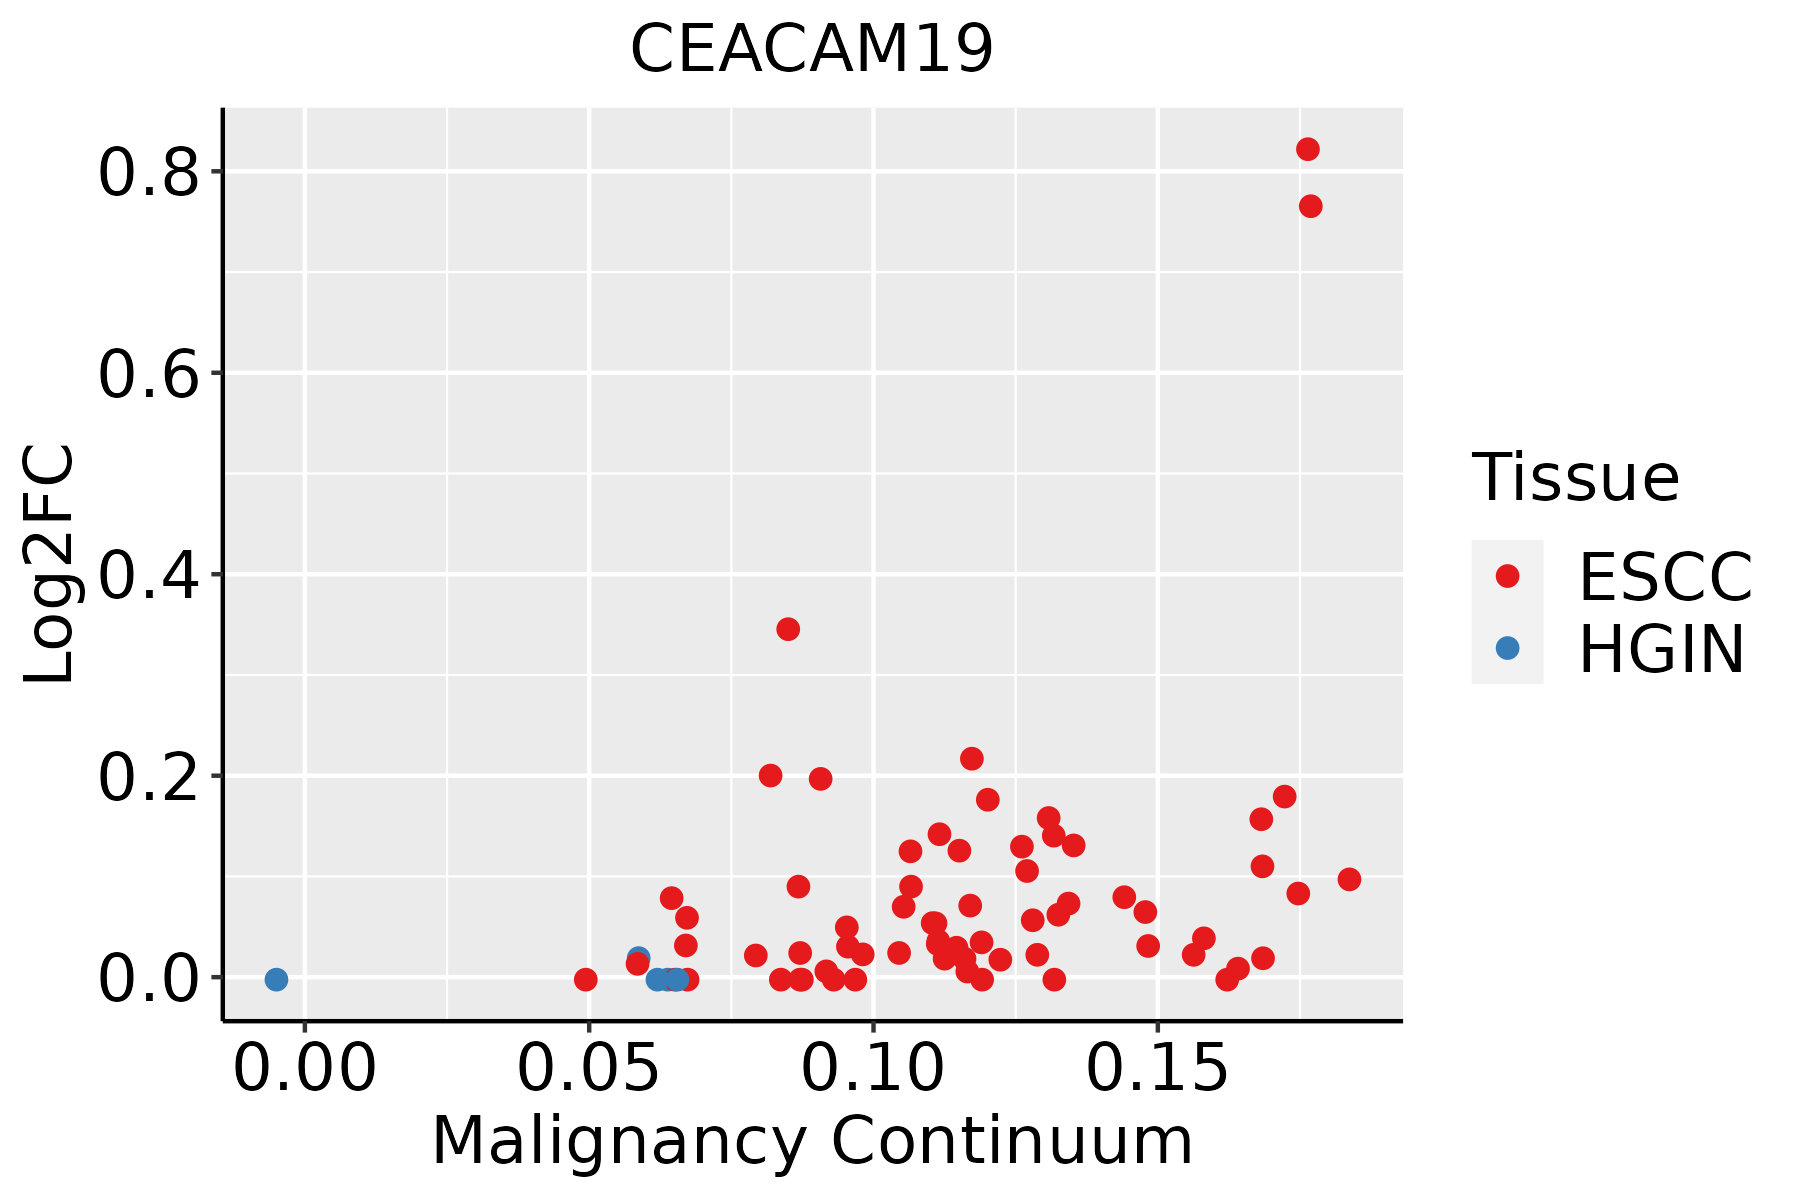 | ESCC: Esophageal squamous cell carcinoma |
| HGIN: High-grade intraepithelial neoplasias | ||
| LGIN: Low-grade intraepithelial neoplasias |
| ∗log2FC in expression of this searched gene in stem-like cells from each diseased tissue sample relative to stem-like cells in normal samples in each tissue plotted against the malignancy continuum. Samples are colored based on if they are from different disease stage. |
Top |
Malignant transformation related pathway analysis |
| Find out the enriched GO biological processes and KEGG pathways involved in transition from healthy to precancer to cancer |
| Tissue | Disease Stage | Enriched GO biological Processes |
| Colorectum | AD |  |
| Colorectum | SER |  |
| Colorectum | MSS |  |
| Colorectum | MSI-H |  |
| Colorectum | FAP |  |
| ∗Top 15 enriched GO BP terms are showed in the bar plot of each disease state in each tissue. Each row represents a significant GO biological process which is colored according to the -log10(p.adjust). |
| Page: 1 2 3 4 5 6 7 8 9 |
| GO ID | Tissue | Disease Stage | Description | Gene Ratio | Bg Ratio | pvalue | p.adjust | Count |
| Page: 1 |
| Pathway ID | Tissue | Disease Stage | Description | Gene Ratio | Bg Ratio | pvalue | p.adjust | qvalue | Count |
| Page: 1 |
Top |
Cell-cell communication analysis |
| Identification of potential cell-cell interactions between two cell types and their ligand-receptor pairs for different disease states |
| Ligand | Receptor | LRpair | Pathway | Tissue | Disease Stage |
| Page: 1 |
Top |
Single-cell gene regulatory network inference analysis |
| Find out the significant the regulons (TFs) and the target genes of each regulon across cell types for different disease states |
| TF | Cell Type | Tissue | Disease Stage | Target Gene | RSS | Regulon Activity |
| ∗The dot plots of a searched regulon are shown for all cell subpopulations in each disease state of each tissue based on the regulon specific score inferred using pySCENIC and by calculating the average expression. |
| Page: 1 |
Top |
Somatic mutation of malignant transformation related genes |
| Annotation of somatic variants for genes involved in malignant transformation |
| Hugo Symbol | Variant Class | Variant Classification | dbSNP RS | HGVSc | HGVSp | HGVSp Short | SWISSPROT | BIOTYPE | SIFT | PolyPhen | Tumor Sample Barcode | Tissue | Histology | Sex | Age | Stage | Therapy Types | Drugs | Outcome |
| CEACAM19 | SNV | Missense_Mutation | c.118N>G | p.Pro40Ala | p.P40A | Q7Z692 | protein_coding | deleterious(0.03) | probably_damaging(0.999) | TCGA-D8-A27E-01 | Breast | breast invasive carcinoma | Female | >=65 | I/II | Hormone Therapy | tamoxiphen+anastrazolum | SD | |
| CEACAM19 | insertion | Nonsense_Mutation | novel | c.780_781insCCAGCACATGGTTGGTGCTTGTAAATACTTATTTAGTG | p.Asn261ProfsTer8 | p.N261Pfs*8 | Q7Z692 | protein_coding | TCGA-AN-A04A-01 | Breast | breast invasive carcinoma | Female | <65 | III/IV | Unknown | Unknown | SD | ||
| CEACAM19 | SNV | Missense_Mutation | c.410A>G | p.Glu137Gly | p.E137G | Q7Z692 | protein_coding | deleterious(0.01) | possibly_damaging(0.703) | TCGA-AA-3811-01 | Colorectum | colon adenocarcinoma | Female | >=65 | III/IV | Unknown | Unknown | PD | |
| CEACAM19 | SNV | Missense_Mutation | c.410N>G | p.Glu137Gly | p.E137G | Q7Z692 | protein_coding | deleterious(0.01) | possibly_damaging(0.703) | TCGA-AA-3966-01 | Colorectum | colon adenocarcinoma | Female | >=65 | I/II | Unknown | Unknown | SD | |
| CEACAM19 | SNV | Missense_Mutation | rs188022827 | c.257N>A | p.Arg86Gln | p.R86Q | Q7Z692 | protein_coding | tolerated(0.09) | probably_damaging(0.958) | TCGA-AP-A059-01 | Endometrium | uterine corpus endometrioid carcinoma | Female | >=65 | I/II | Unknown | Unknown | SD |
| CEACAM19 | SNV | Missense_Mutation | rs758680868 | c.479C>T | p.Ala160Val | p.A160V | Q7Z692 | protein_coding | tolerated(0.39) | benign(0.015) | TCGA-AP-A0LM-01 | Endometrium | uterine corpus endometrioid carcinoma | Female | <65 | III/IV | Chemotherapy | cisplatin | SD |
| CEACAM19 | SNV | Missense_Mutation | novel | c.704N>A | p.Ala235Asp | p.A235D | Q7Z692 | protein_coding | deleterious(0.01) | benign(0.086) | TCGA-AP-A1DV-01 | Endometrium | uterine corpus endometrioid carcinoma | Female | <65 | I/II | Unknown | Unknown | SD |
| CEACAM19 | SNV | Missense_Mutation | c.212N>G | p.Thr71Arg | p.T71R | Q7Z692 | protein_coding | deleterious(0.01) | possibly_damaging(0.56) | TCGA-B5-A11H-01 | Endometrium | uterine corpus endometrioid carcinoma | Female | >=65 | III/IV | Hormone Therapy | megace | SD | |
| CEACAM19 | SNV | Missense_Mutation | novel | c.580N>T | p.Pro194Ser | p.P194S | Q7Z692 | protein_coding | tolerated(0.7) | benign(0) | TCGA-BG-A222-01 | Endometrium | uterine corpus endometrioid carcinoma | Female | <65 | I/II | Unknown | Unknown | SD |
| CEACAM19 | SNV | Missense_Mutation | c.575G>T | p.Arg192Ile | p.R192I | Q7Z692 | protein_coding | deleterious(0) | possibly_damaging(0.725) | TCGA-BK-A0C9-01 | Endometrium | uterine corpus endometrioid carcinoma | Female | <65 | I/II | Unknown | Unknown | SD |
| Page: 1 2 |
Top |
Related drugs of malignant transformation related genes |
| Identification of chemicals and drugs interact with genes involved in malignant transfromation |
| (DGIdb 4.0) |
| Entrez ID | Symbol | Category | Interaction Types | Drug Claim Name | Drug Name | PMIDs |
| Page: 1 |

Copyright 2023-Present -The University of Texas Health Science Center at Houston |