
|
|||||
|
 | |
| |
| |
| |
| |
| |
|
Gene: CDS2 |
Gene summary for CDS2 |
| Gene information | Species | Human | Gene symbol | CDS2 | Gene ID | 8760 |
| Gene name | CDP-diacylglycerol synthase 2 | |
| Gene Alias | CDS2 | |
| Cytomap | 20p12.3 | |
| Gene Type | protein-coding | GO ID | GO:0006629 | UniProtAcc | O95674 |
Top |
Malignant transformation analysis |
| Identification of the aberrant gene expression in precancerous and cancerous lesions by comparing the gene expression of stem-like cells in diseased tissues with normal stem cells |
| Entrez ID | Symbol | Replicates | Species | Organ | Tissue | Adj P-value | Log2FC | Malignancy |
| 8760 | CDS2 | LZE4T | Human | Esophagus | ESCC | 6.75e-16 | 4.43e-01 | 0.0811 |
| 8760 | CDS2 | LZE7T | Human | Esophagus | ESCC | 1.43e-03 | 2.56e-01 | 0.0667 |
| 8760 | CDS2 | LZE24T | Human | Esophagus | ESCC | 5.68e-24 | 5.89e-01 | 0.0596 |
| 8760 | CDS2 | P1T-E | Human | Esophagus | ESCC | 4.49e-07 | 4.90e-01 | 0.0875 |
| 8760 | CDS2 | P2T-E | Human | Esophagus | ESCC | 3.04e-18 | 3.08e-01 | 0.1177 |
| 8760 | CDS2 | P4T-E | Human | Esophagus | ESCC | 3.31e-33 | 7.04e-01 | 0.1323 |
| 8760 | CDS2 | P5T-E | Human | Esophagus | ESCC | 3.26e-25 | 3.38e-01 | 0.1327 |
| 8760 | CDS2 | P8T-E | Human | Esophagus | ESCC | 1.79e-29 | 3.15e-01 | 0.0889 |
| 8760 | CDS2 | P9T-E | Human | Esophagus | ESCC | 1.25e-12 | 2.78e-01 | 0.1131 |
| 8760 | CDS2 | P10T-E | Human | Esophagus | ESCC | 6.85e-26 | 3.93e-01 | 0.116 |
| 8760 | CDS2 | P11T-E | Human | Esophagus | ESCC | 2.25e-10 | 4.67e-01 | 0.1426 |
| 8760 | CDS2 | P12T-E | Human | Esophagus | ESCC | 2.11e-33 | 5.10e-01 | 0.1122 |
| 8760 | CDS2 | P15T-E | Human | Esophagus | ESCC | 6.99e-40 | 8.59e-01 | 0.1149 |
| 8760 | CDS2 | P16T-E | Human | Esophagus | ESCC | 1.35e-25 | 3.74e-01 | 0.1153 |
| 8760 | CDS2 | P17T-E | Human | Esophagus | ESCC | 7.19e-11 | 4.01e-01 | 0.1278 |
| 8760 | CDS2 | P19T-E | Human | Esophagus | ESCC | 4.49e-03 | 3.68e-01 | 0.1662 |
| 8760 | CDS2 | P20T-E | Human | Esophagus | ESCC | 5.36e-17 | 4.66e-01 | 0.1124 |
| 8760 | CDS2 | P21T-E | Human | Esophagus | ESCC | 1.42e-46 | 8.14e-01 | 0.1617 |
| 8760 | CDS2 | P22T-E | Human | Esophagus | ESCC | 2.82e-21 | 2.80e-01 | 0.1236 |
| 8760 | CDS2 | P23T-E | Human | Esophagus | ESCC | 2.93e-26 | 6.19e-01 | 0.108 |
| Page: 1 2 3 4 5 6 |
| Tissue | Expression Dynamics | Abbreviation |
| Esophagus | 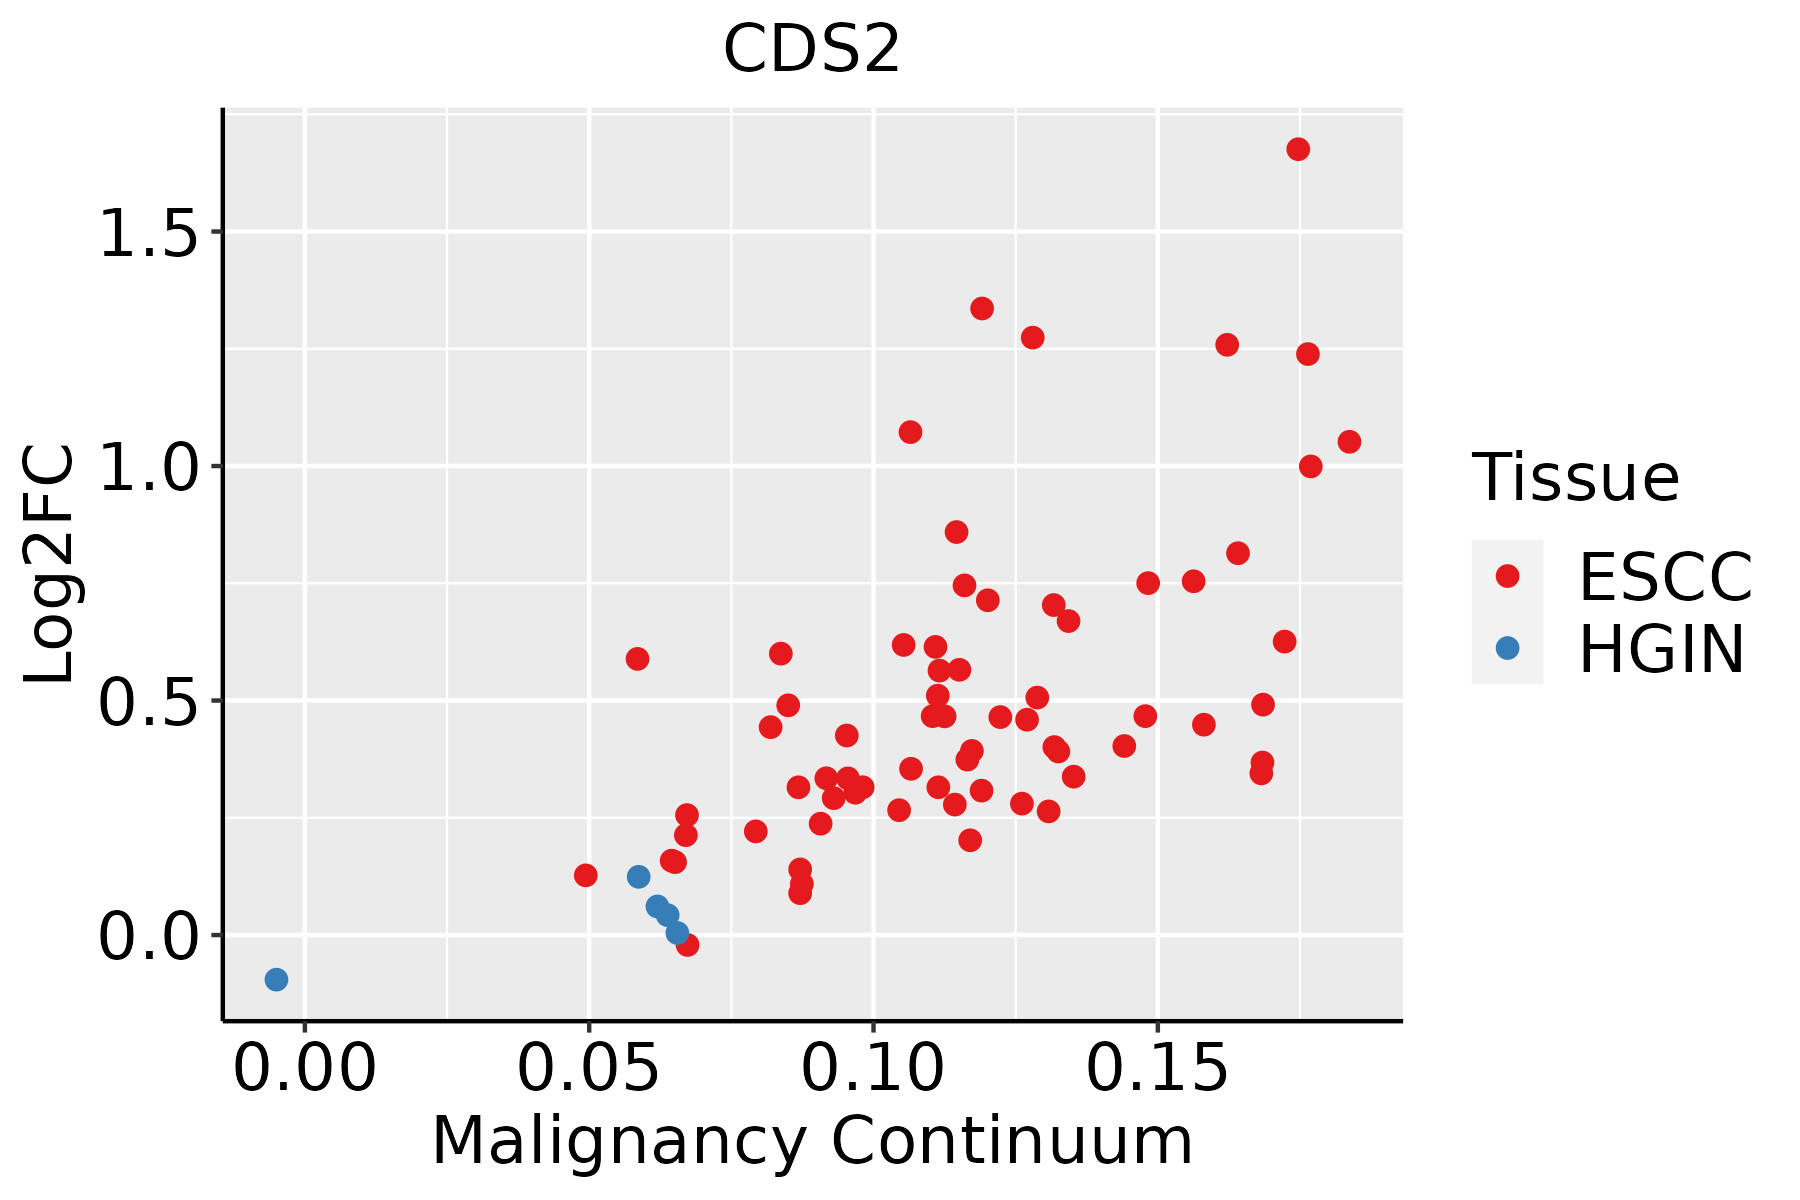 | ESCC: Esophageal squamous cell carcinoma |
| HGIN: High-grade intraepithelial neoplasias | ||
| LGIN: Low-grade intraepithelial neoplasias | ||
| Liver | 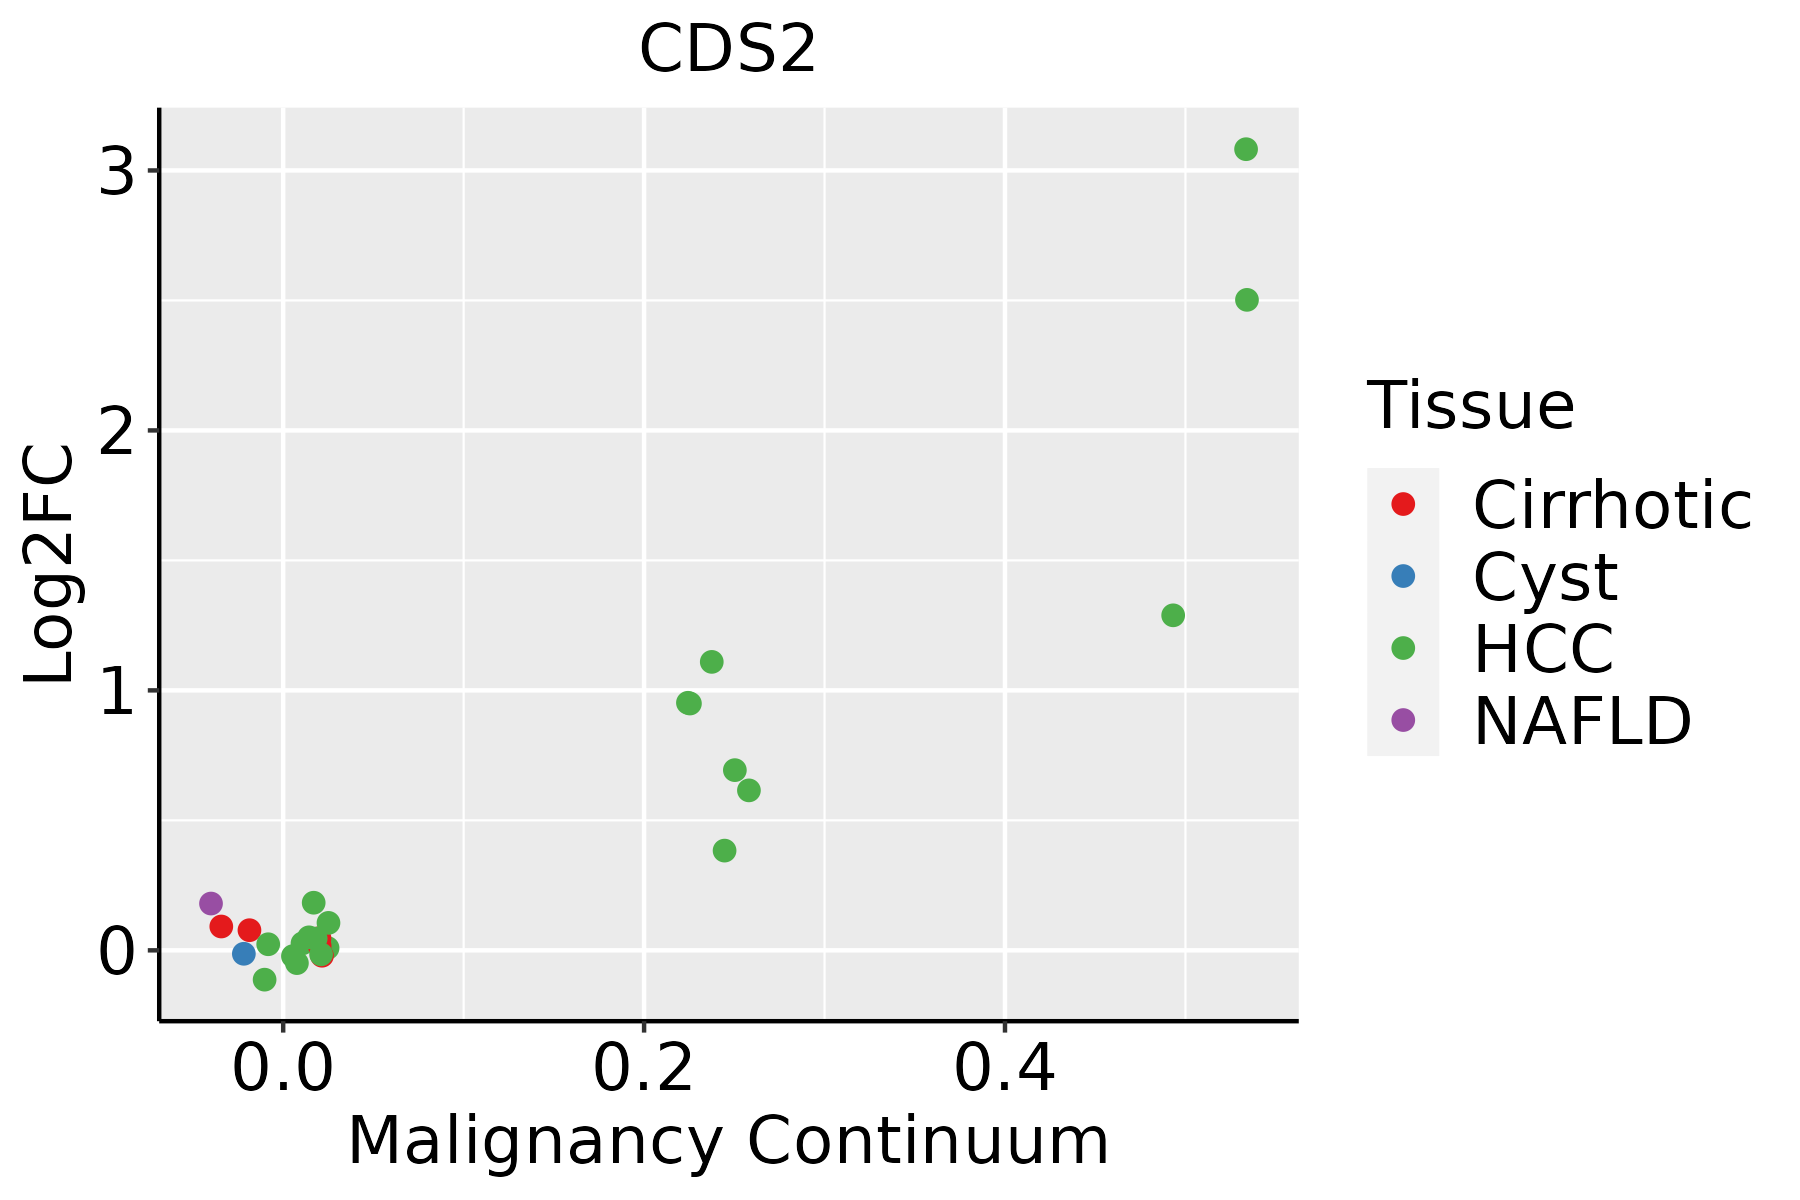 | HCC: Hepatocellular carcinoma |
| NAFLD: Non-alcoholic fatty liver disease | ||
| Oral Cavity | 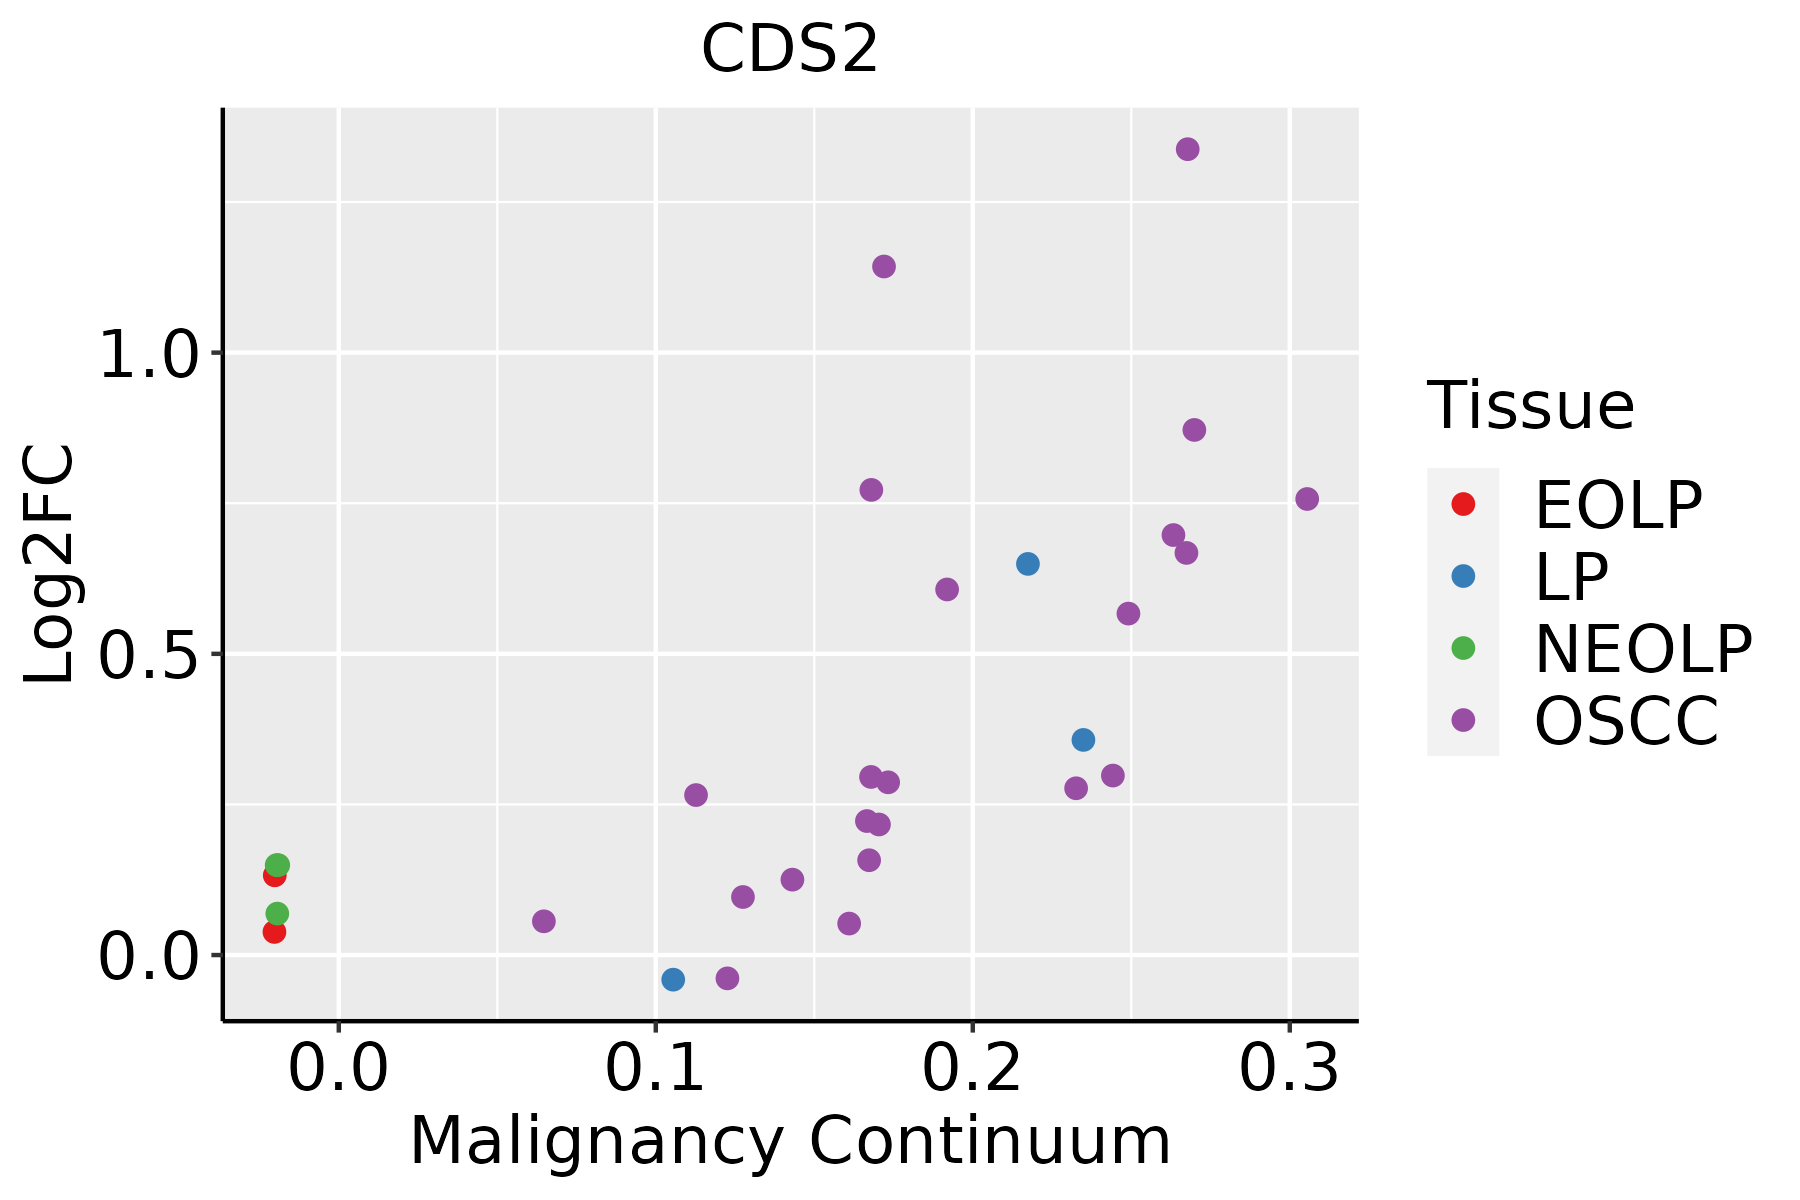 | EOLP: Erosive Oral lichen planus |
| LP: leukoplakia | ||
| NEOLP: Non-erosive oral lichen planus | ||
| OSCC: Oral squamous cell carcinoma | ||
| Skin | 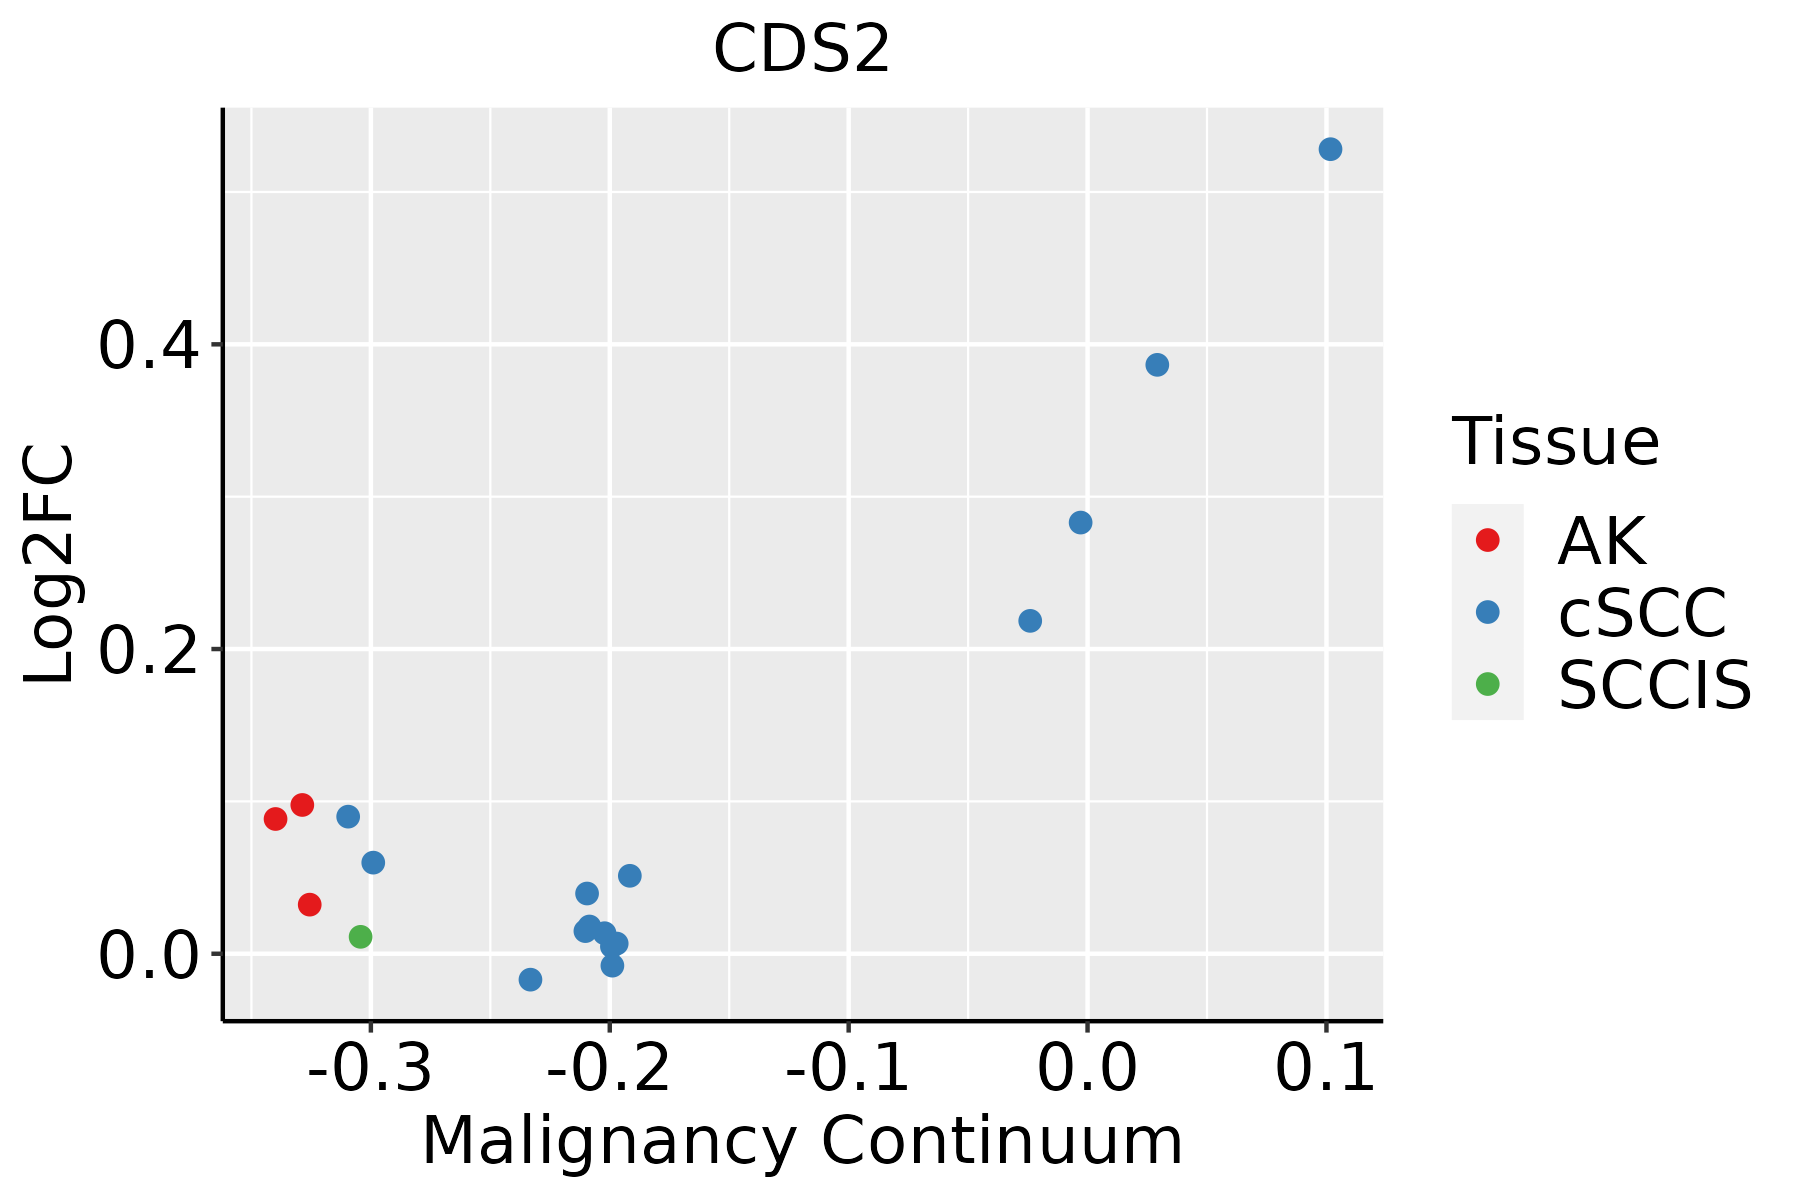 | AK: Actinic keratosis |
| cSCC: Cutaneous squamous cell carcinoma | ||
| SCCIS:squamous cell carcinoma in situ | ||
| Thyroid |  | ATC: Anaplastic thyroid cancer |
| HT: Hashimoto's thyroiditis | ||
| PTC: Papillary thyroid cancer |
| ∗log2FC in expression of this searched gene in stem-like cells from each diseased tissue sample relative to stem-like cells in normal samples in each tissue plotted against the malignancy continuum. Samples are colored based on if they are from different disease stage. |
Top |
Malignant transformation related pathway analysis |
| Find out the enriched GO biological processes and KEGG pathways involved in transition from healthy to precancer to cancer |
| Tissue | Disease Stage | Enriched GO biological Processes |
| Colorectum | AD |  |
| Colorectum | SER |  |
| Colorectum | MSS |  |
| Colorectum | MSI-H |  |
| Colorectum | FAP |  |
| ∗Top 15 enriched GO BP terms are showed in the bar plot of each disease state in each tissue. Each row represents a significant GO biological process which is colored according to the -log10(p.adjust). |
| Page: 1 2 3 4 5 6 7 8 9 |
| GO ID | Tissue | Disease Stage | Description | Gene Ratio | Bg Ratio | pvalue | p.adjust | Count |
| GO:00086544 | Esophagus | ESCC | phospholipid biosynthetic process | 162/8552 | 253/18723 | 2.59e-09 | 5.73e-08 | 162 |
| GO:0051235110 | Esophagus | ESCC | maintenance of location | 200/8552 | 327/18723 | 1.01e-08 | 2.02e-07 | 200 |
| GO:00464744 | Esophagus | ESCC | glycerophospholipid biosynthetic process | 135/8552 | 211/18723 | 5.75e-08 | 1.02e-06 | 135 |
| GO:00450175 | Esophagus | ESCC | glycerolipid biosynthetic process | 154/8552 | 252/18723 | 5.20e-07 | 6.96e-06 | 154 |
| GO:00066446 | Esophagus | ESCC | phospholipid metabolic process | 218/8552 | 383/18723 | 5.37e-06 | 5.59e-05 | 218 |
| GO:00066505 | Esophagus | ESCC | glycerophospholipid metabolic process | 174/8552 | 306/18723 | 4.92e-05 | 3.85e-04 | 174 |
| GO:00199155 | Esophagus | ESCC | lipid storage | 58/8552 | 87/18723 | 6.15e-05 | 4.72e-04 | 58 |
| GO:00464864 | Esophagus | ESCC | glycerolipid metabolic process | 211/8552 | 392/18723 | 6.51e-04 | 3.46e-03 | 211 |
| GO:00463411 | Esophagus | ESCC | CDP-diacylglycerol metabolic process | 11/8552 | 14/18723 | 1.30e-02 | 4.27e-02 | 11 |
| GO:00086542 | Liver | HCC | phospholipid biosynthetic process | 150/7958 | 253/18723 | 4.77e-08 | 1.03e-06 | 150 |
| GO:00066444 | Liver | HCC | phospholipid metabolic process | 214/7958 | 383/18723 | 7.25e-08 | 1.48e-06 | 214 |
| GO:005123521 | Liver | HCC | maintenance of location | 185/7958 | 327/18723 | 1.70e-07 | 3.12e-06 | 185 |
| GO:004648611 | Liver | HCC | glycerolipid metabolic process | 215/7958 | 392/18723 | 4.54e-07 | 7.49e-06 | 215 |
| GO:004501711 | Liver | HCC | glycerolipid biosynthetic process | 143/7958 | 252/18723 | 3.27e-06 | 4.31e-05 | 143 |
| GO:00066504 | Liver | HCC | glycerophospholipid metabolic process | 168/7958 | 306/18723 | 7.27e-06 | 8.62e-05 | 168 |
| GO:004647411 | Liver | HCC | glycerophospholipid biosynthetic process | 121/7958 | 211/18723 | 9.12e-06 | 1.06e-04 | 121 |
| GO:001087621 | Liver | HCC | lipid localization | 228/7958 | 448/18723 | 1.80e-04 | 1.41e-03 | 228 |
| GO:00199152 | Liver | HCC | lipid storage | 53/7958 | 87/18723 | 4.01e-04 | 2.71e-03 | 53 |
| GO:0046341 | Liver | HCC | CDP-diacylglycerol metabolic process | 11/7958 | 14/18723 | 6.81e-03 | 2.73e-02 | 11 |
| GO:0016024 | Liver | HCC | CDP-diacylglycerol biosynthetic process | 10/7958 | 13/18723 | 1.28e-02 | 4.61e-02 | 10 |
| Page: 1 2 |
| Pathway ID | Tissue | Disease Stage | Description | Gene Ratio | Bg Ratio | pvalue | p.adjust | qvalue | Count |
| Page: 1 |
Top |
Cell-cell communication analysis |
| Identification of potential cell-cell interactions between two cell types and their ligand-receptor pairs for different disease states |
| Ligand | Receptor | LRpair | Pathway | Tissue | Disease Stage |
| Page: 1 |
Top |
Single-cell gene regulatory network inference analysis |
| Find out the significant the regulons (TFs) and the target genes of each regulon across cell types for different disease states |
| TF | Cell Type | Tissue | Disease Stage | Target Gene | RSS | Regulon Activity |
| ∗The dot plots of a searched regulon are shown for all cell subpopulations in each disease state of each tissue based on the regulon specific score inferred using pySCENIC and by calculating the average expression. |
| Page: 1 |
Top |
Somatic mutation of malignant transformation related genes |
| Annotation of somatic variants for genes involved in malignant transformation |
| Hugo Symbol | Variant Class | Variant Classification | dbSNP RS | HGVSc | HGVSp | HGVSp Short | SWISSPROT | BIOTYPE | SIFT | PolyPhen | Tumor Sample Barcode | Tissue | Histology | Sex | Age | Stage | Therapy Types | Drugs | Outcome |
| CDS2 | SNV | Missense_Mutation | rs576280057 | c.346N>A | p.Val116Ile | p.V116I | O95674 | protein_coding | tolerated(0.05) | possibly_damaging(0.786) | TCGA-AQ-A04H-01 | Breast | breast invasive carcinoma | Female | <65 | III/IV | Chemotherapy | taxotere | SD |
| CDS2 | SNV | Missense_Mutation | c.582N>G | p.Phe194Leu | p.F194L | O95674 | protein_coding | deleterious(0.01) | probably_damaging(0.914) | TCGA-AR-A24Q-01 | Breast | breast invasive carcinoma | Female | <65 | I/II | Chemotherapy | doxorubicin | SD | |
| CDS2 | SNV | Missense_Mutation | c.472N>T | p.Pro158Ser | p.P158S | O95674 | protein_coding | tolerated(0.4) | benign(0.017) | TCGA-BH-A0HF-01 | Breast | breast invasive carcinoma | Female | >=65 | I/II | Hormone Therapy | arimidex | SD | |
| CDS2 | insertion | Nonsense_Mutation | novel | c.132_133insTCCCCTCTTCCTCTTTGAACTGCACTTCCTAGT | p.Leu44_Pro45insSerProLeuProLeuTerThrAlaLeuProSer | p.L44_P45insSPLPL*TALPS | O95674 | protein_coding | TCGA-AR-A0U2-01 | Breast | breast invasive carcinoma | Female | <65 | III/IV | Hormone Therapy | tamoxiphen | PD | ||
| CDS2 | SNV | Missense_Mutation | rs749586772 | c.112N>T | p.Arg38Trp | p.R38W | O95674 | protein_coding | deleterious(0) | possibly_damaging(0.654) | TCGA-2W-A8YY-01 | Cervix | cervical & endocervical cancer | Female | <65 | I/II | Chemotherapy | cisplatin | CR |
| CDS2 | SNV | Missense_Mutation | novel | c.427G>A | p.Glu143Lys | p.E143K | O95674 | protein_coding | deleterious(0) | probably_damaging(0.991) | TCGA-C5-A7UI-01 | Cervix | cervical & endocervical cancer | Female | <65 | I/II | Unknown | Unknown | SD |
| CDS2 | SNV | Missense_Mutation | c.724N>G | p.Phe242Val | p.F242V | O95674 | protein_coding | deleterious(0) | probably_damaging(0.997) | TCGA-AA-3492-01 | Colorectum | colon adenocarcinoma | Female | >=65 | I/II | Unknown | Unknown | SD | |
| CDS2 | SNV | Missense_Mutation | c.1192G>A | p.Ala398Thr | p.A398T | O95674 | protein_coding | tolerated(0.77) | benign(0.022) | TCGA-AA-3710-01 | Colorectum | colon adenocarcinoma | Female | >=65 | I/II | Unknown | Unknown | SD | |
| CDS2 | SNV | Missense_Mutation | c.784G>T | p.Gly262Cys | p.G262C | O95674 | protein_coding | deleterious(0) | probably_damaging(1) | TCGA-AA-A010-01 | Colorectum | colon adenocarcinoma | Female | <65 | I/II | Chemotherapy | folinic | CR | |
| CDS2 | SNV | Missense_Mutation | rs576280057 | c.346N>A | p.Val116Ile | p.V116I | O95674 | protein_coding | tolerated(0.05) | possibly_damaging(0.786) | TCGA-AD-A5EJ-01 | Colorectum | colon adenocarcinoma | Female | >=65 | I/II | Unknown | Unknown | SD |
| Page: 1 2 3 4 5 |
Top |
Related drugs of malignant transformation related genes |
| Identification of chemicals and drugs interact with genes involved in malignant transfromation |
| (DGIdb 4.0) |
| Entrez ID | Symbol | Category | Interaction Types | Drug Claim Name | Drug Name | PMIDs |
| Page: 1 |

Copyright 2023-Present -The University of Texas Health Science Center at Houston |