
|
|||||
|
 | |
| |
| |
| |
| |
| |
|
Gene: CDR2 |
Gene summary for CDR2 |
| Gene information | Species | Human | Gene symbol | CDR2 | Gene ID | 1039 |
| Gene name | cerebellar degeneration related protein 2 | |
| Gene Alias | CDR62 | |
| Cytomap | 16p12.2 | |
| Gene Type | protein-coding | GO ID | GO:0003674 | UniProtAcc | Q01850 |
Top |
Malignant transformation analysis |
| Identification of the aberrant gene expression in precancerous and cancerous lesions by comparing the gene expression of stem-like cells in diseased tissues with normal stem cells |
| Entrez ID | Symbol | Replicates | Species | Organ | Tissue | Adj P-value | Log2FC | Malignancy |
| 1039 | CDR2 | CCI_1 | Human | Cervix | CC | 3.43e-16 | 9.44e-01 | 0.528 |
| 1039 | CDR2 | CCI_2 | Human | Cervix | CC | 5.53e-12 | 9.11e-01 | 0.5249 |
| 1039 | CDR2 | CCI_3 | Human | Cervix | CC | 2.97e-12 | 9.10e-01 | 0.516 |
| 1039 | CDR2 | HTA11_1938_2000001011 | Human | Colorectum | AD | 2.82e-03 | 5.25e-01 | -0.0811 |
| 1039 | CDR2 | HTA11_347_2000001011 | Human | Colorectum | AD | 1.38e-25 | 1.04e+00 | -0.1954 |
| 1039 | CDR2 | HTA11_83_2000001011 | Human | Colorectum | SER | 9.93e-03 | 4.82e-01 | -0.1526 |
| 1039 | CDR2 | HTA11_696_2000001011 | Human | Colorectum | AD | 5.23e-08 | 5.77e-01 | -0.1464 |
| 1039 | CDR2 | HTA11_866_2000001011 | Human | Colorectum | AD | 5.54e-04 | 4.58e-01 | -0.1001 |
| 1039 | CDR2 | HTA11_1391_2000001011 | Human | Colorectum | AD | 1.09e-02 | 4.49e-01 | -0.059 |
| 1039 | CDR2 | HTA11_546_2000001011 | Human | Colorectum | AD | 1.88e-05 | 6.66e-01 | -0.0842 |
| 1039 | CDR2 | HTA11_99999970781_79442 | Human | Colorectum | MSS | 1.69e-02 | -3.09e-01 | 0.294 |
| 1039 | CDR2 | A001-C-207 | Human | Colorectum | FAP | 3.08e-05 | -3.75e-01 | 0.1278 |
| 1039 | CDR2 | A015-C-203 | Human | Colorectum | FAP | 6.53e-28 | -3.79e-01 | -0.1294 |
| 1039 | CDR2 | A015-C-204 | Human | Colorectum | FAP | 1.46e-05 | -3.43e-01 | -0.0228 |
| 1039 | CDR2 | A014-C-040 | Human | Colorectum | FAP | 2.09e-04 | -4.67e-01 | -0.1184 |
| 1039 | CDR2 | A002-C-201 | Human | Colorectum | FAP | 1.10e-14 | -3.46e-01 | 0.0324 |
| 1039 | CDR2 | A001-C-119 | Human | Colorectum | FAP | 1.67e-04 | -2.48e-01 | -0.1557 |
| 1039 | CDR2 | A001-C-108 | Human | Colorectum | FAP | 2.42e-12 | -2.21e-01 | -0.0272 |
| 1039 | CDR2 | A002-C-205 | Human | Colorectum | FAP | 4.34e-24 | -2.89e-01 | -0.1236 |
| 1039 | CDR2 | A015-C-006 | Human | Colorectum | FAP | 1.88e-15 | -4.45e-01 | -0.0994 |
| Page: 1 2 3 |
| Tissue | Expression Dynamics | Abbreviation |
| Cervix | 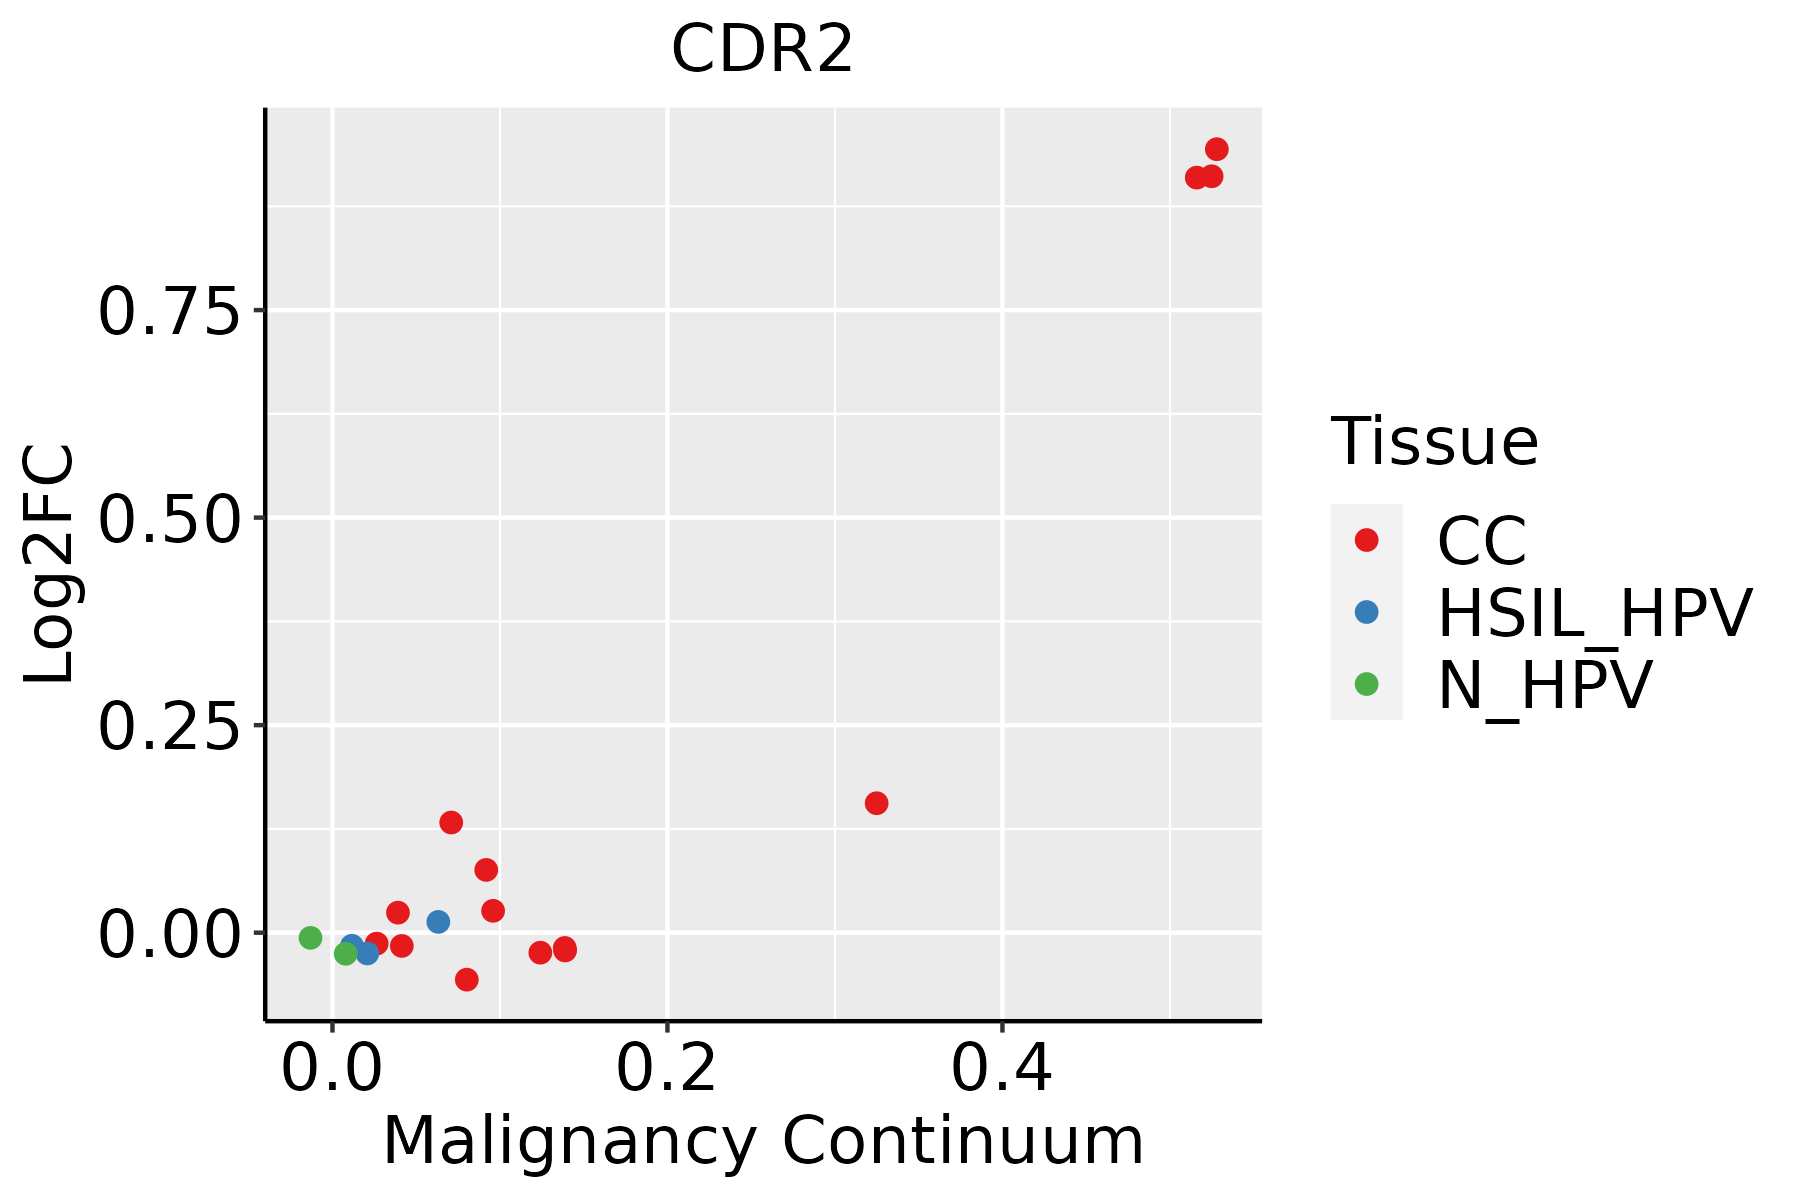 | CC: Cervix cancer |
| HSIL_HPV: HPV-infected high-grade squamous intraepithelial lesions | ||
| N_HPV: HPV-infected normal cervix | ||
| Colorectum (GSE201348) |  | FAP: Familial adenomatous polyposis |
| CRC: Colorectal cancer | ||
| Colorectum (HTA11) |  | AD: Adenomas |
| SER: Sessile serrated lesions | ||
| MSI-H: Microsatellite-high colorectal cancer | ||
| MSS: Microsatellite stable colorectal cancer | ||
| Liver | 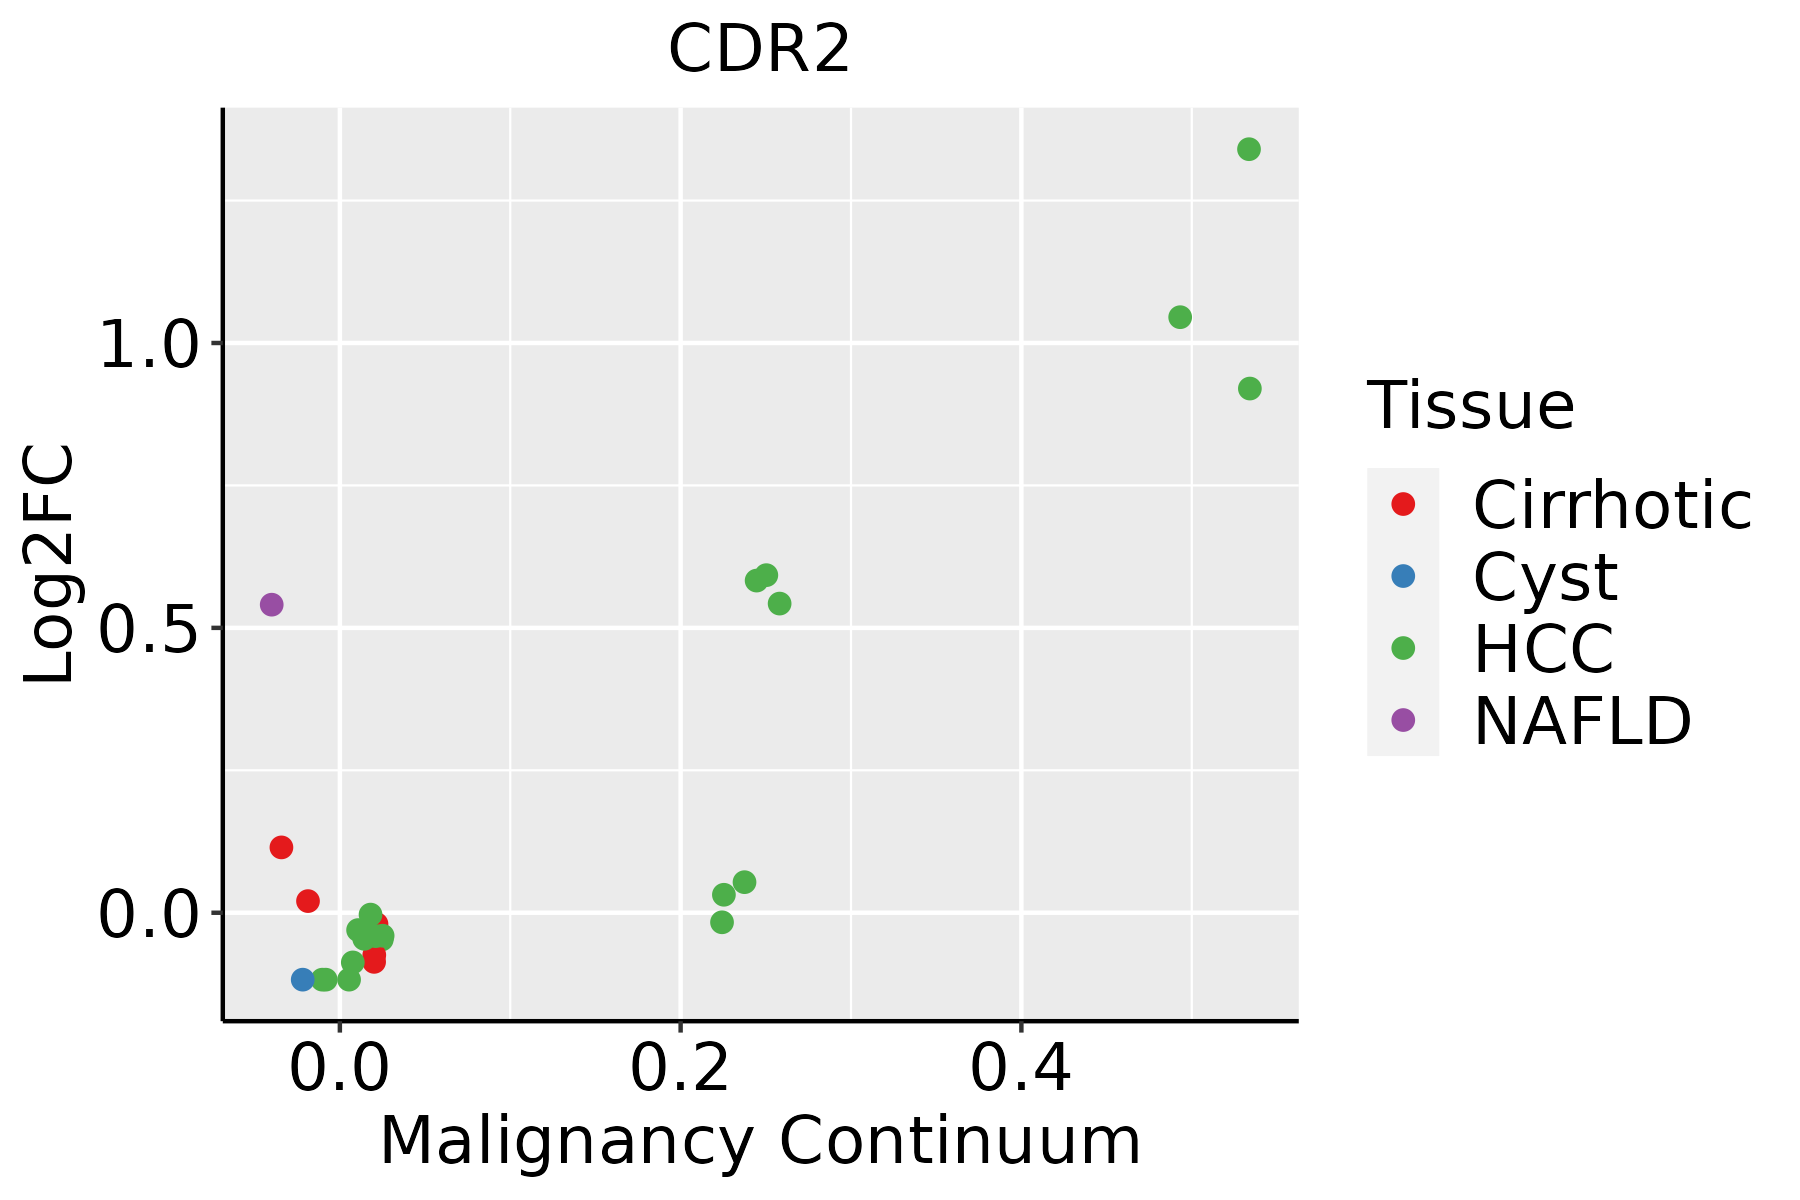 | HCC: Hepatocellular carcinoma |
| NAFLD: Non-alcoholic fatty liver disease | ||
| Prostate |  | BPH: Benign Prostatic Hyperplasia |
| ∗log2FC in expression of this searched gene in stem-like cells from each diseased tissue sample relative to stem-like cells in normal samples in each tissue plotted against the malignancy continuum. Samples are colored based on if they are from different disease stage. |
Top |
Malignant transformation related pathway analysis |
| Find out the enriched GO biological processes and KEGG pathways involved in transition from healthy to precancer to cancer |
| Tissue | Disease Stage | Enriched GO biological Processes |
| Colorectum | AD |  |
| Colorectum | SER |  |
| Colorectum | MSS |  |
| Colorectum | MSI-H |  |
| Colorectum | FAP |  |
| ∗Top 15 enriched GO BP terms are showed in the bar plot of each disease state in each tissue. Each row represents a significant GO biological process which is colored according to the -log10(p.adjust). |
| Page: 1 2 3 4 5 6 7 8 9 |
| GO ID | Tissue | Disease Stage | Description | Gene Ratio | Bg Ratio | pvalue | p.adjust | Count |
| Page: 1 |
| Pathway ID | Tissue | Disease Stage | Description | Gene Ratio | Bg Ratio | pvalue | p.adjust | qvalue | Count |
| Page: 1 |
Top |
Cell-cell communication analysis |
| Identification of potential cell-cell interactions between two cell types and their ligand-receptor pairs for different disease states |
| Ligand | Receptor | LRpair | Pathway | Tissue | Disease Stage |
| Page: 1 |
Top |
Single-cell gene regulatory network inference analysis |
| Find out the significant the regulons (TFs) and the target genes of each regulon across cell types for different disease states |
| TF | Cell Type | Tissue | Disease Stage | Target Gene | RSS | Regulon Activity |
| ∗The dot plots of a searched regulon are shown for all cell subpopulations in each disease state of each tissue based on the regulon specific score inferred using pySCENIC and by calculating the average expression. |
| Page: 1 |
Top |
Somatic mutation of malignant transformation related genes |
| Annotation of somatic variants for genes involved in malignant transformation |
| Hugo Symbol | Variant Class | Variant Classification | dbSNP RS | HGVSc | HGVSp | HGVSp Short | SWISSPROT | BIOTYPE | SIFT | PolyPhen | Tumor Sample Barcode | Tissue | Histology | Sex | Age | Stage | Therapy Types | Drugs | Outcome |
| CDR2 | SNV | Missense_Mutation | c.766G>A | p.Glu256Lys | p.E256K | Q01850 | protein_coding | deleterious(0) | possibly_damaging(0.793) | TCGA-AR-A0TX-01 | Breast | breast invasive carcinoma | Female | <65 | I/II | Unknown | Unknown | SD | |
| CDR2 | SNV | Missense_Mutation | novel | c.1211A>G | p.Glu404Gly | p.E404G | Q01850 | protein_coding | tolerated(0.15) | possibly_damaging(0.587) | TCGA-D8-A1X6-01 | Breast | breast invasive carcinoma | Female | >=65 | III/IV | Hormone Therapy | tamoxiphen | SD |
| CDR2 | SNV | Missense_Mutation | novel | c.1211A>G | p.Glu404Gly | p.E404G | Q01850 | protein_coding | tolerated(0.15) | possibly_damaging(0.587) | TCGA-E9-A1RE-01 | Breast | breast invasive carcinoma | Female | >=65 | III/IV | Hormone Therapy | tamoxiphen | SD |
| CDR2 | SNV | Missense_Mutation | novel | c.647N>A | p.Arg216Gln | p.R216Q | Q01850 | protein_coding | deleterious(0.01) | possibly_damaging(0.905) | TCGA-GM-A3NW-01 | Breast | breast invasive carcinoma | Female | <65 | I/II | Chemotherapy | fluorouracil | SD |
| CDR2 | insertion | Frame_Shift_Ins | novel | c.412_413insTTGTCACAAAAATTGAGTTTGCTTTCATGTGTTTATTTACC | p.Ser138PhefsTer38 | p.S138Ffs*38 | Q01850 | protein_coding | TCGA-A2-A0CT-01 | Breast | breast invasive carcinoma | Female | >=65 | I/II | Chemotherapy | cytoxan | SD | ||
| CDR2 | insertion | Frame_Shift_Ins | novel | c.625_626insCATTTGTAGTCTCCTTTGCCTATTTAAAGAGCTCT | p.Leu209ProfsTer13 | p.L209Pfs*13 | Q01850 | protein_coding | TCGA-AN-A0FT-01 | Breast | breast invasive carcinoma | Female | <65 | I/II | Unknown | Unknown | SD | ||
| CDR2 | insertion | Nonsense_Mutation | novel | c.975_976insTTTGATATAAGTTAGCTTGTTAGCATATGCCCTAGA | p.Lys325_Gly326insPheAspIleSerTerLeuValSerIleCysProArg | p.K325_G326insFDIS*LVSICPR | Q01850 | protein_coding | TCGA-AO-A0JB-01 | Breast | breast invasive carcinoma | Female | <65 | III/IV | Chemotherapy | cyclophosphamide | SD | ||
| CDR2 | SNV | Missense_Mutation | c.574N>C | p.Glu192Gln | p.E192Q | Q01850 | protein_coding | deleterious(0.01) | possibly_damaging(0.787) | TCGA-C5-A1BM-01 | Cervix | cervical & endocervical cancer | Female | >=65 | I/II | Unknown | Unknown | SD | |
| CDR2 | SNV | Missense_Mutation | c.1100N>A | p.Cys367Tyr | p.C367Y | Q01850 | protein_coding | deleterious(0.03) | probably_damaging(0.971) | TCGA-A6-5661-01 | Colorectum | colon adenocarcinoma | Female | >=65 | I/II | Unknown | Unknown | SD | |
| CDR2 | SNV | Missense_Mutation | c.850N>G | p.Lys284Glu | p.K284E | Q01850 | protein_coding | tolerated(0.79) | benign(0.027) | TCGA-AA-3663-01 | Colorectum | colon adenocarcinoma | Male | <65 | I/II | Unknown | Unknown | SD |
| Page: 1 2 3 4 5 |
Top |
Related drugs of malignant transformation related genes |
| Identification of chemicals and drugs interact with genes involved in malignant transfromation |
| (DGIdb 4.0) |
| Entrez ID | Symbol | Category | Interaction Types | Drug Claim Name | Drug Name | PMIDs |
| Page: 1 |

Copyright 2023-Present -The University of Texas Health Science Center at Houston |