
|
|||||
|
 | |
| |
| |
| |
| |
| |
|
Gene: CDKN2D |
Gene summary for CDKN2D |
| Gene information | Species | Human | Gene symbol | CDKN2D | Gene ID | 1032 |
| Gene name | cyclin dependent kinase inhibitor 2D | |
| Gene Alias | INK4D | |
| Cytomap | 19p13.2 | |
| Gene Type | protein-coding | GO ID | GO:0000079 | UniProtAcc | A0A024R796 |
Top |
Malignant transformation analysis |
| Identification of the aberrant gene expression in precancerous and cancerous lesions by comparing the gene expression of stem-like cells in diseased tissues with normal stem cells |
| Entrez ID | Symbol | Replicates | Species | Organ | Tissue | Adj P-value | Log2FC | Malignancy |
| 1032 | CDKN2D | LZE4T | Human | Esophagus | ESCC | 1.48e-07 | 2.09e-01 | 0.0811 |
| 1032 | CDKN2D | LZE20T | Human | Esophagus | ESCC | 2.33e-03 | 1.46e-01 | 0.0662 |
| 1032 | CDKN2D | LZE24T | Human | Esophagus | ESCC | 1.00e-06 | 2.36e-01 | 0.0596 |
| 1032 | CDKN2D | P1T-E | Human | Esophagus | ESCC | 7.47e-04 | 1.79e-01 | 0.0875 |
| 1032 | CDKN2D | P2T-E | Human | Esophagus | ESCC | 8.68e-14 | 7.81e-02 | 0.1177 |
| 1032 | CDKN2D | P4T-E | Human | Esophagus | ESCC | 2.67e-14 | 3.42e-01 | 0.1323 |
| 1032 | CDKN2D | P5T-E | Human | Esophagus | ESCC | 3.90e-15 | 3.42e-01 | 0.1327 |
| 1032 | CDKN2D | P8T-E | Human | Esophagus | ESCC | 7.61e-07 | 1.91e-01 | 0.0889 |
| 1032 | CDKN2D | P9T-E | Human | Esophagus | ESCC | 1.36e-07 | 1.34e-01 | 0.1131 |
| 1032 | CDKN2D | P10T-E | Human | Esophagus | ESCC | 2.58e-10 | 3.28e-01 | 0.116 |
| 1032 | CDKN2D | P12T-E | Human | Esophagus | ESCC | 1.09e-16 | 2.66e-01 | 0.1122 |
| 1032 | CDKN2D | P15T-E | Human | Esophagus | ESCC | 7.58e-10 | 1.52e-01 | 0.1149 |
| 1032 | CDKN2D | P16T-E | Human | Esophagus | ESCC | 2.39e-08 | 4.77e-02 | 0.1153 |
| 1032 | CDKN2D | P17T-E | Human | Esophagus | ESCC | 4.76e-05 | 2.07e-01 | 0.1278 |
| 1032 | CDKN2D | P20T-E | Human | Esophagus | ESCC | 4.48e-16 | 3.29e-01 | 0.1124 |
| 1032 | CDKN2D | P21T-E | Human | Esophagus | ESCC | 1.49e-22 | 4.00e-01 | 0.1617 |
| 1032 | CDKN2D | P22T-E | Human | Esophagus | ESCC | 2.89e-11 | 9.53e-02 | 0.1236 |
| 1032 | CDKN2D | P23T-E | Human | Esophagus | ESCC | 1.17e-14 | 4.06e-01 | 0.108 |
| 1032 | CDKN2D | P24T-E | Human | Esophagus | ESCC | 6.92e-05 | 6.77e-02 | 0.1287 |
| 1032 | CDKN2D | P26T-E | Human | Esophagus | ESCC | 4.95e-26 | 3.89e-01 | 0.1276 |
| Page: 1 2 3 4 |
| Tissue | Expression Dynamics | Abbreviation |
| Esophagus | 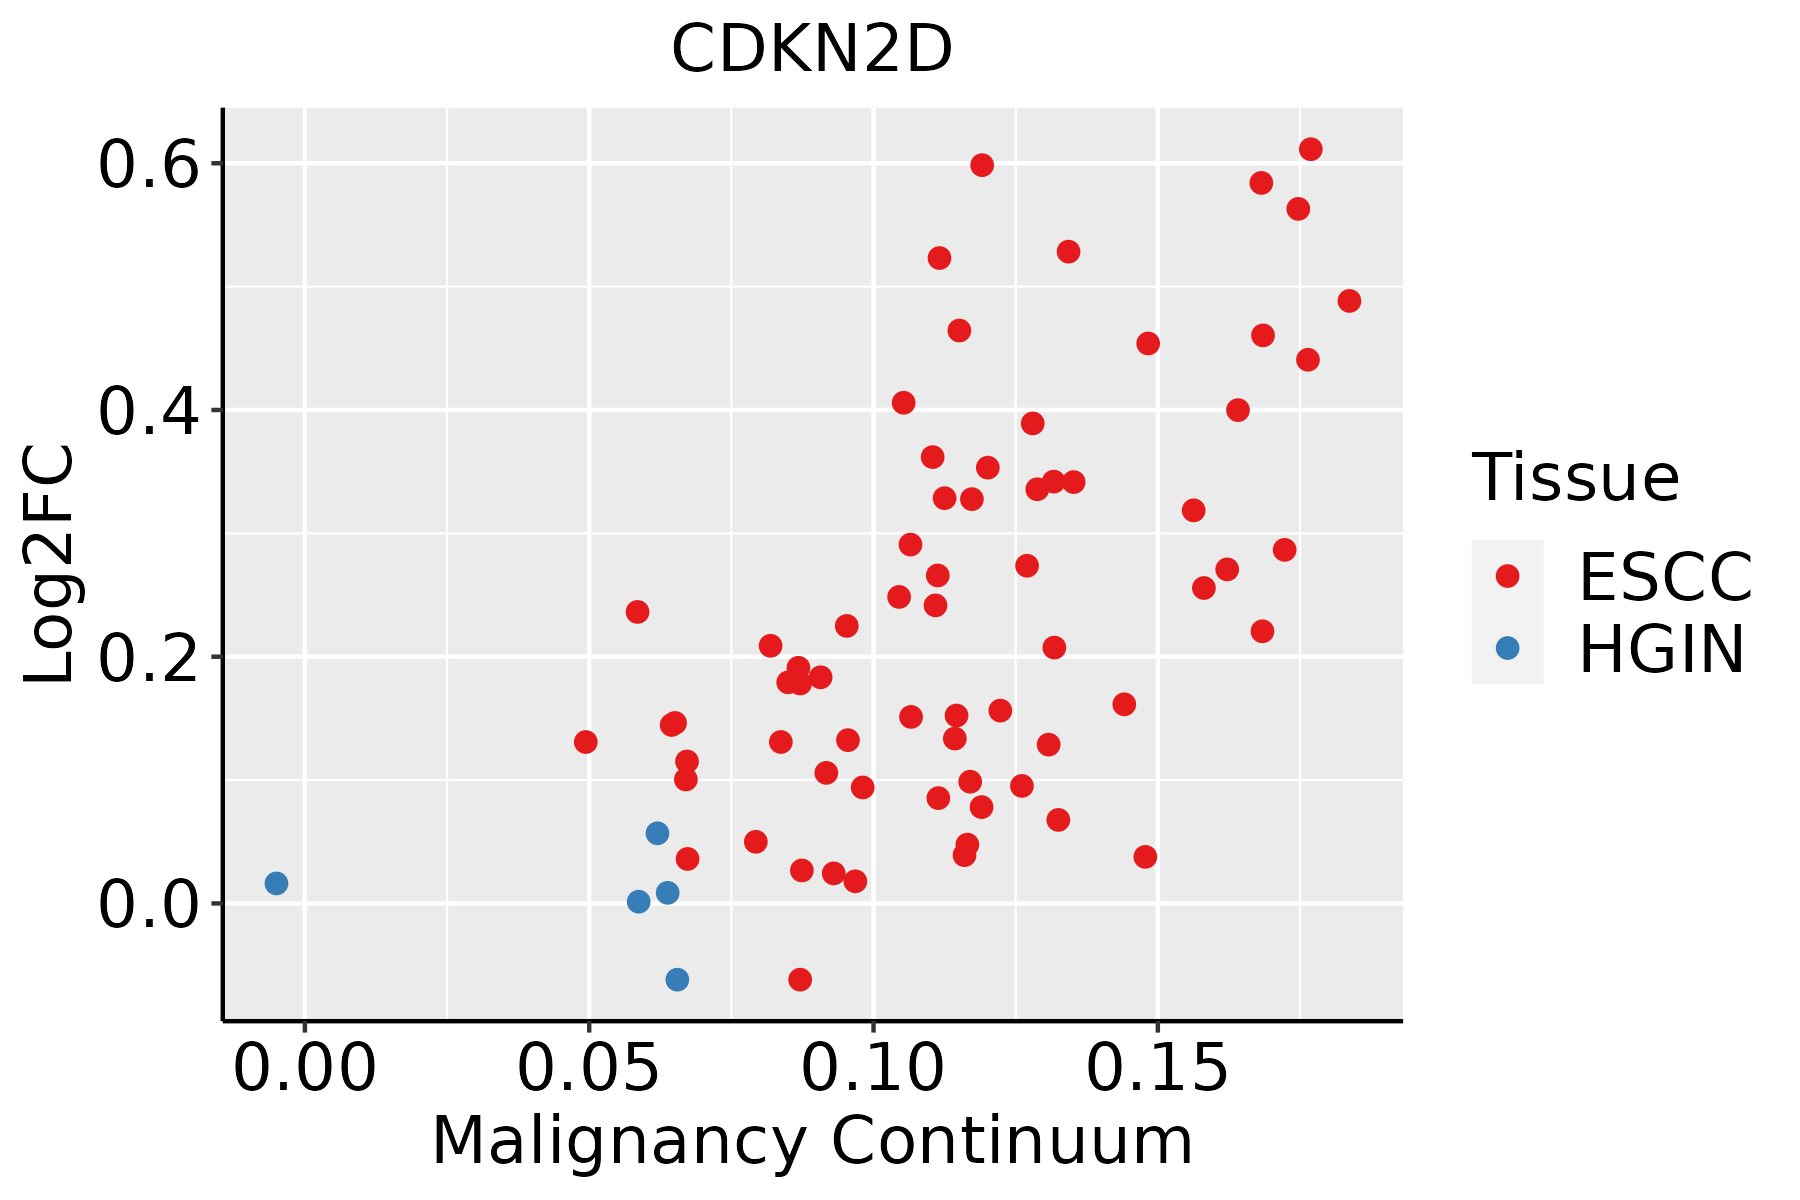 | ESCC: Esophageal squamous cell carcinoma |
| HGIN: High-grade intraepithelial neoplasias | ||
| LGIN: Low-grade intraepithelial neoplasias | ||
| Oral Cavity |  | EOLP: Erosive Oral lichen planus |
| LP: leukoplakia | ||
| NEOLP: Non-erosive oral lichen planus | ||
| OSCC: Oral squamous cell carcinoma | ||
| Thyroid |  | ATC: Anaplastic thyroid cancer |
| HT: Hashimoto's thyroiditis | ||
| PTC: Papillary thyroid cancer |
| ∗log2FC in expression of this searched gene in stem-like cells from each diseased tissue sample relative to stem-like cells in normal samples in each tissue plotted against the malignancy continuum. Samples are colored based on if they are from different disease stage. |
Top |
Malignant transformation related pathway analysis |
| Find out the enriched GO biological processes and KEGG pathways involved in transition from healthy to precancer to cancer |
| Tissue | Disease Stage | Enriched GO biological Processes |
| Colorectum | AD |  |
| Colorectum | SER |  |
| Colorectum | MSS |  |
| Colorectum | MSI-H |  |
| Colorectum | FAP |  |
| ∗Top 15 enriched GO BP terms are showed in the bar plot of each disease state in each tissue. Each row represents a significant GO biological process which is colored according to the -log10(p.adjust). |
| Page: 1 2 3 4 5 6 7 8 9 |
| GO ID | Tissue | Disease Stage | Description | Gene Ratio | Bg Ratio | pvalue | p.adjust | Count |
| GO:0097193111 | Esophagus | ESCC | intrinsic apoptotic signaling pathway | 222/8552 | 288/18723 | 5.87e-28 | 2.02e-25 | 222 |
| GO:2001233111 | Esophagus | ESCC | regulation of apoptotic signaling pathway | 256/8552 | 356/18723 | 4.11e-24 | 1.04e-21 | 256 |
| GO:004477216 | Esophagus | ESCC | mitotic cell cycle phase transition | 281/8552 | 424/18723 | 4.63e-18 | 4.45e-16 | 281 |
| GO:2001242111 | Esophagus | ESCC | regulation of intrinsic apoptotic signaling pathway | 128/8552 | 164/18723 | 1.75e-17 | 1.50e-15 | 128 |
| GO:2001234111 | Esophagus | ESCC | negative regulation of apoptotic signaling pathway | 161/8552 | 224/18723 | 1.24e-15 | 8.09e-14 | 161 |
| GO:000941113 | Esophagus | ESCC | response to UV | 115/8552 | 149/18723 | 3.29e-15 | 1.93e-13 | 115 |
| GO:0010563111 | Esophagus | ESCC | negative regulation of phosphorus metabolic process | 274/8552 | 442/18723 | 2.32e-12 | 9.41e-11 | 274 |
| GO:0045936111 | Esophagus | ESCC | negative regulation of phosphate metabolic process | 273/8552 | 441/18723 | 3.18e-12 | 1.25e-10 | 273 |
| GO:2001243111 | Esophagus | ESCC | negative regulation of intrinsic apoptotic signaling pathway | 78/8552 | 98/18723 | 5.50e-12 | 2.10e-10 | 78 |
| GO:0031667111 | Esophagus | ESCC | response to nutrient levels | 289/8552 | 474/18723 | 9.25e-12 | 3.47e-10 | 289 |
| GO:007189716 | Esophagus | ESCC | DNA biosynthetic process | 127/8552 | 180/18723 | 1.04e-11 | 3.85e-10 | 127 |
| GO:0051348111 | Esophagus | ESCC | negative regulation of transferase activity | 177/8552 | 268/18723 | 1.08e-11 | 4.00e-10 | 177 |
| GO:007190016 | Esophagus | ESCC | regulation of protein serine/threonine kinase activity | 227/8552 | 359/18723 | 1.12e-11 | 4.10e-10 | 227 |
| GO:0008630110 | Esophagus | ESCC | intrinsic apoptotic signaling pathway in response to DNA damage | 78/8552 | 99/18723 | 1.43e-11 | 5.08e-10 | 78 |
| GO:2000116111 | Esophagus | ESCC | regulation of cysteine-type endopeptidase activity | 158/8552 | 235/18723 | 1.67e-11 | 5.90e-10 | 158 |
| GO:0043281111 | Esophagus | ESCC | regulation of cysteine-type endopeptidase activity involved in apoptotic process | 143/8552 | 209/18723 | 2.12e-11 | 7.31e-10 | 143 |
| GO:190198713 | Esophagus | ESCC | regulation of cell cycle phase transition | 242/8552 | 390/18723 | 3.86e-11 | 1.26e-09 | 242 |
| GO:000931419 | Esophagus | ESCC | response to radiation | 277/8552 | 456/18723 | 4.42e-11 | 1.43e-09 | 277 |
| GO:0016049110 | Esophagus | ESCC | cell growth | 289/8552 | 482/18723 | 1.29e-10 | 3.77e-09 | 289 |
| GO:0042326111 | Esophagus | ESCC | negative regulation of phosphorylation | 237/8552 | 385/18723 | 1.86e-10 | 5.33e-09 | 237 |
| Page: 1 2 3 4 5 6 7 8 9 10 11 12 13 |
| Pathway ID | Tissue | Disease Stage | Description | Gene Ratio | Bg Ratio | pvalue | p.adjust | qvalue | Count |
| hsa0411023 | Esophagus | ESCC | Cell cycle | 126/4205 | 157/8465 | 1.34e-15 | 5.60e-14 | 2.87e-14 | 126 |
| hsa040689 | Esophagus | ESCC | FoxO signaling pathway | 89/4205 | 131/8465 | 1.56e-05 | 7.98e-05 | 4.09e-05 | 89 |
| hsa0411033 | Esophagus | ESCC | Cell cycle | 126/4205 | 157/8465 | 1.34e-15 | 5.60e-14 | 2.87e-14 | 126 |
| hsa0406814 | Esophagus | ESCC | FoxO signaling pathway | 89/4205 | 131/8465 | 1.56e-05 | 7.98e-05 | 4.09e-05 | 89 |
| hsa041108 | Oral cavity | OSCC | Cell cycle | 118/3704 | 157/8465 | 7.15e-16 | 2.66e-14 | 1.35e-14 | 118 |
| hsa040688 | Oral cavity | OSCC | FoxO signaling pathway | 85/3704 | 131/8465 | 7.50e-07 | 4.33e-06 | 2.21e-06 | 85 |
| hsa0411015 | Oral cavity | OSCC | Cell cycle | 118/3704 | 157/8465 | 7.15e-16 | 2.66e-14 | 1.35e-14 | 118 |
| hsa0406813 | Oral cavity | OSCC | FoxO signaling pathway | 85/3704 | 131/8465 | 7.50e-07 | 4.33e-06 | 2.21e-06 | 85 |
| hsa0411022 | Oral cavity | LP | Cell cycle | 70/2418 | 157/8465 | 1.17e-05 | 8.27e-05 | 5.33e-05 | 70 |
| hsa0411032 | Oral cavity | LP | Cell cycle | 70/2418 | 157/8465 | 1.17e-05 | 8.27e-05 | 5.33e-05 | 70 |
| Page: 1 |
Top |
Cell-cell communication analysis |
| Identification of potential cell-cell interactions between two cell types and their ligand-receptor pairs for different disease states |
| Ligand | Receptor | LRpair | Pathway | Tissue | Disease Stage |
| Page: 1 |
Top |
Single-cell gene regulatory network inference analysis |
| Find out the significant the regulons (TFs) and the target genes of each regulon across cell types for different disease states |
| TF | Cell Type | Tissue | Disease Stage | Target Gene | RSS | Regulon Activity |
| ∗The dot plots of a searched regulon are shown for all cell subpopulations in each disease state of each tissue based on the regulon specific score inferred using pySCENIC and by calculating the average expression. |
| Page: 1 |
Top |
Somatic mutation of malignant transformation related genes |
| Annotation of somatic variants for genes involved in malignant transformation |
| Hugo Symbol | Variant Class | Variant Classification | dbSNP RS | HGVSc | HGVSp | HGVSp Short | SWISSPROT | BIOTYPE | SIFT | PolyPhen | Tumor Sample Barcode | Tissue | Histology | Sex | Age | Stage | Therapy Types | Drugs | Outcome |
| CDKN2D | SNV | Missense_Mutation | c.334N>A | p.His112Asn | p.H112N | P55273 | protein_coding | deleterious(0) | probably_damaging(0.995) | TCGA-DM-A1HB-01 | Colorectum | colon adenocarcinoma | Male | >=65 | III/IV | Unknown | Unknown | SD | |
| CDKN2D | SNV | Missense_Mutation | novel | c.389C>A | p.Ser130Tyr | p.S130Y | P55273 | protein_coding | deleterious(0) | probably_damaging(0.954) | TCGA-A5-A0G2-01 | Endometrium | uterine corpus endometrioid carcinoma | Female | <65 | III/IV | Unknown | Unknown | SD |
| CDKN2D | SNV | Missense_Mutation | novel | c.266C>T | p.Thr89Ile | p.T89I | P55273 | protein_coding | deleterious(0) | probably_damaging(0.999) | TCGA-A5-A0G2-01 | Endometrium | uterine corpus endometrioid carcinoma | Female | <65 | III/IV | Unknown | Unknown | SD |
| CDKN2D | SNV | Missense_Mutation | novel | c.150G>A | p.Met50Ile | p.M50I | P55273 | protein_coding | deleterious(0.02) | probably_damaging(0.97) | TCGA-AJ-A3EK-01 | Endometrium | uterine corpus endometrioid carcinoma | Female | <65 | I/II | Chemotherapy | carboplatin | CR |
| CDKN2D | SNV | Missense_Mutation | c.218C>G | p.Ser73Cys | p.S73C | P55273 | protein_coding | tolerated(0.17) | benign(0.337) | TCGA-AP-A0LF-01 | Endometrium | uterine corpus endometrioid carcinoma | Female | >=65 | III/IV | Unknown | Unknown | SD | |
| CDKN2D | SNV | Missense_Mutation | c.473N>C | p.Leu158Pro | p.L158P | P55273 | protein_coding | deleterious(0) | benign(0.391) | TCGA-BG-A18B-01 | Endometrium | uterine corpus endometrioid carcinoma | Female | <65 | I/II | Unknown | Unknown | SD | |
| CDKN2D | SNV | Missense_Mutation | novel | c.386N>G | p.Glu129Gly | p.E129G | P55273 | protein_coding | tolerated(0.33) | benign(0.207) | TCGA-D1-A175-01 | Endometrium | uterine corpus endometrioid carcinoma | Female | <65 | I/II | Chemotherapy | paclitaxel | SD |
| CDKN2D | SNV | Missense_Mutation | novel | c.449N>A | p.Gly150Glu | p.G150E | P55273 | protein_coding | tolerated(0.5) | possibly_damaging(0.618) | TCGA-62-8399-01 | Lung | lung adenocarcinoma | Male | <65 | III/IV | Unknown | Unknown | SD |
| CDKN2D | SNV | Missense_Mutation | c.405G>C | p.Arg135Ser | p.R135S | P55273 | protein_coding | deleterious(0.04) | benign(0.024) | TCGA-67-6217-01 | Lung | lung adenocarcinoma | Female | >=65 | I/II | Targeted Molecular therapy | tarceva | SD | |
| CDKN2D | SNV | Missense_Mutation | novel | c.494N>A | p.Pro165Gln | p.P165Q | P55273 | protein_coding | deleterious_low_confidence(0.01) | benign(0.277) | TCGA-18-3416-01 | Lung | lung squamous cell carcinoma | Male | >=65 | I/II | Unknown | Unknown | PD |
| Page: 1 2 |
Top |
Related drugs of malignant transformation related genes |
| Identification of chemicals and drugs interact with genes involved in malignant transfromation |
| (DGIdb 4.0) |
| Entrez ID | Symbol | Category | Interaction Types | Drug Claim Name | Drug Name | PMIDs |
| 1032 | CDKN2D | KINASE | 5-AZA-2&APOS;-DEOXYCYTIDINE | 11753657 | ||
| 1032 | CDKN2D | KINASE | IL-4 | 8760794,14657870 | ||
| 1032 | CDKN2D | KINASE | DEPSIPEPTIDE | ROMIDEPSIN | 11753657 | |
| 1032 | CDKN2D | KINASE | TRICHOSTATIN A | 15107822 |
| Page: 1 |

Copyright 2023-Present -The University of Texas Health Science Center at Houston |