
|
|||||
|
 | |
| |
| |
| |
| |
| |
|
Gene: CDKN2B |
Gene summary for CDKN2B |
| Gene information | Species | Human | Gene symbol | CDKN2B | Gene ID | 1030 |
| Gene name | cyclin dependent kinase inhibitor 2B | |
| Gene Alias | CDK4I | |
| Cytomap | 9p21.3 | |
| Gene Type | protein-coding | GO ID | GO:0000079 | UniProtAcc | K7PPU3 |
Top |
Malignant transformation analysis |
| Identification of the aberrant gene expression in precancerous and cancerous lesions by comparing the gene expression of stem-like cells in diseased tissues with normal stem cells |
| Entrez ID | Symbol | Replicates | Species | Organ | Tissue | Adj P-value | Log2FC | Malignancy |
| 1030 | CDKN2B | CA_HPV_2 | Human | Cervix | CC | 3.25e-04 | 2.58e-01 | 0.0391 |
| 1030 | CDKN2B | CCI_1 | Human | Cervix | CC | 3.49e-05 | 6.26e-01 | 0.528 |
| 1030 | CDKN2B | CCI_2 | Human | Cervix | CC | 1.50e-05 | 8.07e-01 | 0.5249 |
| 1030 | CDKN2B | CCI_3 | Human | Cervix | CC | 4.80e-07 | 5.92e-01 | 0.516 |
| 1030 | CDKN2B | Tumor | Human | Cervix | CC | 1.98e-19 | 4.77e-01 | 0.1241 |
| 1030 | CDKN2B | sample1 | Human | Cervix | CC | 2.91e-09 | 5.30e-01 | 0.0959 |
| 1030 | CDKN2B | sample3 | Human | Cervix | CC | 1.48e-29 | 5.72e-01 | 0.1387 |
| 1030 | CDKN2B | H2 | Human | Cervix | HSIL_HPV | 2.83e-04 | 3.04e-01 | 0.0632 |
| 1030 | CDKN2B | L1 | Human | Cervix | CC | 1.55e-04 | 4.04e-01 | 0.0802 |
| 1030 | CDKN2B | T1 | Human | Cervix | CC | 4.38e-24 | 6.30e-01 | 0.0918 |
| 1030 | CDKN2B | T3 | Human | Cervix | CC | 1.33e-22 | 4.96e-01 | 0.1389 |
| 1030 | CDKN2B | LZE7T | Human | Esophagus | ESCC | 2.41e-19 | 8.73e-01 | 0.0667 |
| 1030 | CDKN2B | LZE20T | Human | Esophagus | ESCC | 1.02e-17 | 9.56e-01 | 0.0662 |
| 1030 | CDKN2B | LZE21D1 | Human | Esophagus | HGIN | 3.76e-02 | 3.93e-01 | 0.0632 |
| 1030 | CDKN2B | LZE24T | Human | Esophagus | ESCC | 1.02e-28 | 1.30e+00 | 0.0596 |
| 1030 | CDKN2B | LZE21T | Human | Esophagus | ESCC | 3.45e-02 | 4.27e-01 | 0.0655 |
| 1030 | CDKN2B | P2T-E | Human | Esophagus | ESCC | 2.23e-46 | 1.03e+00 | 0.1177 |
| 1030 | CDKN2B | P4T-E | Human | Esophagus | ESCC | 5.65e-31 | 9.78e-01 | 0.1323 |
| 1030 | CDKN2B | P11T-E | Human | Esophagus | ESCC | 5.47e-03 | 3.65e-01 | 0.1426 |
| 1030 | CDKN2B | P15T-E | Human | Esophagus | ESCC | 4.87e-23 | 7.75e-01 | 0.1149 |
| Page: 1 2 3 4 |
| Tissue | Expression Dynamics | Abbreviation |
| Cervix |  | CC: Cervix cancer |
| HSIL_HPV: HPV-infected high-grade squamous intraepithelial lesions | ||
| N_HPV: HPV-infected normal cervix | ||
| Esophagus | 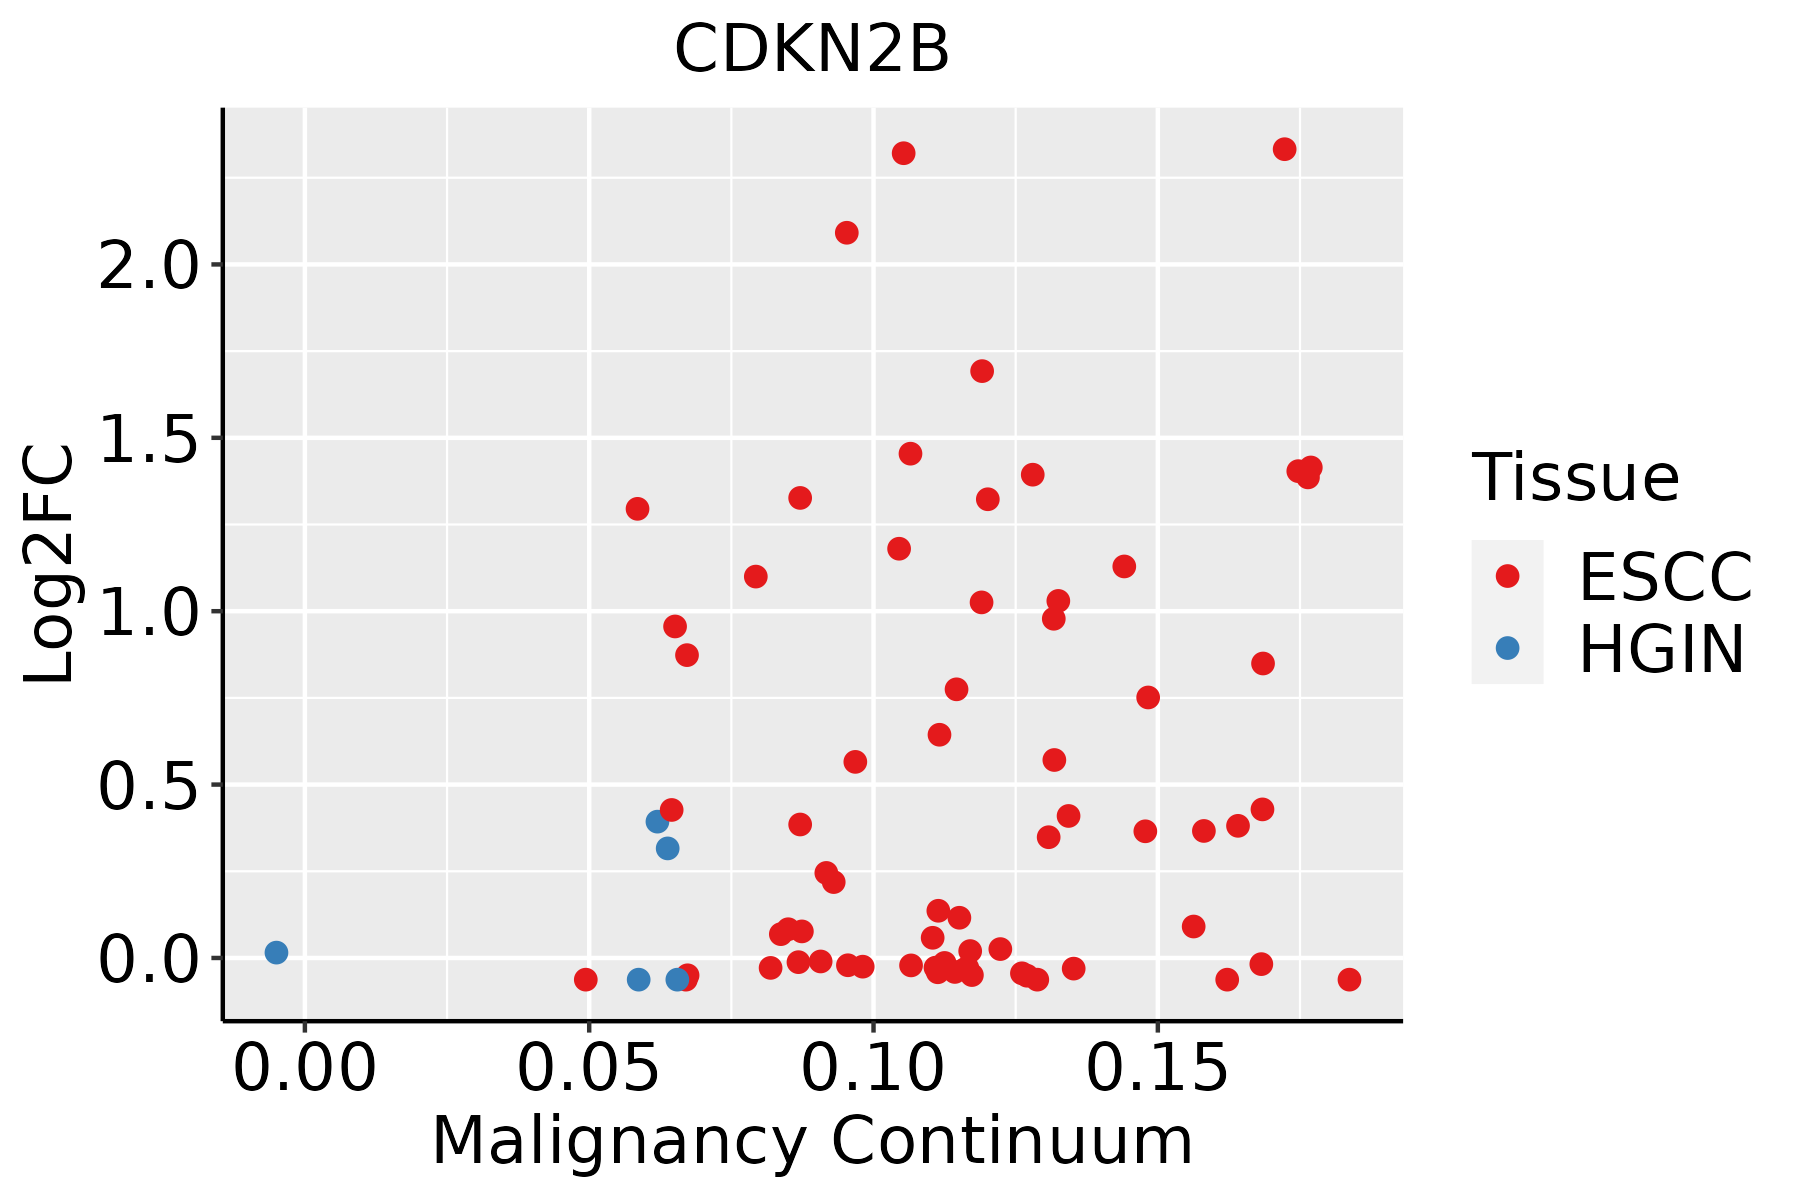 | ESCC: Esophageal squamous cell carcinoma |
| HGIN: High-grade intraepithelial neoplasias | ||
| LGIN: Low-grade intraepithelial neoplasias | ||
| Liver | 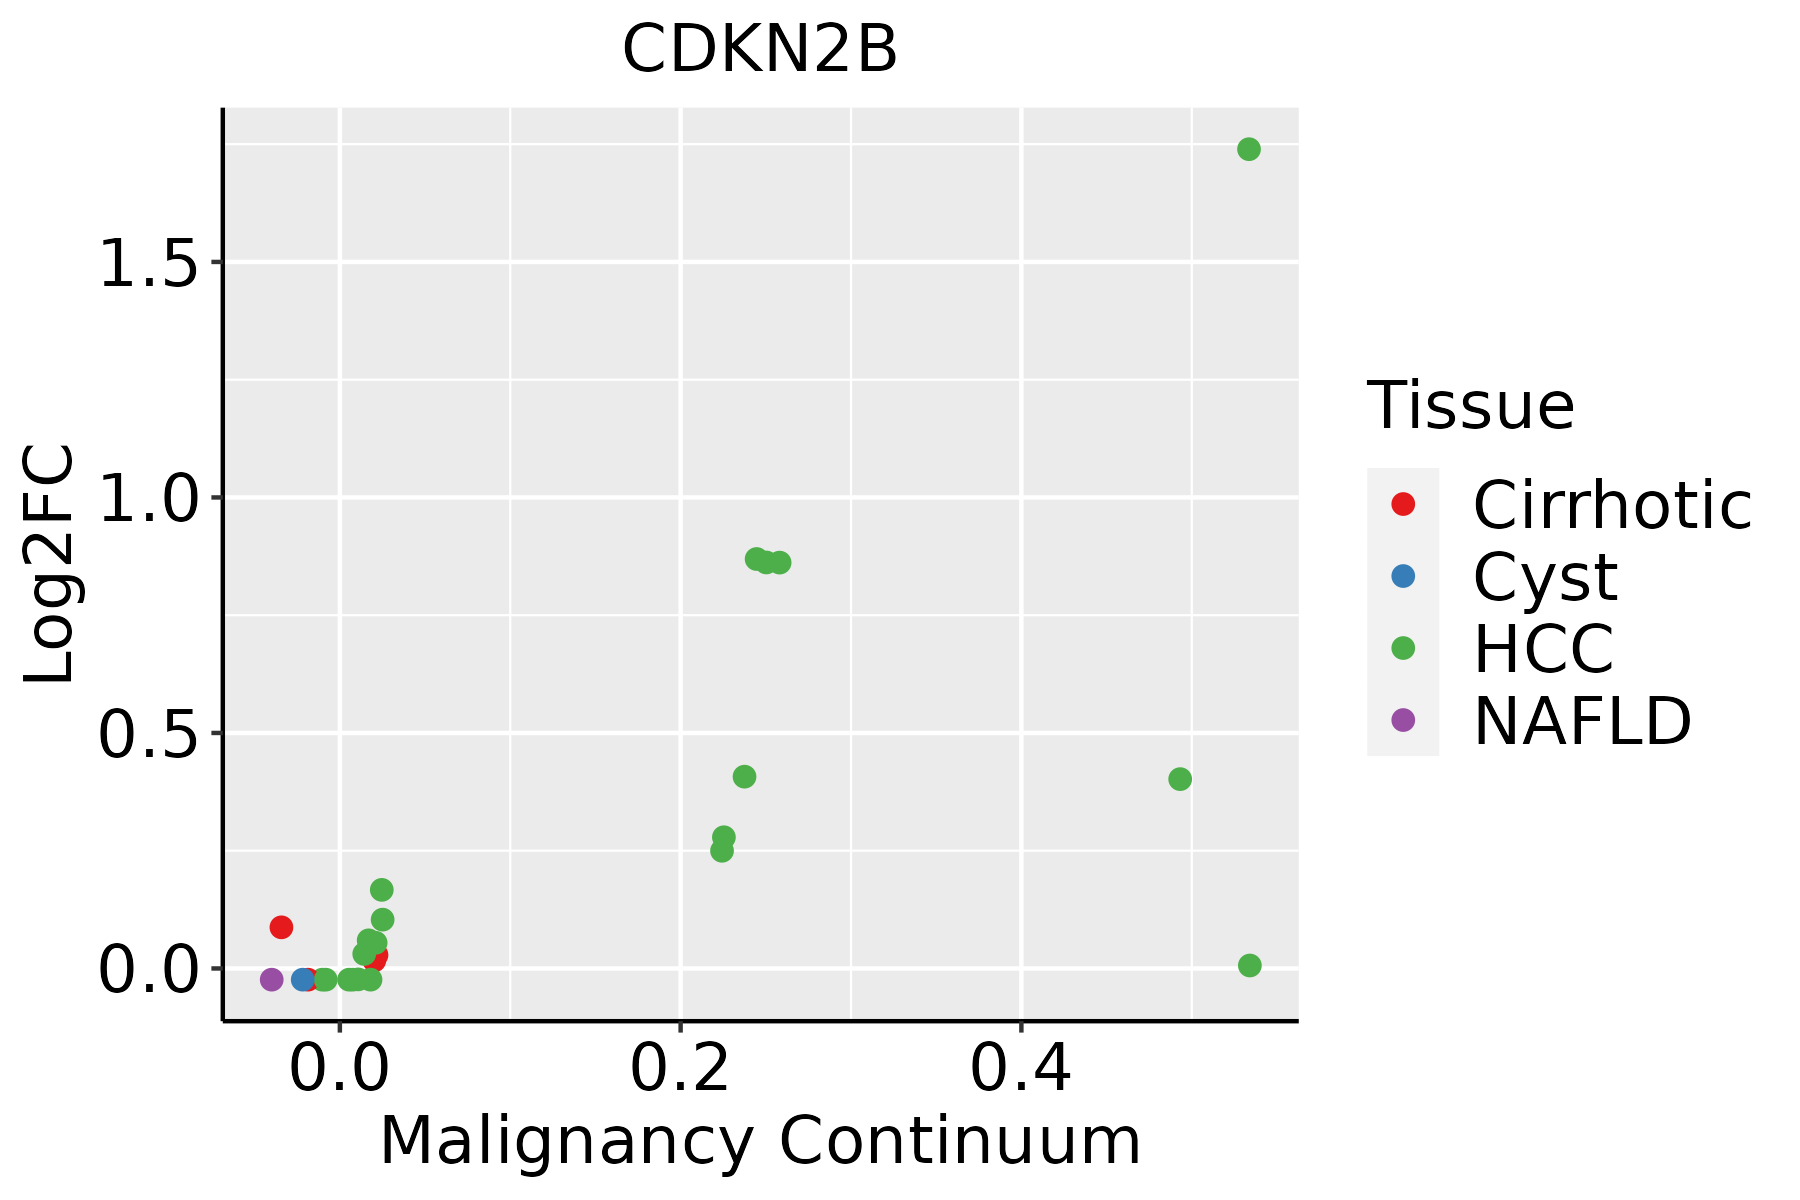 | HCC: Hepatocellular carcinoma |
| NAFLD: Non-alcoholic fatty liver disease | ||
| Lung | 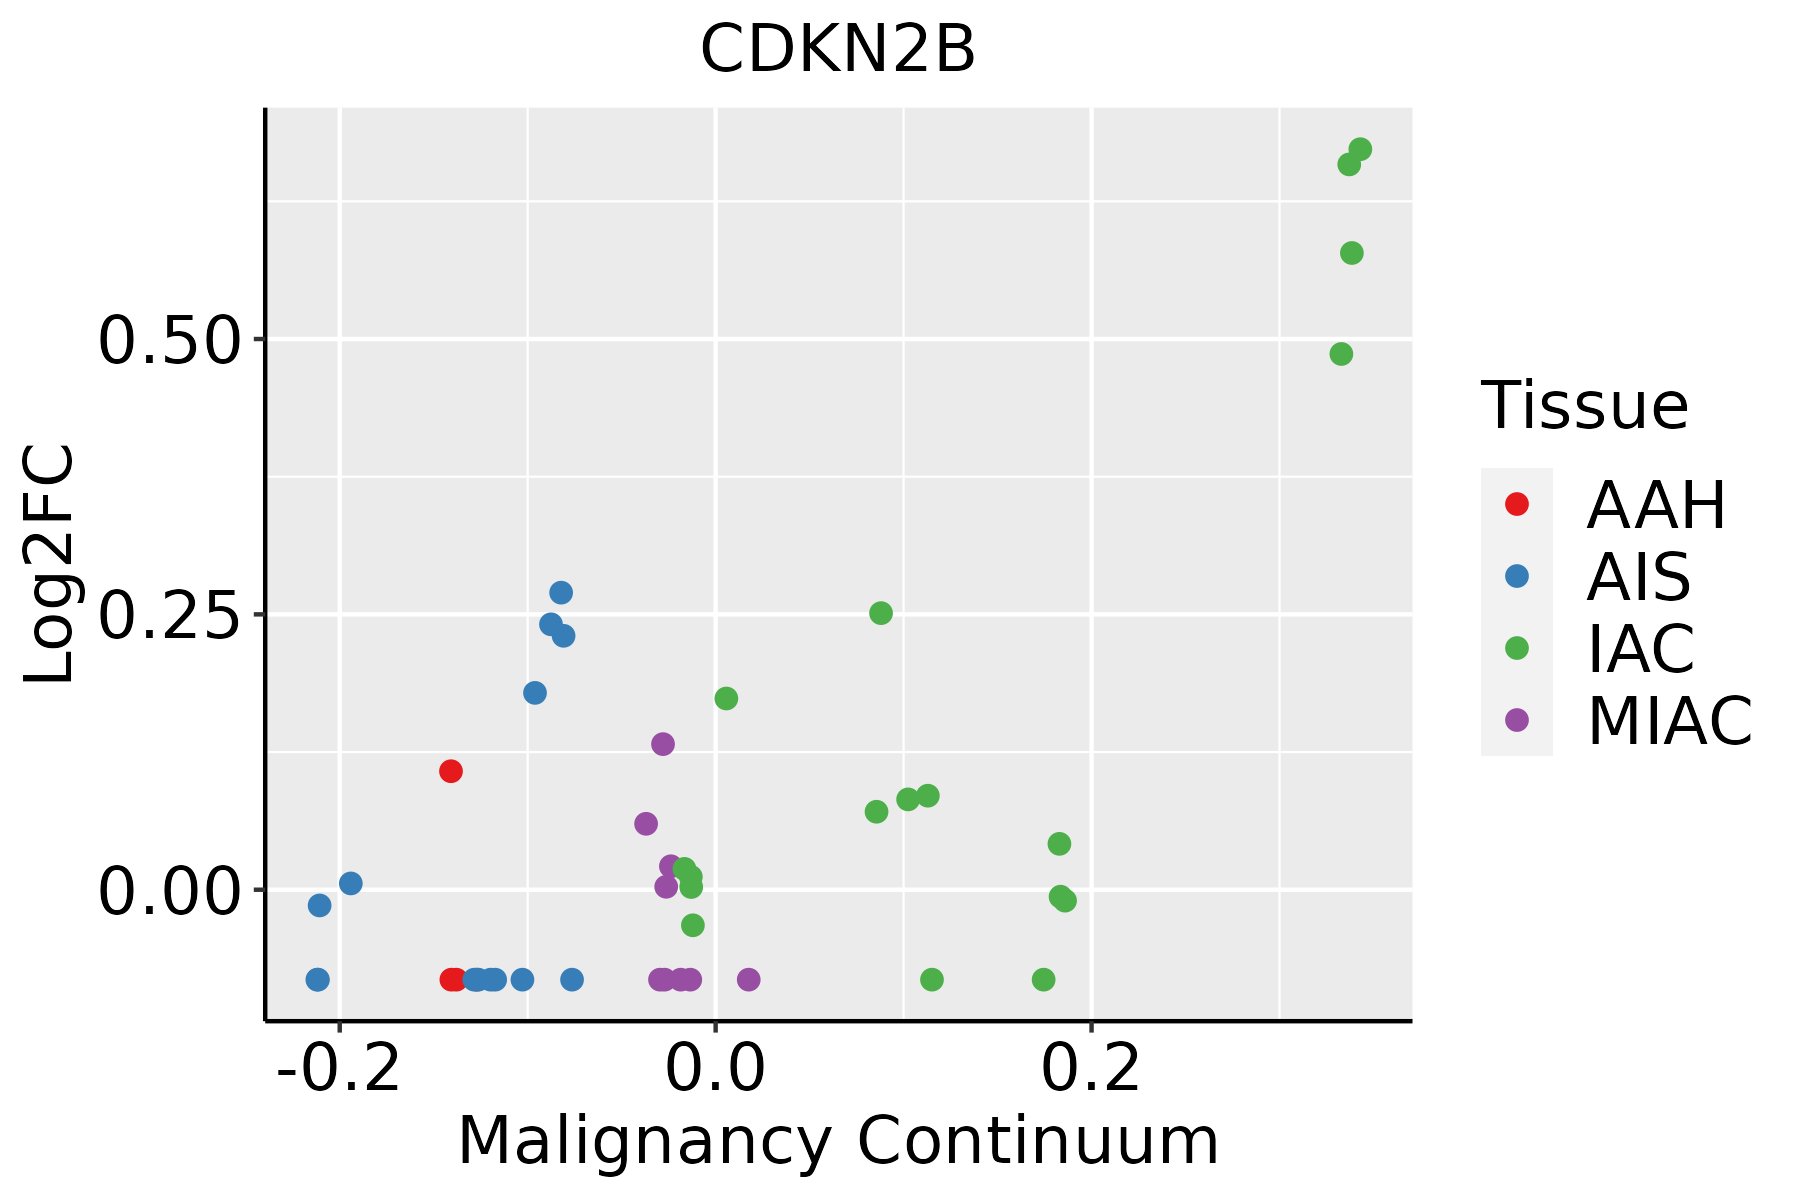 | AAH: Atypical adenomatous hyperplasia |
| AIS: Adenocarcinoma in situ | ||
| IAC: Invasive lung adenocarcinoma | ||
| MIA: Minimally invasive adenocarcinoma | ||
| Oral Cavity |  | EOLP: Erosive Oral lichen planus |
| LP: leukoplakia | ||
| NEOLP: Non-erosive oral lichen planus | ||
| OSCC: Oral squamous cell carcinoma | ||
| Prostate | 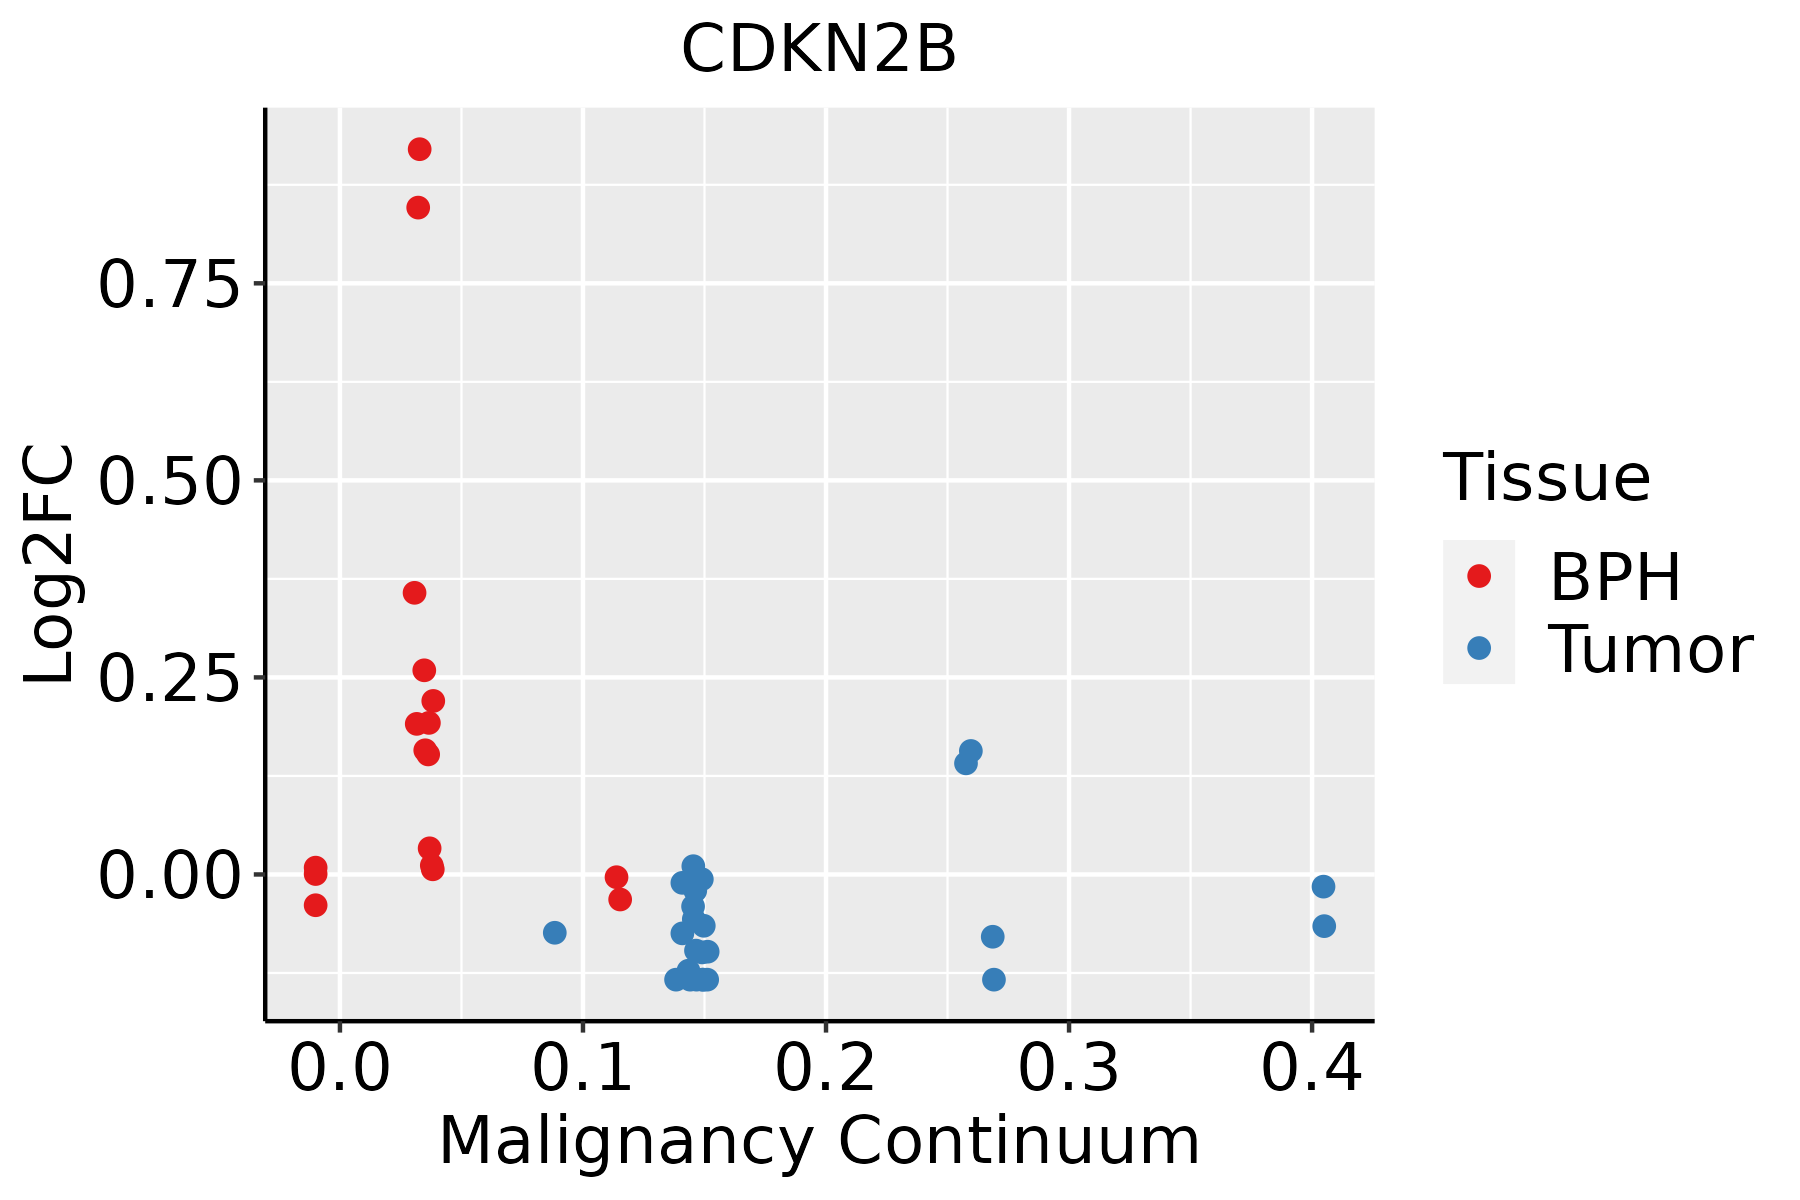 | BPH: Benign Prostatic Hyperplasia |
| Skin | 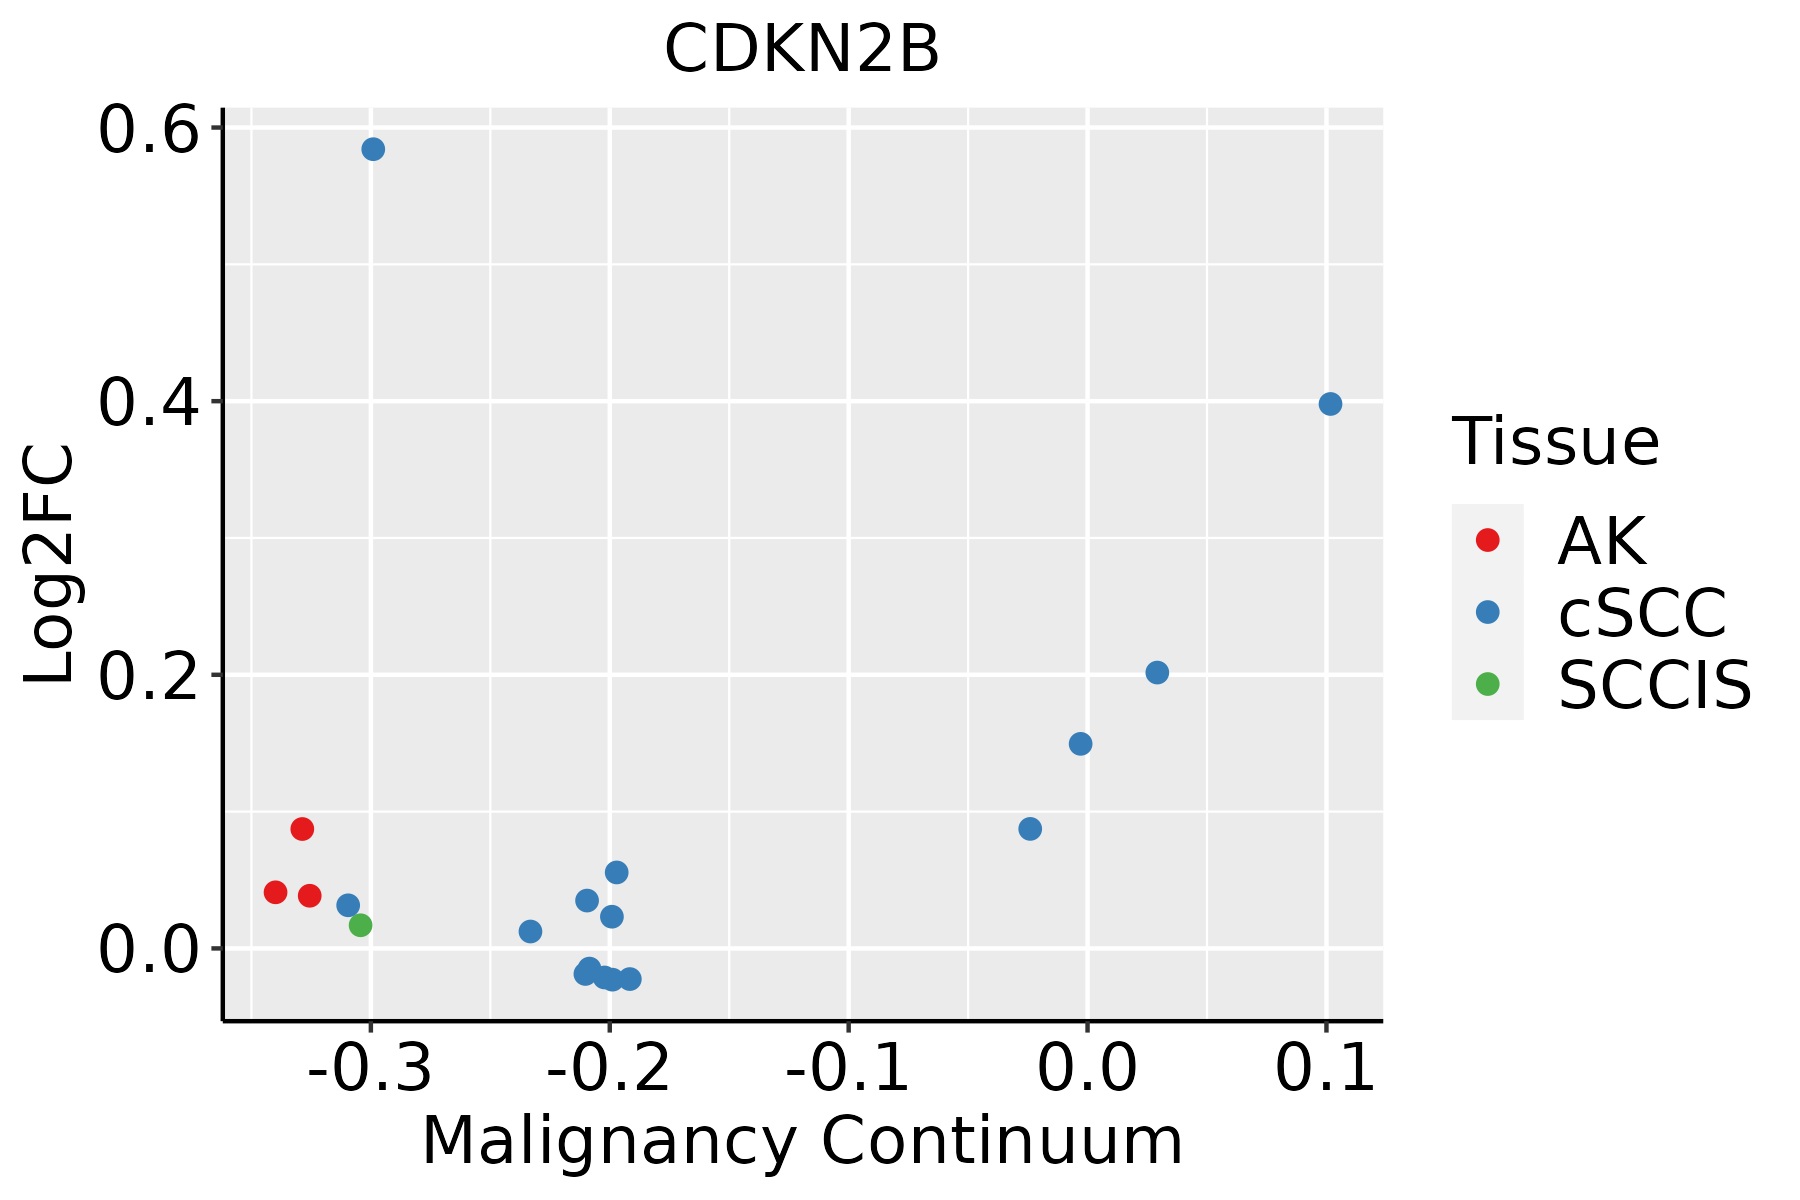 | AK: Actinic keratosis |
| cSCC: Cutaneous squamous cell carcinoma | ||
| SCCIS:squamous cell carcinoma in situ |
| ∗log2FC in expression of this searched gene in stem-like cells from each diseased tissue sample relative to stem-like cells in normal samples in each tissue plotted against the malignancy continuum. Samples are colored based on if they are from different disease stage. |
Top |
Malignant transformation related pathway analysis |
| Find out the enriched GO biological processes and KEGG pathways involved in transition from healthy to precancer to cancer |
| Tissue | Disease Stage | Enriched GO biological Processes |
| Colorectum | AD |  |
| Colorectum | SER |  |
| Colorectum | MSS |  |
| Colorectum | MSI-H |  |
| Colorectum | FAP |  |
| ∗Top 15 enriched GO BP terms are showed in the bar plot of each disease state in each tissue. Each row represents a significant GO biological process which is colored according to the -log10(p.adjust). |
| Page: 1 2 3 4 5 6 7 8 9 |
| GO ID | Tissue | Disease Stage | Description | Gene Ratio | Bg Ratio | pvalue | p.adjust | Count |
| GO:007149610 | Cervix | CC | cellular response to external stimulus | 78/2311 | 320/18723 | 1.82e-09 | 1.98e-07 | 78 |
| GO:00506737 | Cervix | CC | epithelial cell proliferation | 98/2311 | 437/18723 | 2.01e-09 | 2.15e-07 | 98 |
| GO:003009910 | Cervix | CC | myeloid cell differentiation | 83/2311 | 381/18723 | 1.31e-07 | 6.42e-06 | 83 |
| GO:00506787 | Cervix | CC | regulation of epithelial cell proliferation | 83/2311 | 381/18723 | 1.31e-07 | 6.42e-06 | 83 |
| GO:00447725 | Cervix | CC | mitotic cell cycle phase transition | 89/2311 | 424/18723 | 2.70e-07 | 1.12e-05 | 89 |
| GO:00075689 | Cervix | CC | aging | 75/2311 | 339/18723 | 2.75e-07 | 1.13e-05 | 75 |
| GO:00316689 | Cervix | CC | cellular response to extracellular stimulus | 59/2311 | 246/18723 | 3.03e-07 | 1.24e-05 | 59 |
| GO:00719007 | Cervix | CC | regulation of protein serine/threonine kinase activity | 75/2311 | 359/18723 | 2.76e-06 | 8.02e-05 | 75 |
| GO:005134810 | Cervix | CC | negative regulation of transferase activity | 60/2311 | 268/18723 | 2.77e-06 | 8.02e-05 | 60 |
| GO:004593610 | Cervix | CC | negative regulation of phosphate metabolic process | 88/2311 | 441/18723 | 2.92e-06 | 8.27e-05 | 88 |
| GO:001056310 | Cervix | CC | negative regulation of phosphorus metabolic process | 88/2311 | 442/18723 | 3.21e-06 | 8.77e-05 | 88 |
| GO:003166710 | Cervix | CC | response to nutrient levels | 92/2311 | 474/18723 | 5.80e-06 | 1.42e-04 | 92 |
| GO:20000453 | Cervix | CC | regulation of G1/S transition of mitotic cell cycle | 37/2311 | 142/18723 | 6.33e-06 | 1.53e-04 | 37 |
| GO:004232610 | Cervix | CC | negative regulation of phosphorylation | 77/2311 | 385/18723 | 1.09e-05 | 2.38e-04 | 77 |
| GO:00000824 | Cervix | CC | G1/S transition of mitotic cell cycle | 49/2311 | 214/18723 | 1.16e-05 | 2.48e-04 | 49 |
| GO:19028062 | Cervix | CC | regulation of cell cycle G1/S phase transition | 41/2311 | 168/18723 | 1.18e-05 | 2.51e-04 | 41 |
| GO:00073466 | Cervix | CC | regulation of mitotic cell cycle | 88/2311 | 457/18723 | 1.26e-05 | 2.60e-04 | 88 |
| GO:19019903 | Cervix | CC | regulation of mitotic cell cycle phase transition | 63/2311 | 299/18723 | 1.27e-05 | 2.60e-04 | 63 |
| GO:00316698 | Cervix | CC | cellular response to nutrient levels | 49/2311 | 215/18723 | 1.32e-05 | 2.68e-04 | 49 |
| GO:00448434 | Cervix | CC | cell cycle G1/S phase transition | 53/2311 | 241/18723 | 1.76e-05 | 3.32e-04 | 53 |
| Page: 1 2 3 4 5 6 7 8 9 10 11 12 13 14 15 16 17 18 19 20 |
| Pathway ID | Tissue | Disease Stage | Description | Gene Ratio | Bg Ratio | pvalue | p.adjust | qvalue | Count |
| hsa0421810 | Cervix | CC | Cellular senescence | 49/1267 | 156/8465 | 1.30e-07 | 1.63e-06 | 9.61e-07 | 49 |
| hsa0516620 | Cervix | CC | Human T-cell leukemia virus 1 infection | 61/1267 | 222/8465 | 8.13e-07 | 7.98e-06 | 4.72e-06 | 61 |
| hsa052226 | Cervix | CC | Small cell lung cancer | 29/1267 | 92/8465 | 4.38e-05 | 3.09e-04 | 1.83e-04 | 29 |
| hsa041106 | Cervix | CC | Cell cycle | 36/1267 | 157/8465 | 4.94e-03 | 1.67e-02 | 9.86e-03 | 36 |
| hsa0421815 | Cervix | CC | Cellular senescence | 49/1267 | 156/8465 | 1.30e-07 | 1.63e-06 | 9.61e-07 | 49 |
| hsa05166110 | Cervix | CC | Human T-cell leukemia virus 1 infection | 61/1267 | 222/8465 | 8.13e-07 | 7.98e-06 | 4.72e-06 | 61 |
| hsa0522213 | Cervix | CC | Small cell lung cancer | 29/1267 | 92/8465 | 4.38e-05 | 3.09e-04 | 1.83e-04 | 29 |
| hsa0411013 | Cervix | CC | Cell cycle | 36/1267 | 157/8465 | 4.94e-03 | 1.67e-02 | 9.86e-03 | 36 |
| hsa0516625 | Cervix | HSIL_HPV | Human T-cell leukemia virus 1 infection | 25/459 | 222/8465 | 3.95e-04 | 3.49e-03 | 2.82e-03 | 25 |
| hsa0522222 | Cervix | HSIL_HPV | Small cell lung cancer | 13/459 | 92/8465 | 1.30e-03 | 9.51e-03 | 7.68e-03 | 13 |
| hsa0516635 | Cervix | HSIL_HPV | Human T-cell leukemia virus 1 infection | 25/459 | 222/8465 | 3.95e-04 | 3.49e-03 | 2.82e-03 | 25 |
| hsa0522232 | Cervix | HSIL_HPV | Small cell lung cancer | 13/459 | 92/8465 | 1.30e-03 | 9.51e-03 | 7.68e-03 | 13 |
| hsa052039 | Esophagus | HGIN | Viral carcinogenesis | 53/1383 | 204/8465 | 2.58e-04 | 2.71e-03 | 2.15e-03 | 53 |
| hsa0421828 | Esophagus | HGIN | Cellular senescence | 42/1383 | 156/8465 | 4.94e-04 | 5.03e-03 | 4.00e-03 | 42 |
| hsa0516639 | Esophagus | HGIN | Human T-cell leukemia virus 1 infection | 51/1383 | 222/8465 | 5.84e-03 | 4.05e-02 | 3.22e-02 | 51 |
| hsa041109 | Esophagus | HGIN | Cell cycle | 38/1383 | 157/8465 | 6.70e-03 | 4.37e-02 | 3.47e-02 | 38 |
| hsa0520315 | Esophagus | HGIN | Viral carcinogenesis | 53/1383 | 204/8465 | 2.58e-04 | 2.71e-03 | 2.15e-03 | 53 |
| hsa04218111 | Esophagus | HGIN | Cellular senescence | 42/1383 | 156/8465 | 4.94e-04 | 5.03e-03 | 4.00e-03 | 42 |
| hsa05166114 | Esophagus | HGIN | Human T-cell leukemia virus 1 infection | 51/1383 | 222/8465 | 5.84e-03 | 4.05e-02 | 3.22e-02 | 51 |
| hsa0411016 | Esophagus | HGIN | Cell cycle | 38/1383 | 157/8465 | 6.70e-03 | 4.37e-02 | 3.47e-02 | 38 |
| Page: 1 2 3 4 5 |
Top |
Cell-cell communication analysis |
| Identification of potential cell-cell interactions between two cell types and their ligand-receptor pairs for different disease states |
| Ligand | Receptor | LRpair | Pathway | Tissue | Disease Stage |
| Page: 1 |
Top |
Single-cell gene regulatory network inference analysis |
| Find out the significant the regulons (TFs) and the target genes of each regulon across cell types for different disease states |
| TF | Cell Type | Tissue | Disease Stage | Target Gene | RSS | Regulon Activity |
| ∗The dot plots of a searched regulon are shown for all cell subpopulations in each disease state of each tissue based on the regulon specific score inferred using pySCENIC and by calculating the average expression. |
| Page: 1 |
Top |
Somatic mutation of malignant transformation related genes |
| Annotation of somatic variants for genes involved in malignant transformation |
| Hugo Symbol | Variant Class | Variant Classification | dbSNP RS | HGVSc | HGVSp | HGVSp Short | SWISSPROT | BIOTYPE | SIFT | PolyPhen | Tumor Sample Barcode | Tissue | Histology | Sex | Age | Stage | Therapy Types | Drugs | Outcome |
| CDKN2B | SNV | Missense_Mutation | c.82G>C | p.Glu28Gln | p.E28Q | P42772 | protein_coding | tolerated(0.41) | benign(0.218) | TCGA-Q1-A73O-01 | Cervix | cervical & endocervical cancer | Female | <65 | I/II | Chemotherapy | cisplatin | CR | |
| CDKN2B | SNV | Missense_Mutation | novel | c.209C>T | p.Ala70Val | p.A70V | P42772 | protein_coding | deleterious(0) | probably_damaging(0.999) | TCGA-AA-A022-01 | Colorectum | colon adenocarcinoma | Female | >=65 | I/II | Unknown | Unknown | SD |
| CDKN2B | SNV | Missense_Mutation | novel | c.24N>A | p.Met8Ile | p.M8I | P42772 | protein_coding | tolerated_low_confidence(0.36) | benign(0.01) | TCGA-AJ-A3BH-01 | Endometrium | uterine corpus endometrioid carcinoma | Female | Unknown | I/II | Unknown | Unknown | SD |
| CDKN2B | SNV | Missense_Mutation | novel | c.311N>T | p.Ala104Val | p.A104V | P42772 | protein_coding | deleterious(0) | possibly_damaging(0.694) | TCGA-E6-A1LX-01 | Endometrium | uterine corpus endometrioid carcinoma | Female | <65 | I/II | Unknown | Unknown | SD |
| CDKN2B | SNV | Missense_Mutation | c.367C>T | p.Arg123Trp | p.R123W | P42772 | protein_coding | deleterious(0.01) | possibly_damaging(0.683) | TCGA-E6-A2P8-01 | Endometrium | uterine corpus endometrioid carcinoma | Female | <65 | III/IV | Unknown | Unknown | PD | |
| CDKN2B | SNV | Missense_Mutation | novel | c.133N>A | p.Arg45Ser | p.R45S | P42772 | protein_coding | tolerated(0.53) | benign(0.009) | TCGA-2Y-A9H3-01 | Liver | liver hepatocellular carcinoma | Male | <65 | I/II | Unknown | Unknown | PD |
| CDKN2B | deletion | In_Frame_Del | novel | c.374_394delNNNNNNNNNNNNNNNNNNNNN | p.His125_Tyr131del | p.H125_Y131del | P42772 | protein_coding | TCGA-98-8021-01 | Lung | lung squamous cell carcinoma | Female | >=65 | I/II | Unknown | Unknown | PD | ||
| CDKN2B | SNV | Missense_Mutation | c.179N>A | p.Arg60His | p.R60H | P42772 | protein_coding | tolerated(0.09) | benign(0) | TCGA-VQ-A8P2-01 | Stomach | stomach adenocarcinoma | Male | >=65 | III/IV | Unspecific | Complete Response | ||
| CDKN2B | SNV | Missense_Mutation | novel | c.209C>T | p.Ala70Val | p.A70V | P42772 | protein_coding | deleterious(0) | probably_damaging(0.999) | TCGA-VQ-A91K-01 | Stomach | stomach adenocarcinoma | Male | >=65 | III/IV | Chemotherapy | fluorouracil | CR |
| Page: 1 |
Top |
Related drugs of malignant transformation related genes |
| Identification of chemicals and drugs interact with genes involved in malignant transfromation |
| (DGIdb 4.0) |
| Entrez ID | Symbol | Category | Interaction Types | Drug Claim Name | Drug Name | PMIDs |
| 1030 | CDKN2B | CLINICALLY ACTIONABLE, KINASE | PALBOCICLIB | PALBOCICLIB | 23898052 |
| Page: 1 |

Copyright 2023-Present -The University of Texas Health Science Center at Houston |