
|
|||||
|
 | |
| |
| |
| |
| |
| |
|
Gene: CDKN2AIPNL |
Gene summary for CDKN2AIPNL |
| Gene information | Species | Human | Gene symbol | CDKN2AIPNL | Gene ID | 91368 |
| Gene name | CDKN2A interacting protein N-terminal like | |
| Gene Alias | C2AIL | |
| Cytomap | 5q31.1 | |
| Gene Type | protein-coding | GO ID | GO:0005575 | UniProtAcc | Q96HQ2 |
Top |
Malignant transformation analysis |
| Identification of the aberrant gene expression in precancerous and cancerous lesions by comparing the gene expression of stem-like cells in diseased tissues with normal stem cells |
| Entrez ID | Symbol | Replicates | Species | Organ | Tissue | Adj P-value | Log2FC | Malignancy |
| 91368 | CDKN2AIPNL | LZE4T | Human | Esophagus | ESCC | 4.02e-11 | 1.98e-01 | 0.0811 |
| 91368 | CDKN2AIPNL | LZE7T | Human | Esophagus | ESCC | 1.07e-08 | 3.14e-01 | 0.0667 |
| 91368 | CDKN2AIPNL | LZE8T | Human | Esophagus | ESCC | 5.53e-07 | 2.01e-01 | 0.067 |
| 91368 | CDKN2AIPNL | LZE22T | Human | Esophagus | ESCC | 2.28e-08 | 4.37e-01 | 0.068 |
| 91368 | CDKN2AIPNL | LZE24T | Human | Esophagus | ESCC | 2.89e-17 | 4.08e-01 | 0.0596 |
| 91368 | CDKN2AIPNL | LZE6T | Human | Esophagus | ESCC | 1.36e-06 | 3.71e-01 | 0.0845 |
| 91368 | CDKN2AIPNL | P2T-E | Human | Esophagus | ESCC | 1.17e-36 | 6.65e-01 | 0.1177 |
| 91368 | CDKN2AIPNL | P4T-E | Human | Esophagus | ESCC | 4.25e-29 | 7.19e-01 | 0.1323 |
| 91368 | CDKN2AIPNL | P5T-E | Human | Esophagus | ESCC | 2.33e-31 | 7.08e-01 | 0.1327 |
| 91368 | CDKN2AIPNL | P8T-E | Human | Esophagus | ESCC | 2.00e-05 | 1.91e-01 | 0.0889 |
| 91368 | CDKN2AIPNL | P9T-E | Human | Esophagus | ESCC | 1.01e-15 | 2.55e-01 | 0.1131 |
| 91368 | CDKN2AIPNL | P10T-E | Human | Esophagus | ESCC | 1.37e-21 | 4.68e-01 | 0.116 |
| 91368 | CDKN2AIPNL | P11T-E | Human | Esophagus | ESCC | 2.15e-07 | 2.82e-01 | 0.1426 |
| 91368 | CDKN2AIPNL | P12T-E | Human | Esophagus | ESCC | 7.69e-26 | 4.50e-01 | 0.1122 |
| 91368 | CDKN2AIPNL | P15T-E | Human | Esophagus | ESCC | 1.85e-32 | 7.37e-01 | 0.1149 |
| 91368 | CDKN2AIPNL | P16T-E | Human | Esophagus | ESCC | 9.55e-26 | 4.80e-01 | 0.1153 |
| 91368 | CDKN2AIPNL | P17T-E | Human | Esophagus | ESCC | 5.05e-16 | 4.43e-01 | 0.1278 |
| 91368 | CDKN2AIPNL | P19T-E | Human | Esophagus | ESCC | 1.34e-05 | 7.60e-01 | 0.1662 |
| 91368 | CDKN2AIPNL | P20T-E | Human | Esophagus | ESCC | 1.40e-26 | 5.96e-01 | 0.1124 |
| 91368 | CDKN2AIPNL | P21T-E | Human | Esophagus | ESCC | 1.24e-38 | 6.77e-01 | 0.1617 |
| Page: 1 2 3 4 5 6 |
| Tissue | Expression Dynamics | Abbreviation |
| Esophagus | 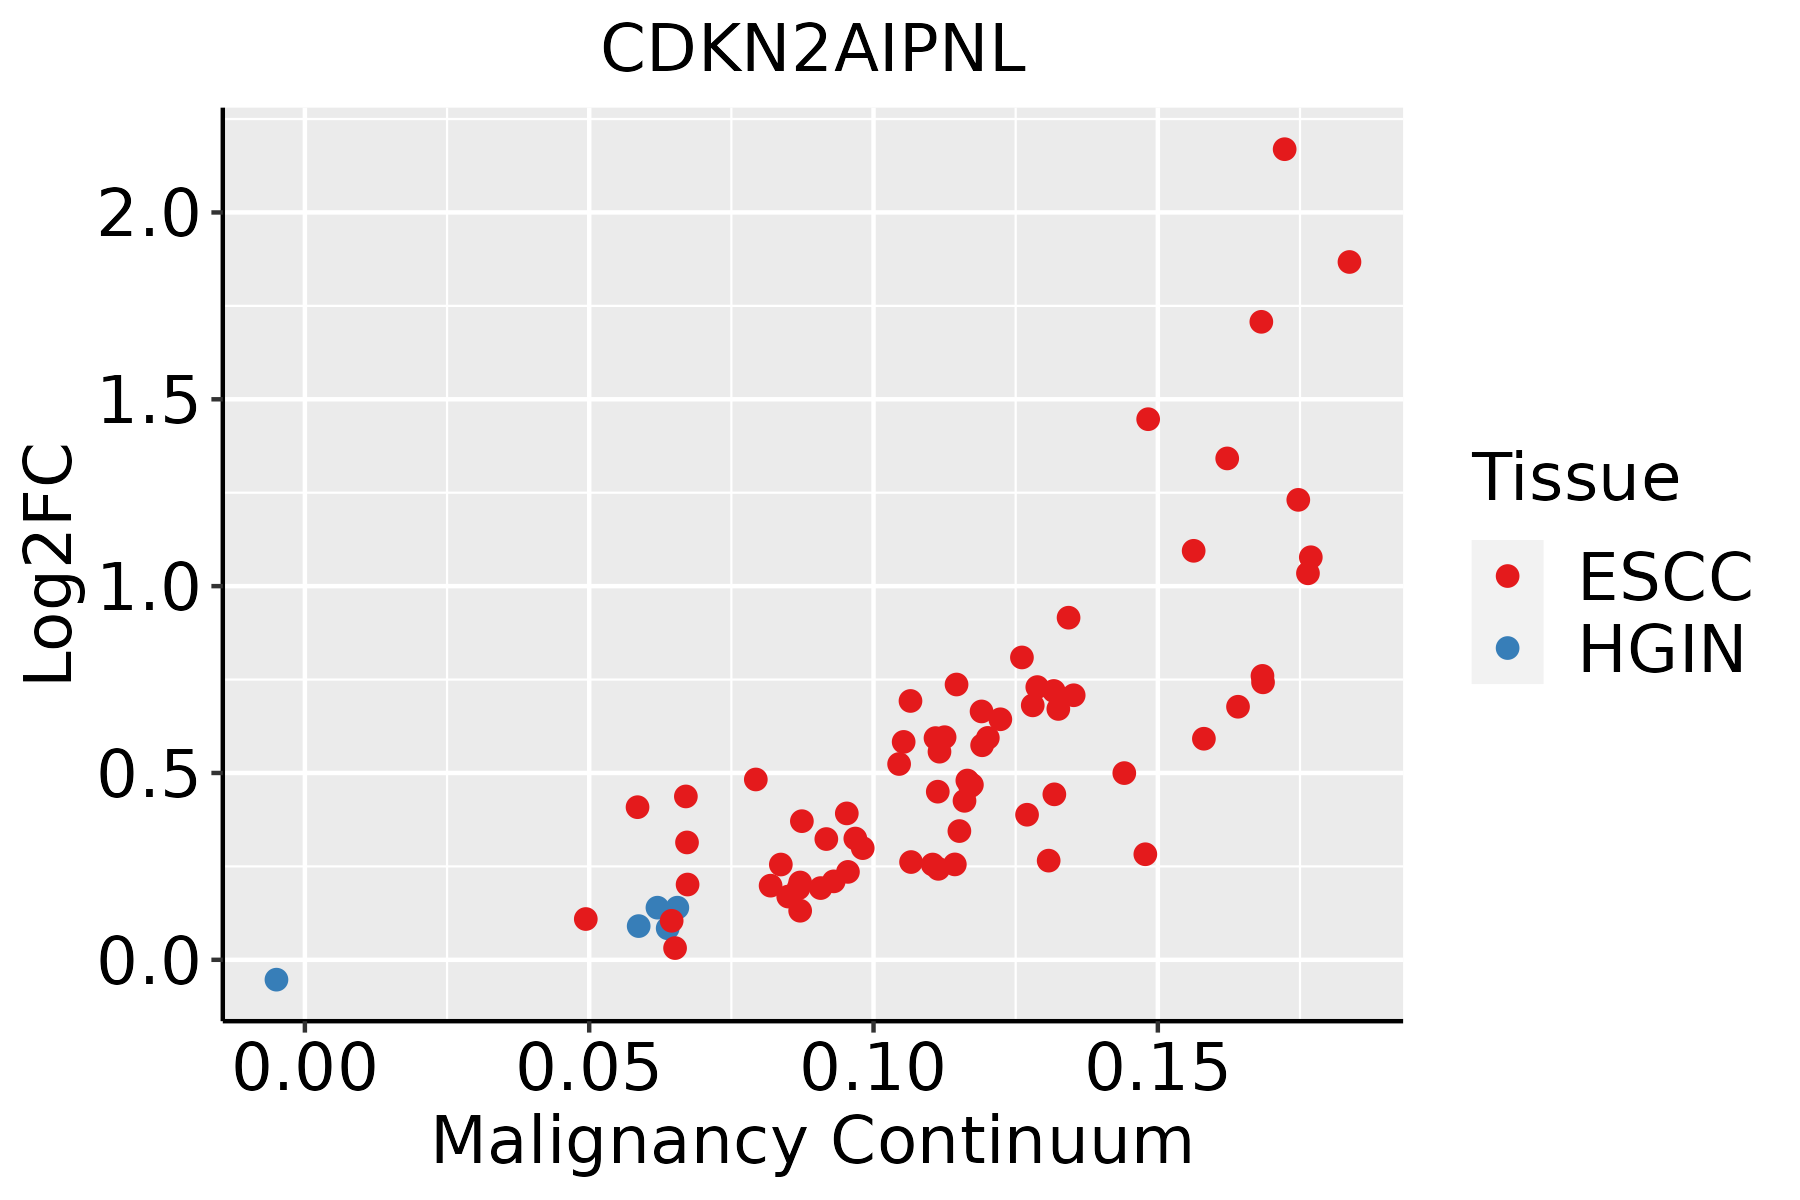 | ESCC: Esophageal squamous cell carcinoma |
| HGIN: High-grade intraepithelial neoplasias | ||
| LGIN: Low-grade intraepithelial neoplasias | ||
| Liver | 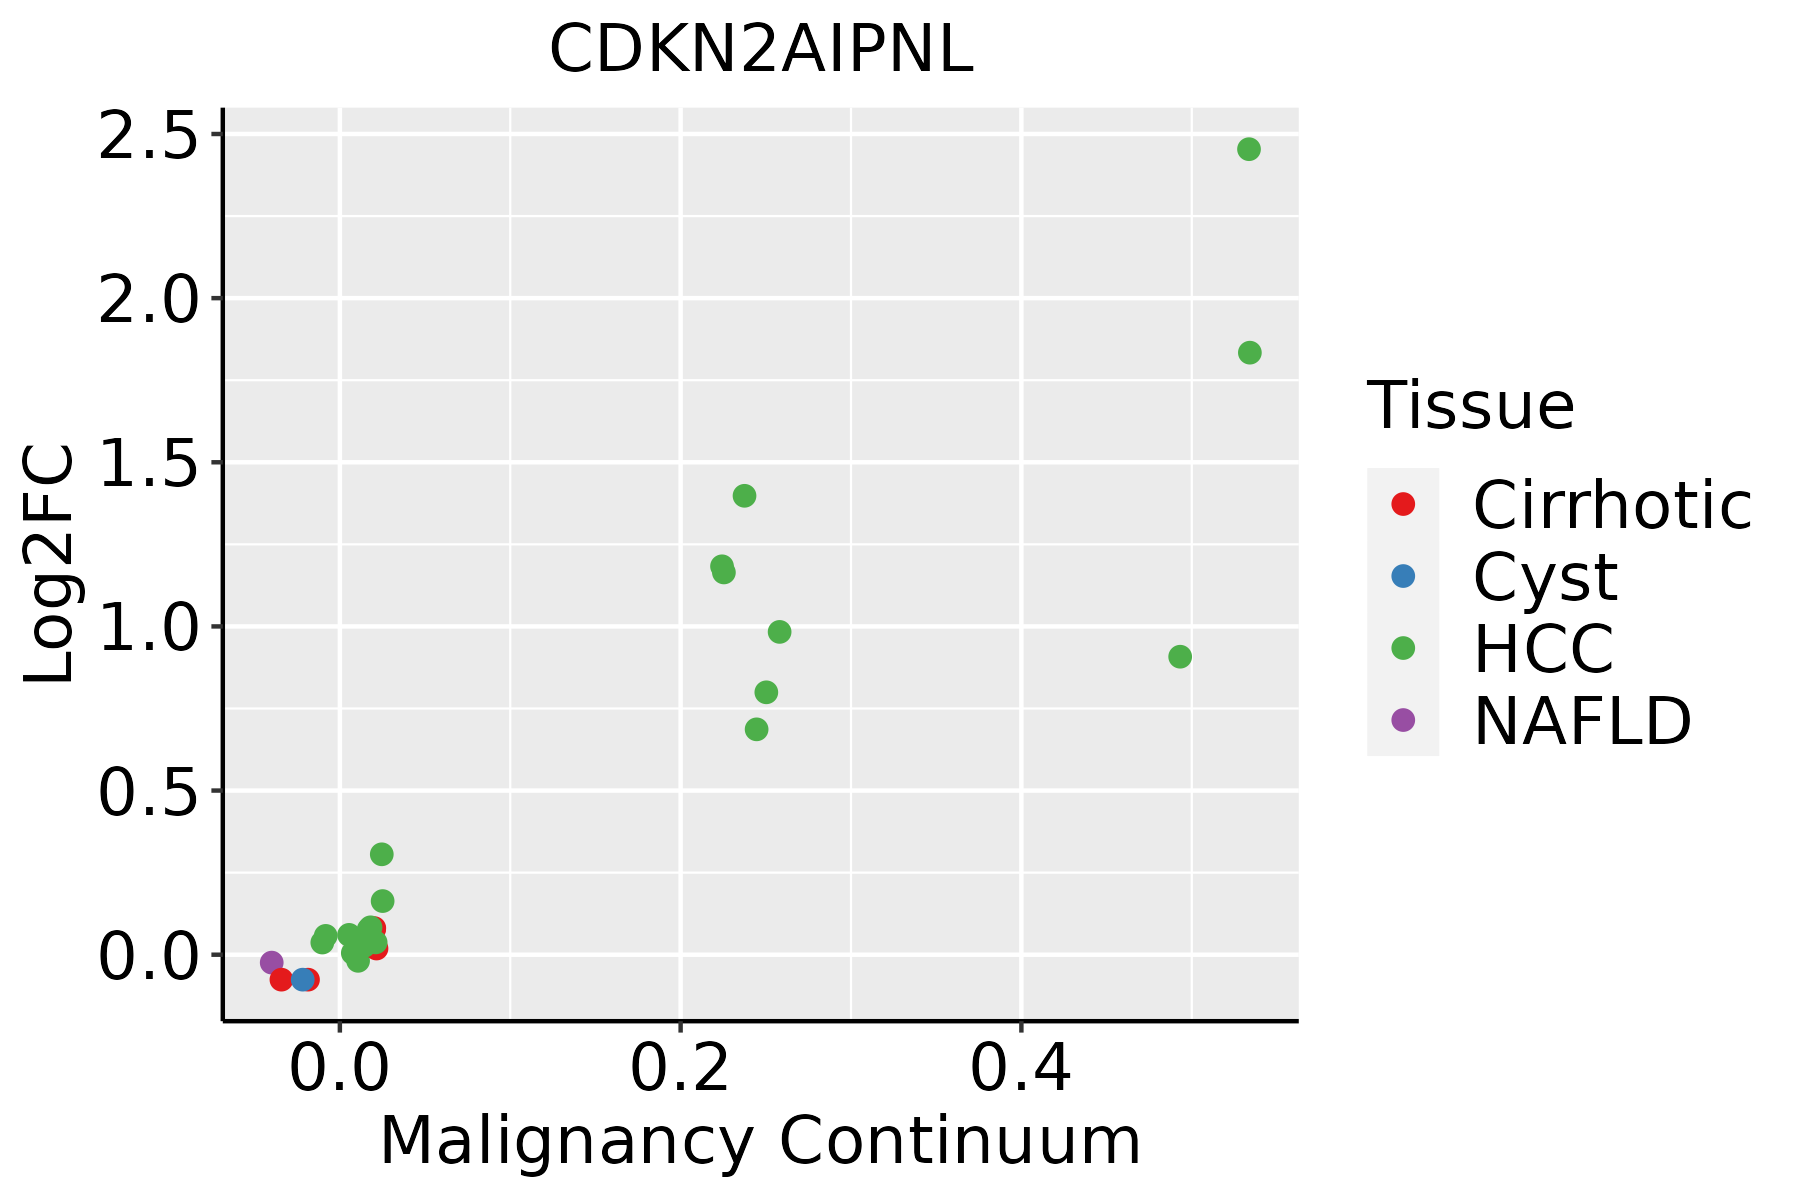 | HCC: Hepatocellular carcinoma |
| NAFLD: Non-alcoholic fatty liver disease | ||
| Oral Cavity | 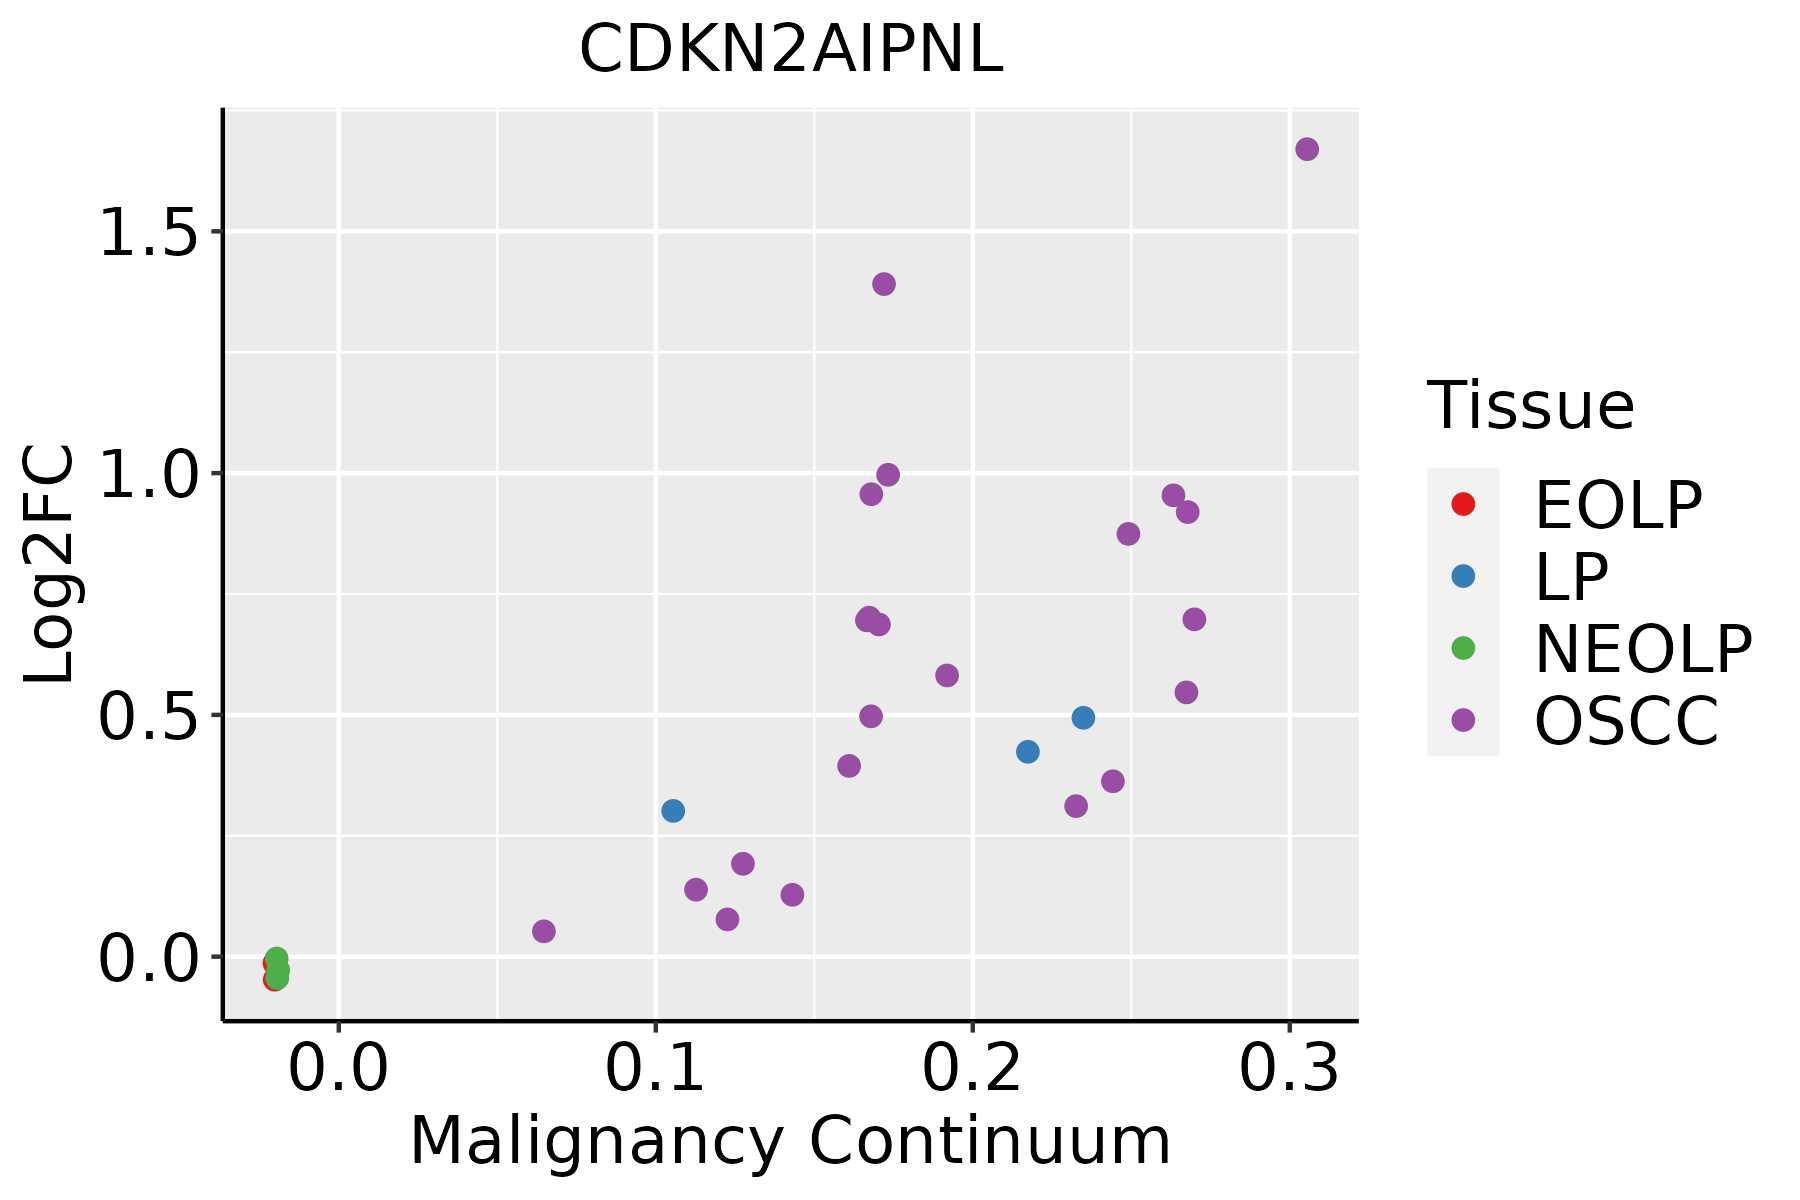 | EOLP: Erosive Oral lichen planus |
| LP: leukoplakia | ||
| NEOLP: Non-erosive oral lichen planus | ||
| OSCC: Oral squamous cell carcinoma | ||
| Skin | 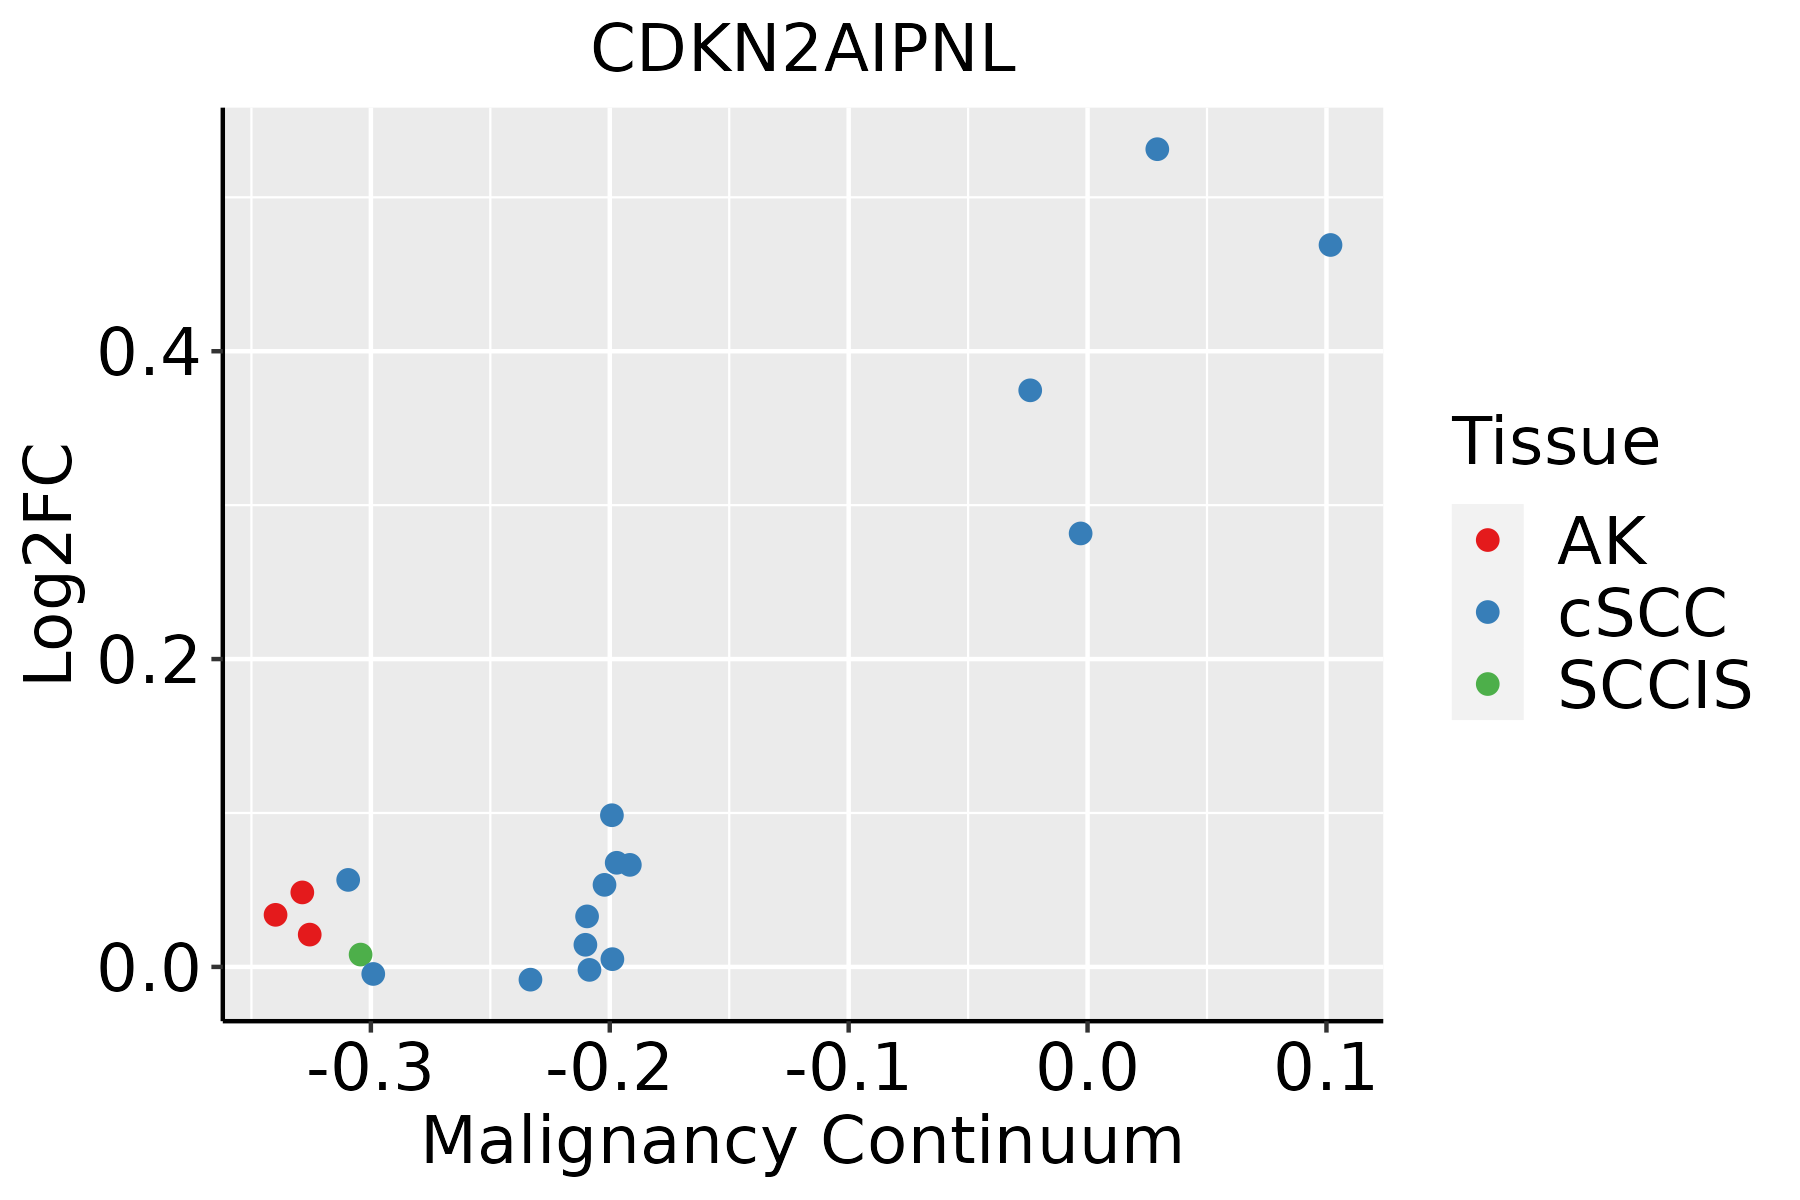 | AK: Actinic keratosis |
| cSCC: Cutaneous squamous cell carcinoma | ||
| SCCIS:squamous cell carcinoma in situ | ||
| Thyroid | 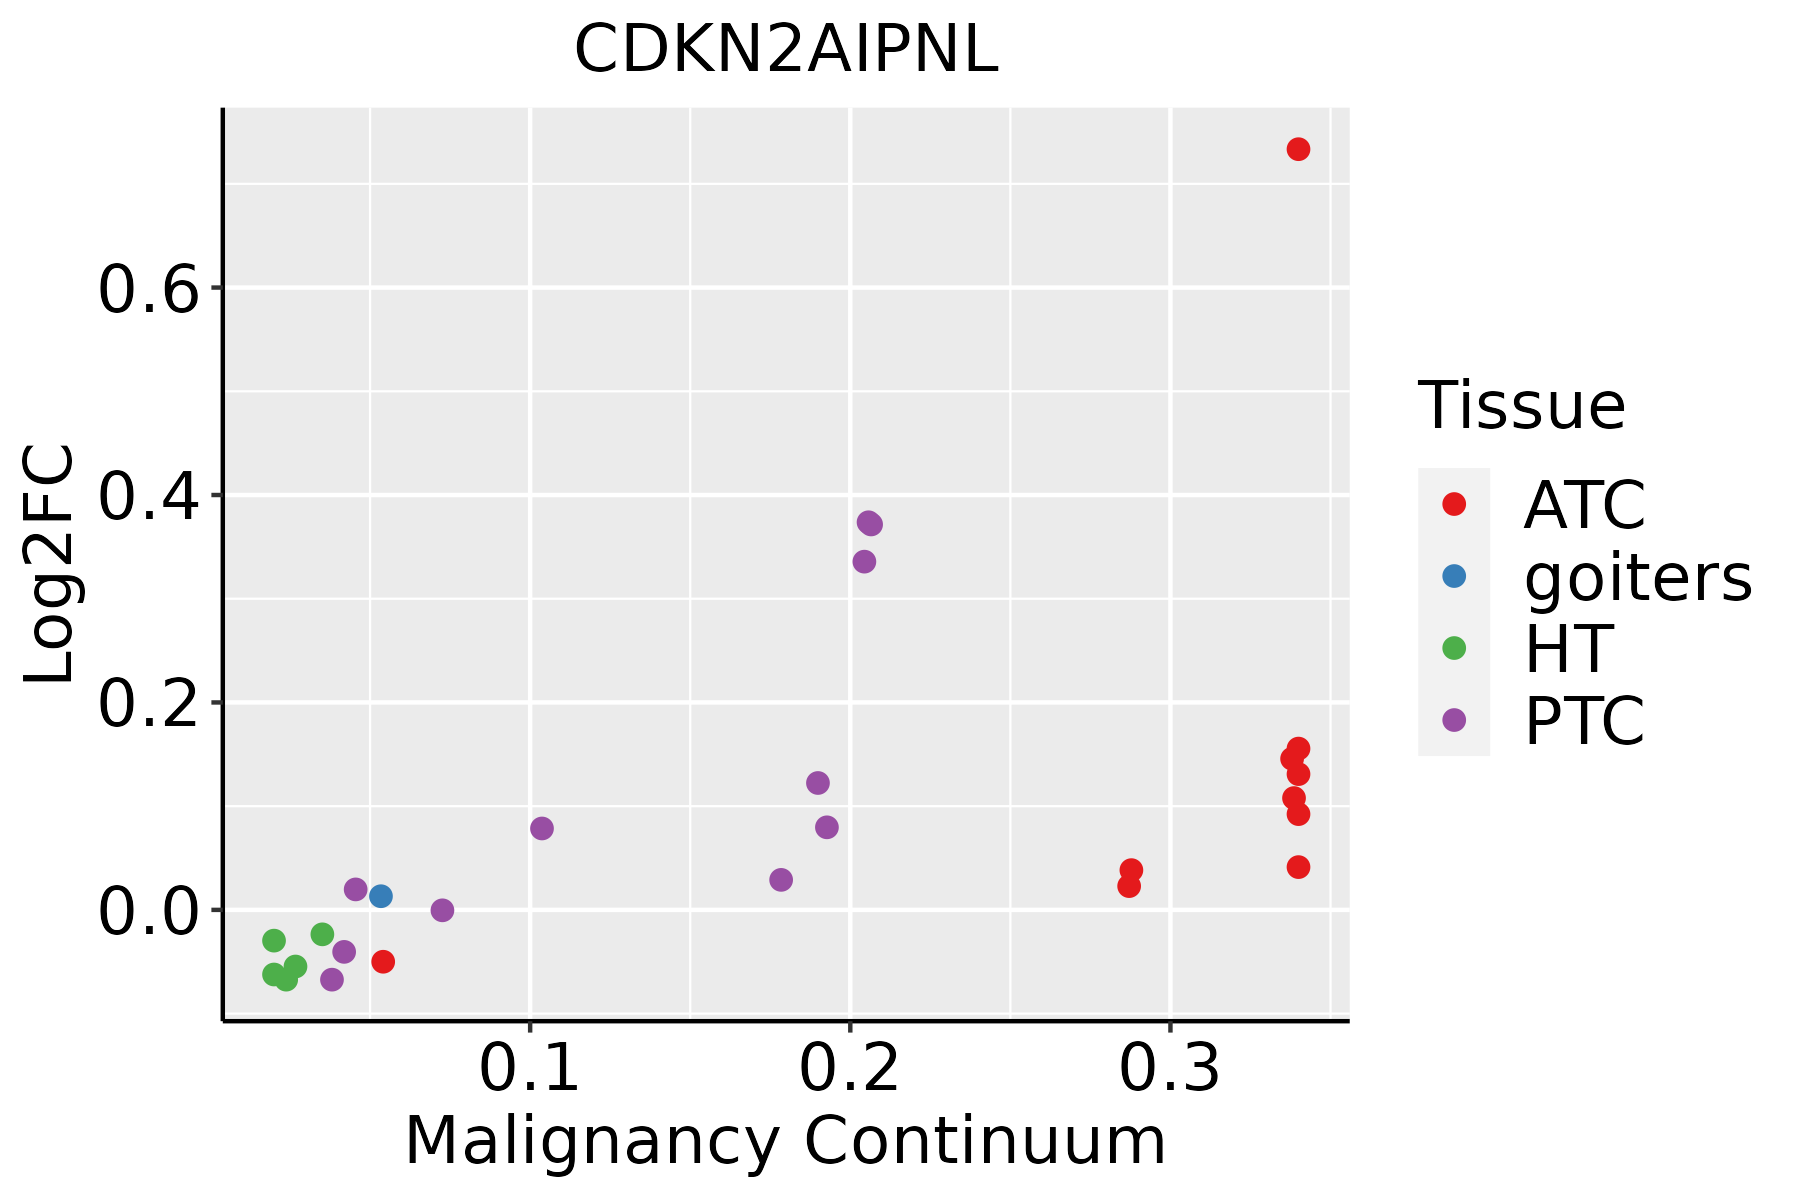 | ATC: Anaplastic thyroid cancer |
| HT: Hashimoto's thyroiditis | ||
| PTC: Papillary thyroid cancer |
| ∗log2FC in expression of this searched gene in stem-like cells from each diseased tissue sample relative to stem-like cells in normal samples in each tissue plotted against the malignancy continuum. Samples are colored based on if they are from different disease stage. |
Top |
Malignant transformation related pathway analysis |
| Find out the enriched GO biological processes and KEGG pathways involved in transition from healthy to precancer to cancer |
| Tissue | Disease Stage | Enriched GO biological Processes |
| Colorectum | AD |  |
| Colorectum | SER |  |
| Colorectum | MSS |  |
| Colorectum | MSI-H |  |
| Colorectum | FAP |  |
| ∗Top 15 enriched GO BP terms are showed in the bar plot of each disease state in each tissue. Each row represents a significant GO biological process which is colored according to the -log10(p.adjust). |
| Page: 1 2 3 4 5 6 7 8 9 |
| GO ID | Tissue | Disease Stage | Description | Gene Ratio | Bg Ratio | pvalue | p.adjust | Count |
| Page: 1 |
| Pathway ID | Tissue | Disease Stage | Description | Gene Ratio | Bg Ratio | pvalue | p.adjust | qvalue | Count |
| Page: 1 |
Top |
Cell-cell communication analysis |
| Identification of potential cell-cell interactions between two cell types and their ligand-receptor pairs for different disease states |
| Ligand | Receptor | LRpair | Pathway | Tissue | Disease Stage |
| Page: 1 |
Top |
Single-cell gene regulatory network inference analysis |
| Find out the significant the regulons (TFs) and the target genes of each regulon across cell types for different disease states |
| TF | Cell Type | Tissue | Disease Stage | Target Gene | RSS | Regulon Activity |
| ∗The dot plots of a searched regulon are shown for all cell subpopulations in each disease state of each tissue based on the regulon specific score inferred using pySCENIC and by calculating the average expression. |
| Page: 1 |
Top |
Somatic mutation of malignant transformation related genes |
| Annotation of somatic variants for genes involved in malignant transformation |
| Hugo Symbol | Variant Class | Variant Classification | dbSNP RS | HGVSc | HGVSp | HGVSp Short | SWISSPROT | BIOTYPE | SIFT | PolyPhen | Tumor Sample Barcode | Tissue | Histology | Sex | Age | Stage | Therapy Types | Drugs | Outcome |
| CDKN2AIPNL | SNV | Missense_Mutation | novel | c.145C>T | p.Pro49Ser | p.P49S | Q96HQ2 | protein_coding | tolerated(0.61) | benign(0.001) | TCGA-AX-A2HC-01 | Endometrium | uterine corpus endometrioid carcinoma | Female | <65 | III/IV | Chemotherapy | paclitaxel | PD |
| CDKN2AIPNL | SNV | Missense_Mutation | novel | c.126A>C | p.Glu42Asp | p.E42D | Q96HQ2 | protein_coding | tolerated(0.06) | probably_damaging(0.995) | TCGA-EO-A3AV-01 | Endometrium | uterine corpus endometrioid carcinoma | Female | <65 | III/IV | Chemotherapy | carboplatin | CR |
| CDKN2AIPNL | SNV | Missense_Mutation | c.118N>T | p.Arg40Cys | p.R40C | Q96HQ2 | protein_coding | deleterious(0) | possibly_damaging(0.871) | TCGA-CH-5771-01 | Prostate | prostate adenocarcinoma | Male | <65 | 7 | Unknown | Unknown | SD |
| Page: 1 |
Top |
Related drugs of malignant transformation related genes |
| Identification of chemicals and drugs interact with genes involved in malignant transfromation |
| (DGIdb 4.0) |
| Entrez ID | Symbol | Category | Interaction Types | Drug Claim Name | Drug Name | PMIDs |
| Page: 1 |

Copyright 2023-Present -The University of Texas Health Science Center at Houston |