
|
|||||
|
 | |
| |
| |
| |
| |
| |
|
Gene: CDKN2AIP |
Gene summary for CDKN2AIP |
| Gene information | Species | Human | Gene symbol | CDKN2AIP | Gene ID | 55602 |
| Gene name | CDKN2A interacting protein | |
| Gene Alias | CARF | |
| Cytomap | 4q35.1 | |
| Gene Type | protein-coding | GO ID | GO:0001558 | UniProtAcc | B3KTW3 |
Top |
Malignant transformation analysis |
| Identification of the aberrant gene expression in precancerous and cancerous lesions by comparing the gene expression of stem-like cells in diseased tissues with normal stem cells |
| Entrez ID | Symbol | Replicates | Species | Organ | Tissue | Adj P-value | Log2FC | Malignancy |
| 55602 | CDKN2AIP | LZE4T | Human | Esophagus | ESCC | 4.85e-08 | 4.13e-01 | 0.0811 |
| 55602 | CDKN2AIP | LZE5T | Human | Esophagus | ESCC | 2.62e-03 | 2.82e-01 | 0.0514 |
| 55602 | CDKN2AIP | LZE7T | Human | Esophagus | ESCC | 1.47e-06 | 2.89e-01 | 0.0667 |
| 55602 | CDKN2AIP | LZE8T | Human | Esophagus | ESCC | 3.22e-10 | 2.92e-01 | 0.067 |
| 55602 | CDKN2AIP | LZE20T | Human | Esophagus | ESCC | 2.08e-03 | -2.41e-02 | 0.0662 |
| 55602 | CDKN2AIP | LZE21D1 | Human | Esophagus | HGIN | 1.64e-04 | 2.53e-01 | 0.0632 |
| 55602 | CDKN2AIP | LZE22T | Human | Esophagus | ESCC | 8.06e-03 | 1.57e-01 | 0.068 |
| 55602 | CDKN2AIP | LZE24T | Human | Esophagus | ESCC | 5.64e-10 | 3.71e-01 | 0.0596 |
| 55602 | CDKN2AIP | LZE21T | Human | Esophagus | ESCC | 1.29e-05 | 3.89e-01 | 0.0655 |
| 55602 | CDKN2AIP | P1T-E | Human | Esophagus | ESCC | 5.35e-13 | 5.69e-01 | 0.0875 |
| 55602 | CDKN2AIP | P2T-E | Human | Esophagus | ESCC | 3.91e-29 | 6.77e-01 | 0.1177 |
| 55602 | CDKN2AIP | P4T-E | Human | Esophagus | ESCC | 6.06e-20 | 8.52e-01 | 0.1323 |
| 55602 | CDKN2AIP | P5T-E | Human | Esophagus | ESCC | 4.43e-14 | 2.91e-01 | 0.1327 |
| 55602 | CDKN2AIP | P8T-E | Human | Esophagus | ESCC | 2.33e-17 | 3.71e-01 | 0.0889 |
| 55602 | CDKN2AIP | P9T-E | Human | Esophagus | ESCC | 4.37e-09 | 2.31e-01 | 0.1131 |
| 55602 | CDKN2AIP | P10T-E | Human | Esophagus | ESCC | 7.71e-14 | 2.31e-01 | 0.116 |
| 55602 | CDKN2AIP | P11T-E | Human | Esophagus | ESCC | 5.99e-14 | 1.39e+00 | 0.1426 |
| 55602 | CDKN2AIP | P12T-E | Human | Esophagus | ESCC | 3.21e-45 | 8.31e-01 | 0.1122 |
| 55602 | CDKN2AIP | P15T-E | Human | Esophagus | ESCC | 3.67e-32 | 8.40e-01 | 0.1149 |
| 55602 | CDKN2AIP | P16T-E | Human | Esophagus | ESCC | 7.21e-35 | 9.18e-01 | 0.1153 |
| Page: 1 2 3 4 5 |
| Tissue | Expression Dynamics | Abbreviation |
| Esophagus | 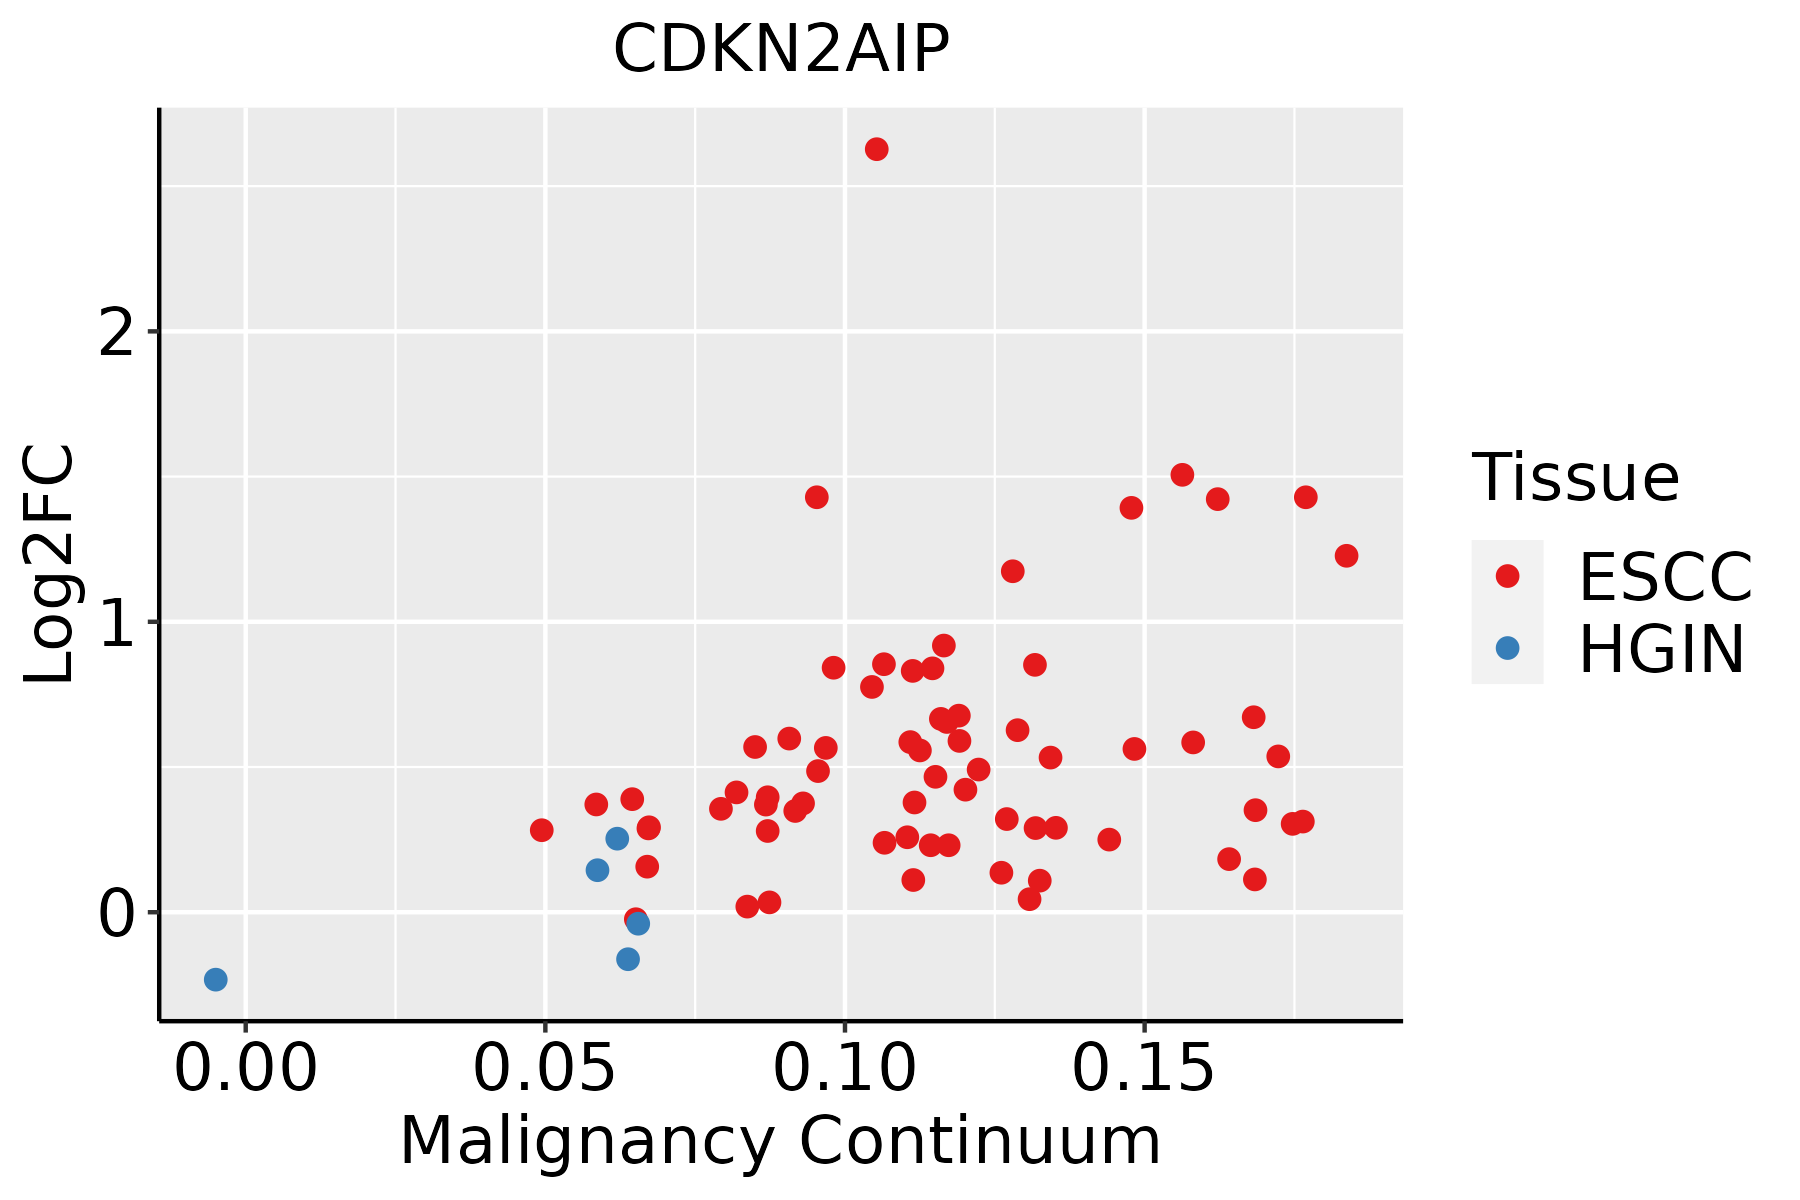 | ESCC: Esophageal squamous cell carcinoma |
| HGIN: High-grade intraepithelial neoplasias | ||
| LGIN: Low-grade intraepithelial neoplasias | ||
| Oral Cavity | 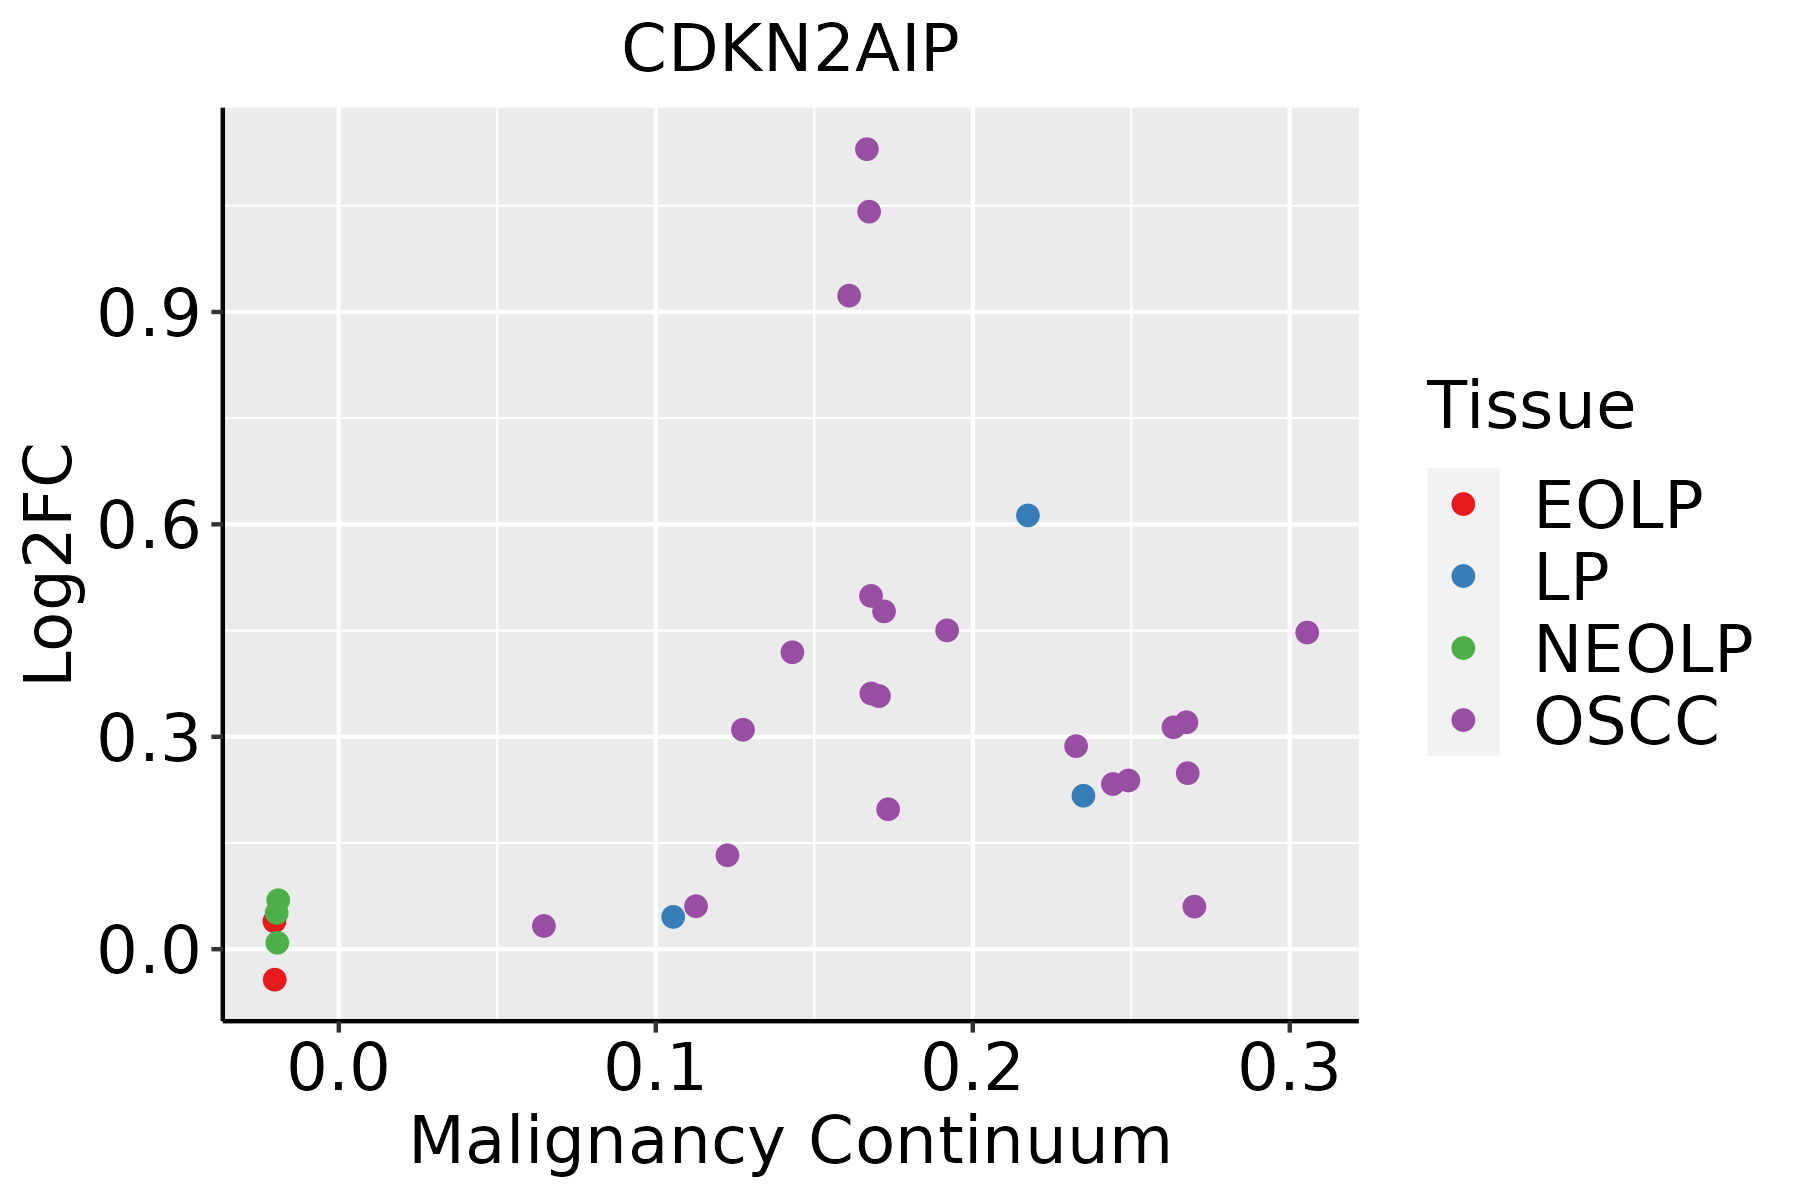 | EOLP: Erosive Oral lichen planus |
| LP: leukoplakia | ||
| NEOLP: Non-erosive oral lichen planus | ||
| OSCC: Oral squamous cell carcinoma | ||
| Prostate |  | BPH: Benign Prostatic Hyperplasia |
| ∗log2FC in expression of this searched gene in stem-like cells from each diseased tissue sample relative to stem-like cells in normal samples in each tissue plotted against the malignancy continuum. Samples are colored based on if they are from different disease stage. |
Top |
Malignant transformation related pathway analysis |
| Find out the enriched GO biological processes and KEGG pathways involved in transition from healthy to precancer to cancer |
| Tissue | Disease Stage | Enriched GO biological Processes |
| Colorectum | AD |  |
| Colorectum | SER |  |
| Colorectum | MSS |  |
| Colorectum | MSI-H |  |
| Colorectum | FAP |  |
| ∗Top 15 enriched GO BP terms are showed in the bar plot of each disease state in each tissue. Each row represents a significant GO biological process which is colored according to the -log10(p.adjust). |
| Page: 1 2 3 4 5 6 7 8 9 |
| GO ID | Tissue | Disease Stage | Description | Gene Ratio | Bg Ratio | pvalue | p.adjust | Count |
| GO:003164727 | Esophagus | HGIN | regulation of protein stability | 96/2587 | 298/18723 | 2.21e-16 | 5.76e-14 | 96 |
| GO:001604919 | Esophagus | HGIN | cell growth | 93/2587 | 482/18723 | 4.49e-04 | 6.62e-03 | 93 |
| GO:000155818 | Esophagus | HGIN | regulation of cell growth | 76/2587 | 414/18723 | 5.40e-03 | 4.42e-02 | 76 |
| GO:0031647111 | Esophagus | ESCC | regulation of protein stability | 223/8552 | 298/18723 | 5.76e-25 | 1.52e-22 | 223 |
| GO:0016049110 | Esophagus | ESCC | cell growth | 289/8552 | 482/18723 | 1.29e-10 | 3.77e-09 | 289 |
| GO:000155819 | Esophagus | ESCC | regulation of cell growth | 248/8552 | 414/18723 | 2.97e-09 | 6.45e-08 | 248 |
| GO:00459267 | Esophagus | ESCC | negative regulation of growth | 148/8552 | 249/18723 | 7.88e-06 | 7.73e-05 | 148 |
| GO:003030710 | Esophagus | ESCC | positive regulation of cell growth | 100/8552 | 166/18723 | 1.07e-04 | 7.55e-04 | 100 |
| GO:00303085 | Esophagus | ESCC | negative regulation of cell growth | 108/8552 | 188/18723 | 7.46e-04 | 3.87e-03 | 108 |
| GO:004592717 | Esophagus | ESCC | positive regulation of growth | 137/8552 | 259/18723 | 1.13e-02 | 3.80e-02 | 137 |
| GO:003164720 | Oral cavity | OSCC | regulation of protein stability | 193/7305 | 298/18723 | 1.30e-19 | 1.95e-17 | 193 |
| GO:001604917 | Oral cavity | OSCC | cell growth | 268/7305 | 482/18723 | 6.55e-14 | 3.51e-12 | 268 |
| GO:000155816 | Oral cavity | OSCC | regulation of cell growth | 228/7305 | 414/18723 | 1.74e-11 | 6.09e-10 | 228 |
| GO:00459266 | Oral cavity | OSCC | negative regulation of growth | 135/7305 | 249/18723 | 7.29e-07 | 1.03e-05 | 135 |
| GO:00303079 | Oral cavity | OSCC | positive regulation of cell growth | 92/7305 | 166/18723 | 1.27e-05 | 1.29e-04 | 92 |
| GO:00303084 | Oral cavity | OSCC | negative regulation of cell growth | 101/7305 | 188/18723 | 2.85e-05 | 2.63e-04 | 101 |
| GO:004592710 | Oral cavity | OSCC | positive regulation of growth | 125/7305 | 259/18723 | 1.44e-03 | 6.97e-03 | 125 |
| GO:003164718 | Prostate | BPH | regulation of protein stability | 111/3107 | 298/18723 | 4.58e-18 | 1.42e-15 | 111 |
| GO:001604910 | Prostate | BPH | cell growth | 139/3107 | 482/18723 | 7.53e-12 | 5.90e-10 | 139 |
| GO:000155810 | Prostate | BPH | regulation of cell growth | 116/3107 | 414/18723 | 2.66e-09 | 1.05e-07 | 116 |
| Page: 1 2 |
| Pathway ID | Tissue | Disease Stage | Description | Gene Ratio | Bg Ratio | pvalue | p.adjust | qvalue | Count |
| Page: 1 |
Top |
Cell-cell communication analysis |
| Identification of potential cell-cell interactions between two cell types and their ligand-receptor pairs for different disease states |
| Ligand | Receptor | LRpair | Pathway | Tissue | Disease Stage |
| Page: 1 |
Top |
Single-cell gene regulatory network inference analysis |
| Find out the significant the regulons (TFs) and the target genes of each regulon across cell types for different disease states |
| TF | Cell Type | Tissue | Disease Stage | Target Gene | RSS | Regulon Activity |
| ∗The dot plots of a searched regulon are shown for all cell subpopulations in each disease state of each tissue based on the regulon specific score inferred using pySCENIC and by calculating the average expression. |
| Page: 1 |
Top |
Somatic mutation of malignant transformation related genes |
| Annotation of somatic variants for genes involved in malignant transformation |
| Hugo Symbol | Variant Class | Variant Classification | dbSNP RS | HGVSc | HGVSp | HGVSp Short | SWISSPROT | BIOTYPE | SIFT | PolyPhen | Tumor Sample Barcode | Tissue | Histology | Sex | Age | Stage | Therapy Types | Drugs | Outcome |
| CDKN2AIP | SNV | Missense_Mutation | c.1106N>T | p.Ser369Leu | p.S369L | Q9NXV6 | protein_coding | deleterious(0) | benign(0.255) | TCGA-AN-A0AJ-01 | Breast | breast invasive carcinoma | Female | >=65 | I/II | Unknown | Unknown | SD | |
| CDKN2AIP | SNV | Missense_Mutation | c.839C>T | p.Ser280Leu | p.S280L | Q9NXV6 | protein_coding | tolerated(0.19) | benign(0) | TCGA-BH-A0BG-01 | Breast | breast invasive carcinoma | Female | >=65 | I/II | Unknown | Unknown | SD | |
| CDKN2AIP | SNV | Missense_Mutation | c.289A>T | p.Met97Leu | p.M97L | Q9NXV6 | protein_coding | deleterious(0.01) | possibly_damaging(0.66) | TCGA-E2-A15C-01 | Breast | breast invasive carcinoma | Female | <65 | I/II | Hormone Therapy | arimidex | SD | |
| CDKN2AIP | insertion | Frame_Shift_Ins | novel | c.1061_1062insAGTCCGTAATCAGACTGTTACTACC | p.Asn354LysfsTer54 | p.N354Kfs*54 | Q9NXV6 | protein_coding | TCGA-A2-A0EM-01 | Breast | breast invasive carcinoma | Female | >=65 | I/II | Hormone Therapy | tamoxiphen | SD | ||
| CDKN2AIP | insertion | Frame_Shift_Ins | novel | c.1200_1201insGGTAGAAGAGCCATCCAAAAAACGAGTTATAGAAGGAAAAAAC | p.Ser401GlyfsTer19 | p.S401Gfs*19 | Q9NXV6 | protein_coding | TCGA-A8-A07R-01 | Breast | breast invasive carcinoma | Female | >=65 | III/IV | Ancillary | zoledronic | SD | ||
| CDKN2AIP | SNV | Missense_Mutation | rs368122042 | c.974C>T | p.Ser325Leu | p.S325L | Q9NXV6 | protein_coding | deleterious(0.01) | benign(0.003) | TCGA-C5-A1M6-01 | Cervix | cervical & endocervical cancer | Female | <65 | I/II | Chemotherapy | cisplatin | PD |
| CDKN2AIP | SNV | Missense_Mutation | novel | c.601N>G | p.Ser201Gly | p.S201G | Q9NXV6 | protein_coding | tolerated(0.16) | benign(0.025) | TCGA-AA-A02J-01 | Colorectum | colon adenocarcinoma | Female | >=65 | III/IV | Unknown | Unknown | PD |
| CDKN2AIP | SNV | Missense_Mutation | rs772080485 | c.121N>T | p.Arg41Cys | p.R41C | Q9NXV6 | protein_coding | deleterious(0) | probably_damaging(0.92) | TCGA-AD-6895-01 | Colorectum | colon adenocarcinoma | Male | >=65 | III/IV | Unknown | Unknown | SD |
| CDKN2AIP | SNV | Missense_Mutation | c.547N>G | p.Ile183Val | p.I183V | Q9NXV6 | protein_coding | tolerated(0.29) | benign(0) | TCGA-CA-6717-01 | Colorectum | colon adenocarcinoma | Male | <65 | I/II | Chemotherapy | oxaliplatin | CR | |
| CDKN2AIP | SNV | Missense_Mutation | c.395N>C | p.Ser132Thr | p.S132T | Q9NXV6 | protein_coding | deleterious(0) | probably_damaging(0.918) | TCGA-D5-6927-01 | Colorectum | colon adenocarcinoma | Male | <65 | I/II | Unknown | Unknown | SD |
| Page: 1 2 3 4 |
Top |
Related drugs of malignant transformation related genes |
| Identification of chemicals and drugs interact with genes involved in malignant transfromation |
| (DGIdb 4.0) |
| Entrez ID | Symbol | Category | Interaction Types | Drug Claim Name | Drug Name | PMIDs |
| Page: 1 |

Copyright 2023-Present -The University of Texas Health Science Center at Houston |