
|
|||||
|
 | |
| |
| |
| |
| |
| |
|
Gene: CDKN1B |
Gene summary for CDKN1B |
| Gene information | Species | Human | Gene symbol | CDKN1B | Gene ID | 1027 |
| Gene name | cyclin dependent kinase inhibitor 1B | |
| Gene Alias | CDKN4 | |
| Cytomap | 12p13.1 | |
| Gene Type | protein-coding | GO ID | GO:0000003 | UniProtAcc | P46527 |
Top |
Malignant transformation analysis |
| Identification of the aberrant gene expression in precancerous and cancerous lesions by comparing the gene expression of stem-like cells in diseased tissues with normal stem cells |
| Entrez ID | Symbol | Replicates | Species | Organ | Tissue | Adj P-value | Log2FC | Malignancy |
| 1027 | CDKN1B | LZE2T | Human | Esophagus | ESCC | 9.39e-03 | 2.31e-01 | 0.082 |
| 1027 | CDKN1B | LZE4T | Human | Esophagus | ESCC | 9.07e-16 | 4.61e-01 | 0.0811 |
| 1027 | CDKN1B | LZE7T | Human | Esophagus | ESCC | 4.70e-11 | 7.82e-01 | 0.0667 |
| 1027 | CDKN1B | LZE8T | Human | Esophagus | ESCC | 3.05e-12 | 5.75e-01 | 0.067 |
| 1027 | CDKN1B | LZE22D1 | Human | Esophagus | HGIN | 2.41e-04 | 2.94e-01 | 0.0595 |
| 1027 | CDKN1B | LZE22T | Human | Esophagus | ESCC | 7.98e-05 | 5.64e-01 | 0.068 |
| 1027 | CDKN1B | LZE24T | Human | Esophagus | ESCC | 1.57e-22 | 6.61e-01 | 0.0596 |
| 1027 | CDKN1B | LZE21T | Human | Esophagus | ESCC | 3.95e-08 | 6.11e-01 | 0.0655 |
| 1027 | CDKN1B | LZE6T | Human | Esophagus | ESCC | 5.16e-05 | 4.48e-01 | 0.0845 |
| 1027 | CDKN1B | P1T-E | Human | Esophagus | ESCC | 4.74e-07 | 6.06e-01 | 0.0875 |
| 1027 | CDKN1B | P2T-E | Human | Esophagus | ESCC | 1.81e-75 | 1.55e+00 | 0.1177 |
| 1027 | CDKN1B | P4T-E | Human | Esophagus | ESCC | 1.26e-63 | 1.67e+00 | 0.1323 |
| 1027 | CDKN1B | P5T-E | Human | Esophagus | ESCC | 9.76e-22 | 3.36e-01 | 0.1327 |
| 1027 | CDKN1B | P8T-E | Human | Esophagus | ESCC | 3.58e-29 | 5.08e-01 | 0.0889 |
| 1027 | CDKN1B | P9T-E | Human | Esophagus | ESCC | 2.31e-22 | 4.41e-01 | 0.1131 |
| 1027 | CDKN1B | P10T-E | Human | Esophagus | ESCC | 3.72e-33 | 6.29e-01 | 0.116 |
| 1027 | CDKN1B | P11T-E | Human | Esophagus | ESCC | 8.69e-15 | 5.32e-01 | 0.1426 |
| 1027 | CDKN1B | P12T-E | Human | Esophagus | ESCC | 6.02e-73 | 1.51e+00 | 0.1122 |
| 1027 | CDKN1B | P15T-E | Human | Esophagus | ESCC | 2.80e-27 | 8.33e-01 | 0.1149 |
| 1027 | CDKN1B | P16T-E | Human | Esophagus | ESCC | 1.63e-113 | 2.68e+00 | 0.1153 |
| Page: 1 2 3 4 5 |
| Tissue | Expression Dynamics | Abbreviation |
| Esophagus | 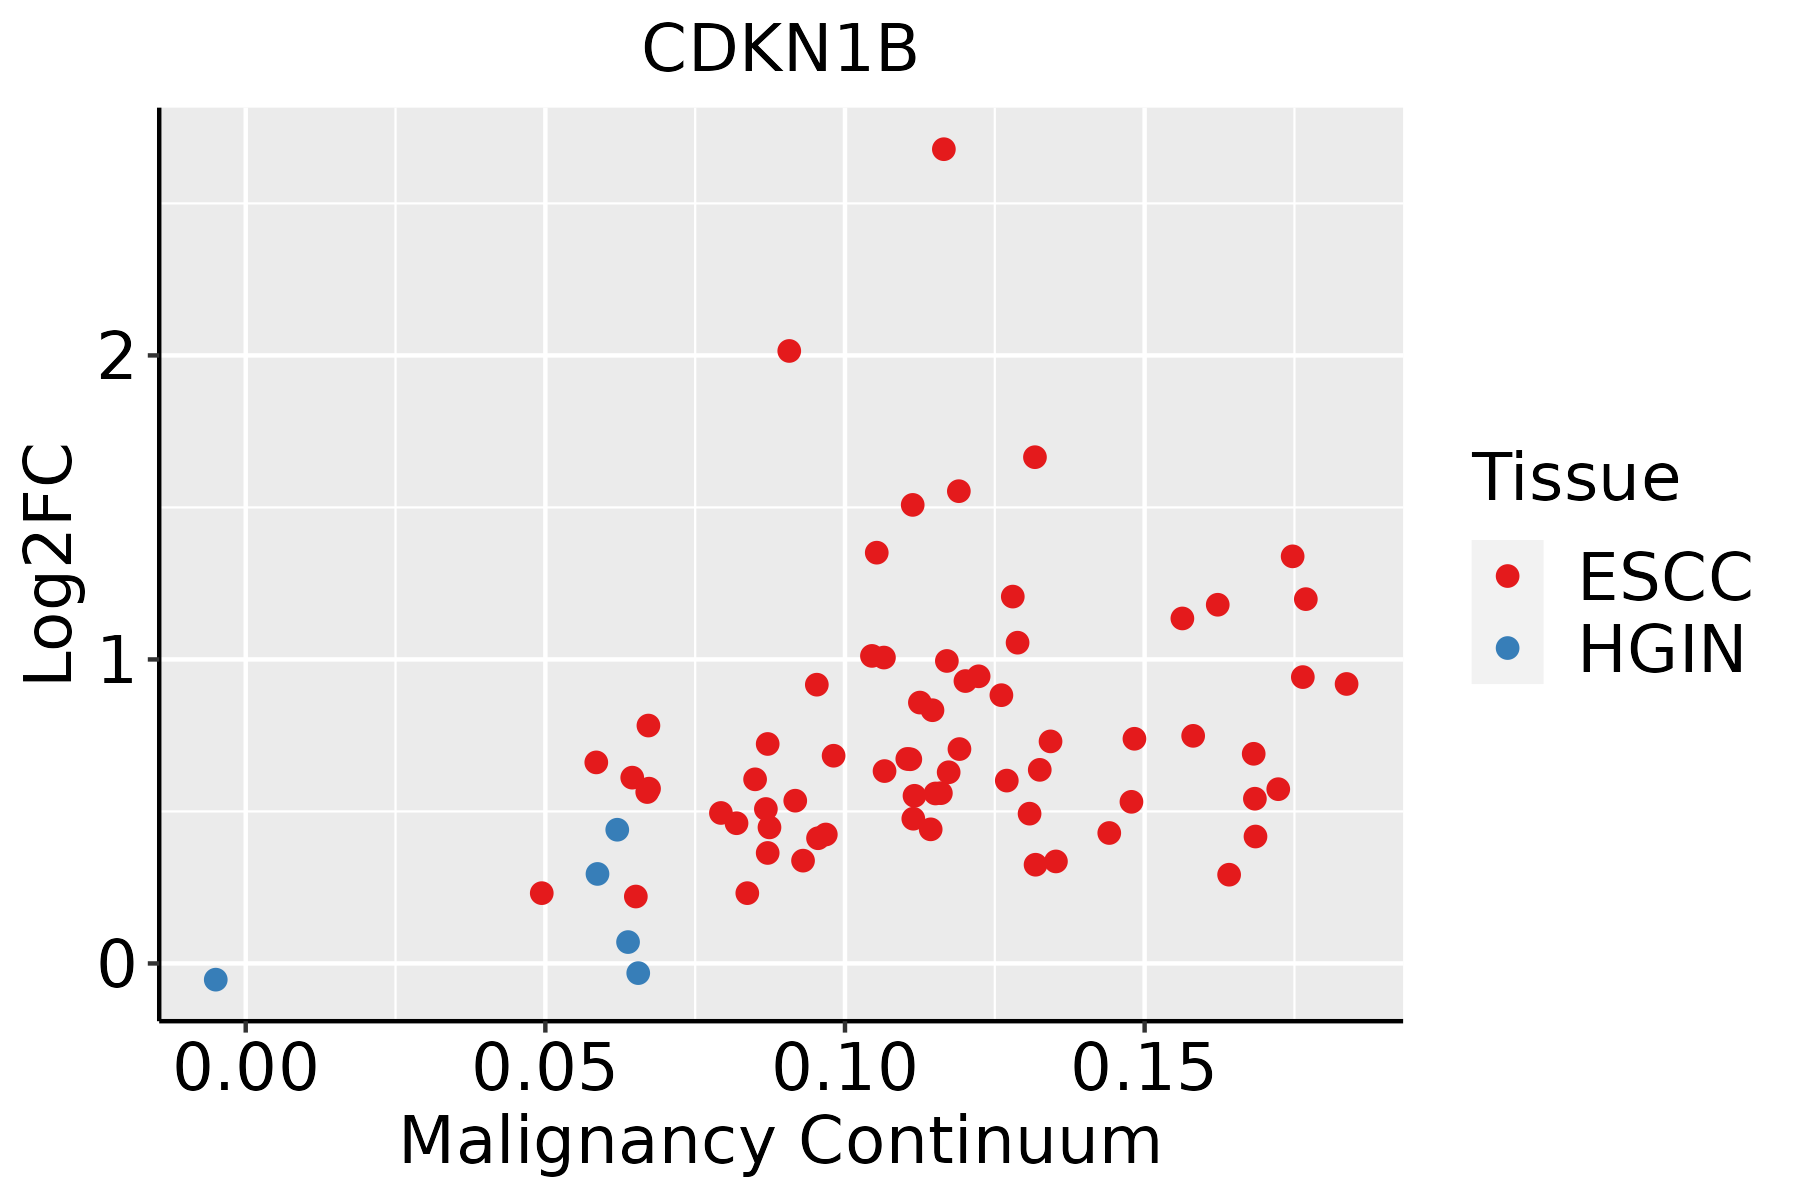 | ESCC: Esophageal squamous cell carcinoma |
| HGIN: High-grade intraepithelial neoplasias | ||
| LGIN: Low-grade intraepithelial neoplasias | ||
| Oral Cavity |  | EOLP: Erosive Oral lichen planus |
| LP: leukoplakia | ||
| NEOLP: Non-erosive oral lichen planus | ||
| OSCC: Oral squamous cell carcinoma | ||
| Prostate | 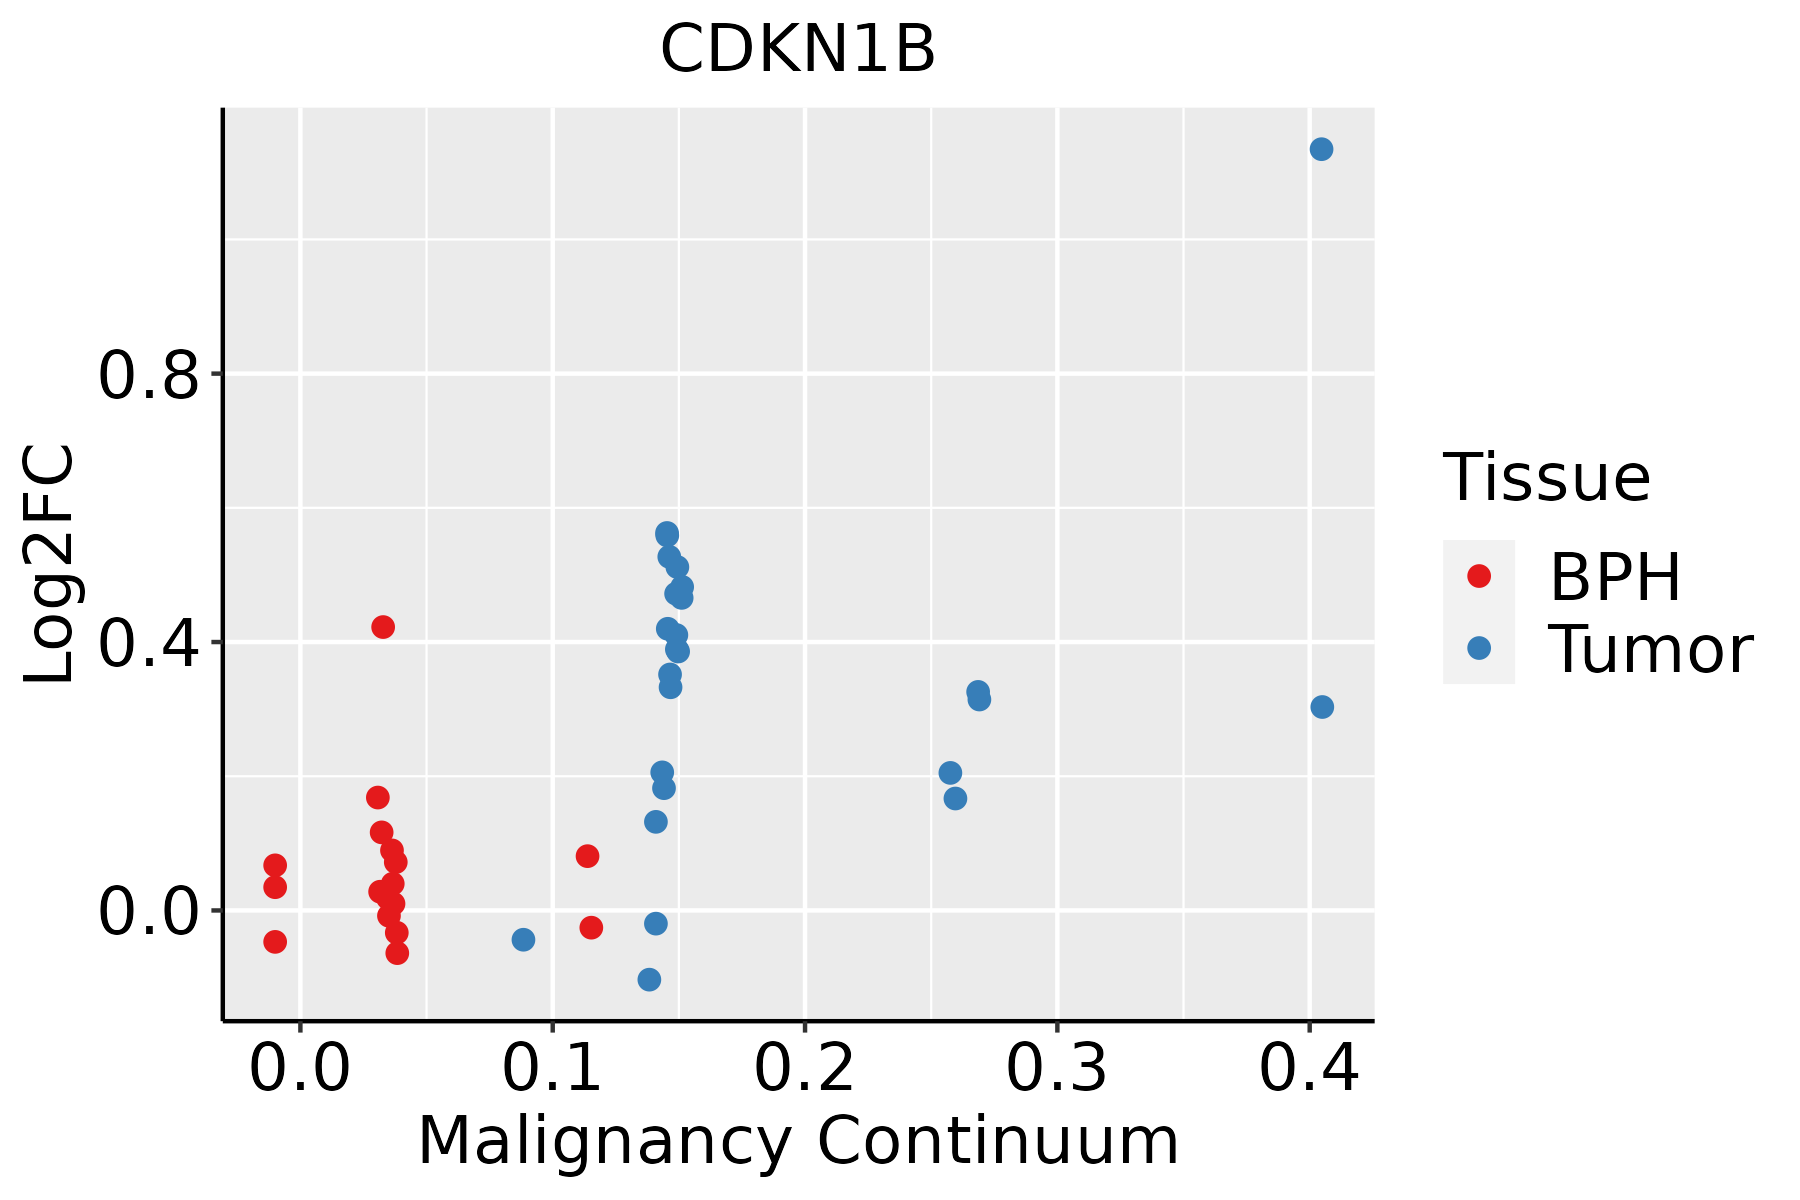 | BPH: Benign Prostatic Hyperplasia |
| ∗log2FC in expression of this searched gene in stem-like cells from each diseased tissue sample relative to stem-like cells in normal samples in each tissue plotted against the malignancy continuum. Samples are colored based on if they are from different disease stage. |
Top |
Malignant transformation related pathway analysis |
| Find out the enriched GO biological processes and KEGG pathways involved in transition from healthy to precancer to cancer |
| Tissue | Disease Stage | Enriched GO biological Processes |
| Colorectum | AD |  |
| Colorectum | SER |  |
| Colorectum | MSS |  |
| Colorectum | MSI-H |  |
| Colorectum | FAP |  |
| ∗Top 15 enriched GO BP terms are showed in the bar plot of each disease state in each tissue. Each row represents a significant GO biological process which is colored according to the -log10(p.adjust). |
| Page: 1 2 3 4 5 6 7 8 9 |
| GO ID | Tissue | Disease Stage | Description | Gene Ratio | Bg Ratio | pvalue | p.adjust | Count |
| GO:004217627 | Esophagus | HGIN | regulation of protein catabolic process | 119/2587 | 391/18723 | 8.09e-18 | 2.43e-15 | 119 |
| GO:000989626 | Esophagus | HGIN | positive regulation of catabolic process | 126/2587 | 492/18723 | 1.46e-12 | 2.09e-10 | 126 |
| GO:004573227 | Esophagus | HGIN | positive regulation of protein catabolic process | 69/2587 | 231/18723 | 1.66e-10 | 1.64e-08 | 69 |
| GO:007233127 | Esophagus | HGIN | signal transduction by p53 class mediator | 49/2587 | 163/18723 | 5.71e-08 | 3.06e-06 | 49 |
| GO:003133425 | Esophagus | HGIN | positive regulation of protein-containing complex assembly | 61/2587 | 237/18723 | 7.10e-07 | 3.00e-05 | 61 |
| GO:004325427 | Esophagus | HGIN | regulation of protein-containing complex assembly | 94/2587 | 428/18723 | 2.39e-06 | 8.55e-05 | 94 |
| GO:000734610 | Esophagus | HGIN | regulation of mitotic cell cycle | 98/2587 | 457/18723 | 4.39e-06 | 1.42e-04 | 98 |
| GO:003033020 | Esophagus | HGIN | DNA damage response, signal transduction by p53 class mediator | 24/2587 | 72/18723 | 2.03e-05 | 5.43e-04 | 24 |
| GO:007048220 | Esophagus | HGIN | response to oxygen levels | 76/2587 | 347/18723 | 2.36e-05 | 6.25e-04 | 76 |
| GO:00447729 | Esophagus | HGIN | mitotic cell cycle phase transition | 89/2587 | 424/18723 | 2.80e-05 | 7.21e-04 | 89 |
| GO:005125826 | Esophagus | HGIN | protein polymerization | 66/2587 | 297/18723 | 4.96e-05 | 1.19e-03 | 66 |
| GO:003629320 | Esophagus | HGIN | response to decreased oxygen levels | 70/2587 | 322/18723 | 6.23e-05 | 1.44e-03 | 70 |
| GO:000166620 | Esophagus | HGIN | response to hypoxia | 67/2587 | 307/18723 | 7.82e-05 | 1.75e-03 | 67 |
| GO:19019906 | Esophagus | HGIN | regulation of mitotic cell cycle phase transition | 65/2587 | 299/18723 | 1.12e-04 | 2.36e-03 | 65 |
| GO:004593626 | Esophagus | HGIN | negative regulation of phosphate metabolic process | 89/2587 | 441/18723 | 1.24e-04 | 2.54e-03 | 89 |
| GO:004873225 | Esophagus | HGIN | gland development | 88/2587 | 436/18723 | 1.34e-04 | 2.71e-03 | 88 |
| GO:001056326 | Esophagus | HGIN | negative regulation of phosphorus metabolic process | 89/2587 | 442/18723 | 1.34e-04 | 2.71e-03 | 89 |
| GO:190290327 | Esophagus | HGIN | regulation of supramolecular fiber organization | 79/2587 | 383/18723 | 1.40e-04 | 2.81e-03 | 79 |
| GO:20000456 | Esophagus | HGIN | regulation of G1/S transition of mitotic cell cycle | 36/2587 | 142/18723 | 1.74e-04 | 3.35e-03 | 36 |
| GO:004232620 | Esophagus | HGIN | negative regulation of phosphorylation | 78/2587 | 385/18723 | 2.77e-04 | 4.77e-03 | 78 |
| Page: 1 2 3 4 5 6 7 8 9 10 11 12 13 14 15 16 17 18 19 20 21 22 23 24 25 26 27 28 29 30 31 |
| Pathway ID | Tissue | Disease Stage | Description | Gene Ratio | Bg Ratio | pvalue | p.adjust | qvalue | Count |
| hsa0516930 | Esophagus | HGIN | Epstein-Barr virus infection | 55/1383 | 202/8465 | 5.13e-05 | 6.19e-04 | 4.92e-04 | 55 |
| hsa052039 | Esophagus | HGIN | Viral carcinogenesis | 53/1383 | 204/8465 | 2.58e-04 | 2.71e-03 | 2.15e-03 | 53 |
| hsa041109 | Esophagus | HGIN | Cell cycle | 38/1383 | 157/8465 | 6.70e-03 | 4.37e-02 | 3.47e-02 | 38 |
| hsa05169114 | Esophagus | HGIN | Epstein-Barr virus infection | 55/1383 | 202/8465 | 5.13e-05 | 6.19e-04 | 4.92e-04 | 55 |
| hsa0520315 | Esophagus | HGIN | Viral carcinogenesis | 53/1383 | 204/8465 | 2.58e-04 | 2.71e-03 | 2.15e-03 | 53 |
| hsa0411016 | Esophagus | HGIN | Cell cycle | 38/1383 | 157/8465 | 6.70e-03 | 4.37e-02 | 3.47e-02 | 38 |
| hsa0411023 | Esophagus | ESCC | Cell cycle | 126/4205 | 157/8465 | 1.34e-15 | 5.60e-14 | 2.87e-14 | 126 |
| hsa05169210 | Esophagus | ESCC | Epstein-Barr virus infection | 151/4205 | 202/8465 | 1.55e-13 | 3.45e-12 | 1.77e-12 | 151 |
| hsa0516510 | Esophagus | ESCC | Human papillomavirus infection | 215/4205 | 331/8465 | 7.86e-09 | 7.12e-08 | 3.65e-08 | 215 |
| hsa0522020 | Esophagus | ESCC | Chronic myeloid leukemia | 61/4205 | 76/8465 | 3.20e-08 | 2.68e-07 | 1.37e-07 | 61 |
| hsa0520325 | Esophagus | ESCC | Viral carcinogenesis | 137/4205 | 204/8465 | 2.47e-07 | 1.88e-06 | 9.62e-07 | 137 |
| hsa052229 | Esophagus | ESCC | Small cell lung cancer | 69/4205 | 92/8465 | 5.40e-07 | 3.85e-06 | 1.97e-06 | 69 |
| hsa0521516 | Esophagus | ESCC | Prostate cancer | 72/4205 | 97/8465 | 6.12e-07 | 4.10e-06 | 2.10e-06 | 72 |
| hsa0493310 | Esophagus | ESCC | AGE-RAGE signaling pathway in diabetic complications | 72/4205 | 100/8465 | 4.15e-06 | 2.28e-05 | 1.17e-05 | 72 |
| hsa040689 | Esophagus | ESCC | FoxO signaling pathway | 89/4205 | 131/8465 | 1.56e-05 | 7.98e-05 | 4.09e-05 | 89 |
| hsa0406629 | Esophagus | ESCC | HIF-1 signaling pathway | 75/4205 | 109/8465 | 3.66e-05 | 1.68e-04 | 8.60e-05 | 75 |
| hsa051629 | Esophagus | ESCC | Measles | 90/4205 | 139/8465 | 2.16e-04 | 7.87e-04 | 4.03e-04 | 90 |
| hsa0401218 | Esophagus | ESCC | ErbB signaling pathway | 56/4205 | 85/8465 | 1.78e-03 | 5.24e-03 | 2.68e-03 | 56 |
| hsa052028 | Esophagus | ESCC | Transcriptional misregulation in cancer | 116/4205 | 193/8465 | 2.08e-03 | 5.95e-03 | 3.05e-03 | 116 |
| hsa015227 | Esophagus | ESCC | Endocrine resistance | 63/4205 | 98/8465 | 2.38e-03 | 6.58e-03 | 3.37e-03 | 63 |
| Page: 1 2 3 4 5 6 7 8 9 |
Top |
Cell-cell communication analysis |
| Identification of potential cell-cell interactions between two cell types and their ligand-receptor pairs for different disease states |
| Ligand | Receptor | LRpair | Pathway | Tissue | Disease Stage |
| Page: 1 |
Top |
Single-cell gene regulatory network inference analysis |
| Find out the significant the regulons (TFs) and the target genes of each regulon across cell types for different disease states |
| TF | Cell Type | Tissue | Disease Stage | Target Gene | RSS | Regulon Activity |
| ∗The dot plots of a searched regulon are shown for all cell subpopulations in each disease state of each tissue based on the regulon specific score inferred using pySCENIC and by calculating the average expression. |
| Page: 1 |
Top |
Somatic mutation of malignant transformation related genes |
| Annotation of somatic variants for genes involved in malignant transformation |
| Hugo Symbol | Variant Class | Variant Classification | dbSNP RS | HGVSc | HGVSp | HGVSp Short | SWISSPROT | BIOTYPE | SIFT | PolyPhen | Tumor Sample Barcode | Tissue | Histology | Sex | Age | Stage | Therapy Types | Drugs | Outcome |
| CDKN1B | SNV | Missense_Mutation | novel | c.548C>T | p.Ser183Phe | p.S183F | P46527 | protein_coding | deleterious(0) | possibly_damaging(0.75) | TCGA-BH-A0C3-01 | Breast | breast invasive carcinoma | Female | <65 | I/II | Chemotherapy | adriamycin | PD |
| CDKN1B | insertion | Nonsense_Mutation | novel | c.460_461insTACAATCCCGGGAAAGAACAGAAAAGTAGAAAGG | p.Arg154LeufsTer10 | p.R154Lfs*10 | P46527 | protein_coding | TCGA-A2-A0CP-01 | Breast | breast invasive carcinoma | Female | <65 | I/II | Chemotherapy | cytoxan | SD | ||
| CDKN1B | insertion | Frame_Shift_Ins | novel | c.373_374insC | p.Glu126Ter | p.E126* | P46527 | protein_coding | TCGA-A2-A0CS-01 | Breast | breast invasive carcinoma | Female | >=65 | III/IV | Hormone Therapy | anastrozole | SD | ||
| CDKN1B | deletion | Frame_Shift_Del | c.402delN | p.Thr135LeufsTer10 | p.T135Lfs*10 | P46527 | protein_coding | TCGA-A8-A092-01 | Breast | breast invasive carcinoma | Female | <65 | III/IV | Chemotherapy | paclitaxel | CR | |||
| CDKN1B | insertion | Frame_Shift_Ins | novel | c.233_234insGG | p.Val79GlyfsTer41 | p.V79Gfs*41 | P46527 | protein_coding | TCGA-AQ-A1H3-01 | Breast | breast invasive carcinoma | Female | <65 | III/IV | Chemotherapy | adriamycin | SD | ||
| CDKN1B | insertion | Frame_Shift_Ins | novel | c.164_165dupCG | p.Ser56ArgfsTer16 | p.S56Rfs*16 | P46527 | protein_coding | TCGA-BH-A1FJ-01 | Breast | breast invasive carcinoma | Female | >=65 | III/IV | Unknown | Unknown | SD | ||
| CDKN1B | SNV | Missense_Mutation | novel | c.436G>A | p.Glu146Lys | p.E146K | P46527 | protein_coding | deleterious(0.02) | benign(0.211) | TCGA-C5-A8YQ-01 | Cervix | cervical & endocervical cancer | Female | >=65 | I/II | Chemotherapy | cisplatin | PD |
| CDKN1B | SNV | Missense_Mutation | c.215N>A | p.Gly72Asp | p.G72D | P46527 | protein_coding | tolerated(0.05) | probably_damaging(0.993) | TCGA-A6-6653-01 | Colorectum | colon adenocarcinoma | Male | >=65 | I/II | Unknown | Unknown | SD | |
| CDKN1B | deletion | Frame_Shift_Del | c.410delC | p.Pro137ArgfsTer8 | p.P137Rfs*8 | P46527 | protein_coding | TCGA-AA-3693-01 | Colorectum | colon adenocarcinoma | Female | >=65 | III/IV | Unknown | Unknown | SD | |||
| CDKN1B | insertion | Frame_Shift_Ins | novel | c.212_213insG | p.Lys73GlnfsTer52 | p.K73Qfs*52 | P46527 | protein_coding | TCGA-CK-4952-01 | Colorectum | colon adenocarcinoma | Female | <65 | III/IV | Unknown | Unknown | SD |
| Page: 1 2 3 4 |
Top |
Related drugs of malignant transformation related genes |
| Identification of chemicals and drugs interact with genes involved in malignant transfromation |
| (DGIdb 4.0) |
| Entrez ID | Symbol | Category | Interaction Types | Drug Claim Name | Drug Name | PMIDs |
| 1027 | CDKN1B | DRUG RESISTANCE, TUMOR SUPPRESSOR, CLINICALLY ACTIONABLE, KINASE | TCDD | 12883080 | ||
| 1027 | CDKN1B | DRUG RESISTANCE, TUMOR SUPPRESSOR, CLINICALLY ACTIONABLE, KINASE | ANTIESTROGEN | 10908655 | ||
| 1027 | CDKN1B | DRUG RESISTANCE, TUMOR SUPPRESSOR, CLINICALLY ACTIONABLE, KINASE | ERYTHROPOIETIN | EPOETIN BETA | 11023508 | |
| 1027 | CDKN1B | DRUG RESISTANCE, TUMOR SUPPRESSOR, CLINICALLY ACTIONABLE, KINASE | METHOTREXATE | METHOTREXATE | 14512390 | |
| 1027 | CDKN1B | DRUG RESISTANCE, TUMOR SUPPRESSOR, CLINICALLY ACTIONABLE, KINASE | PROGESTIN | PROGESTERONE | 11590147 | |
| 1027 | CDKN1B | DRUG RESISTANCE, TUMOR SUPPRESSOR, CLINICALLY ACTIONABLE, KINASE | DOXORUBICIN | DOXORUBICIN | 12576455 | |
| 1027 | CDKN1B | DRUG RESISTANCE, TUMOR SUPPRESSOR, CLINICALLY ACTIONABLE, KINASE | IMMUNOSUPPRESSIVE | 17015702 | ||
| 1027 | CDKN1B | DRUG RESISTANCE, TUMOR SUPPRESSOR, CLINICALLY ACTIONABLE, KINASE | PD-98059 | CHEMBL35482 | 11031257 | |
| 1027 | CDKN1B | DRUG RESISTANCE, TUMOR SUPPRESSOR, CLINICALLY ACTIONABLE, KINASE | AMINOGLYCOSIDES | 10900094 | ||
| 1027 | CDKN1B | DRUG RESISTANCE, TUMOR SUPPRESSOR, CLINICALLY ACTIONABLE, KINASE | ATRA | TRETINOIN | 10837916 |
| Page: 1 2 |

Copyright 2023-Present -The University of Texas Health Science Center at Houston |