
|
|||||
|
 | |
| |
| |
| |
| |
| |
|
Gene: CDKAL1 |
Gene summary for CDKAL1 |
| Gene information | Species | Human | Gene symbol | CDKAL1 | Gene ID | 54901 |
| Gene name | CDK5 regulatory subunit associated protein 1 like 1 | |
| Gene Alias | CDKAL1 | |
| Cytomap | 6p22.3 | |
| Gene Type | protein-coding | GO ID | GO:0006139 | UniProtAcc | Q5VV42 |
Top |
Malignant transformation analysis |
| Identification of the aberrant gene expression in precancerous and cancerous lesions by comparing the gene expression of stem-like cells in diseased tissues with normal stem cells |
| Entrez ID | Symbol | Replicates | Species | Organ | Tissue | Adj P-value | Log2FC | Malignancy |
| 54901 | CDKAL1 | CCI_1 | Human | Cervix | CC | 4.58e-12 | 1.31e+00 | 0.528 |
| 54901 | CDKAL1 | CCI_2 | Human | Cervix | CC | 6.15e-11 | 1.05e+00 | 0.5249 |
| 54901 | CDKAL1 | CCI_3 | Human | Cervix | CC | 1.94e-18 | 9.83e-01 | 0.516 |
| 54901 | CDKAL1 | CCII_1 | Human | Cervix | CC | 7.01e-05 | 3.45e-01 | 0.3249 |
| 54901 | CDKAL1 | HTA11_3410_2000001011 | Human | Colorectum | AD | 5.22e-09 | -5.10e-01 | 0.0155 |
| 54901 | CDKAL1 | HTA11_2487_2000001011 | Human | Colorectum | SER | 2.74e-04 | -5.22e-01 | -0.1808 |
| 54901 | CDKAL1 | HTA11_2112_2000001011 | Human | Colorectum | SER | 4.36e-04 | -7.22e-01 | -0.2196 |
| 54901 | CDKAL1 | HTA11_3361_2000001011 | Human | Colorectum | AD | 2.76e-04 | -5.28e-01 | -0.1207 |
| 54901 | CDKAL1 | HTA11_696_2000001011 | Human | Colorectum | AD | 2.50e-02 | -3.08e-01 | -0.1464 |
| 54901 | CDKAL1 | HTA11_5212_2000001011 | Human | Colorectum | AD | 4.63e-04 | -6.58e-01 | -0.2061 |
| 54901 | CDKAL1 | HTA11_7862_2000001011 | Human | Colorectum | AD | 2.91e-03 | -4.10e-01 | -0.0179 |
| 54901 | CDKAL1 | HTA11_866_3004761011 | Human | Colorectum | AD | 9.69e-03 | -4.12e-01 | 0.096 |
| 54901 | CDKAL1 | HTA11_8622_2000001021 | Human | Colorectum | SER | 3.97e-06 | -7.15e-01 | 0.0528 |
| 54901 | CDKAL1 | HTA11_7696_3000711011 | Human | Colorectum | AD | 1.38e-13 | -5.11e-01 | 0.0674 |
| 54901 | CDKAL1 | HTA11_99999970781_79442 | Human | Colorectum | MSS | 2.95e-04 | -3.27e-01 | 0.294 |
| 54901 | CDKAL1 | HTA11_99999965062_69753 | Human | Colorectum | MSI-H | 3.32e-16 | 2.82e+00 | 0.3487 |
| 54901 | CDKAL1 | HTA11_99999965104_69814 | Human | Colorectum | MSS | 5.00e-06 | 7.21e-01 | 0.281 |
| 54901 | CDKAL1 | HTA11_99999974143_84620 | Human | Colorectum | MSS | 9.74e-08 | -4.65e-01 | 0.3005 |
| 54901 | CDKAL1 | F007 | Human | Colorectum | FAP | 2.17e-02 | -4.56e-02 | 0.1176 |
| 54901 | CDKAL1 | A001-C-207 | Human | Colorectum | FAP | 5.93e-03 | -1.03e-01 | 0.1278 |
| Page: 1 2 3 4 5 6 7 8 9 10 |
| Tissue | Expression Dynamics | Abbreviation |
| Cervix | 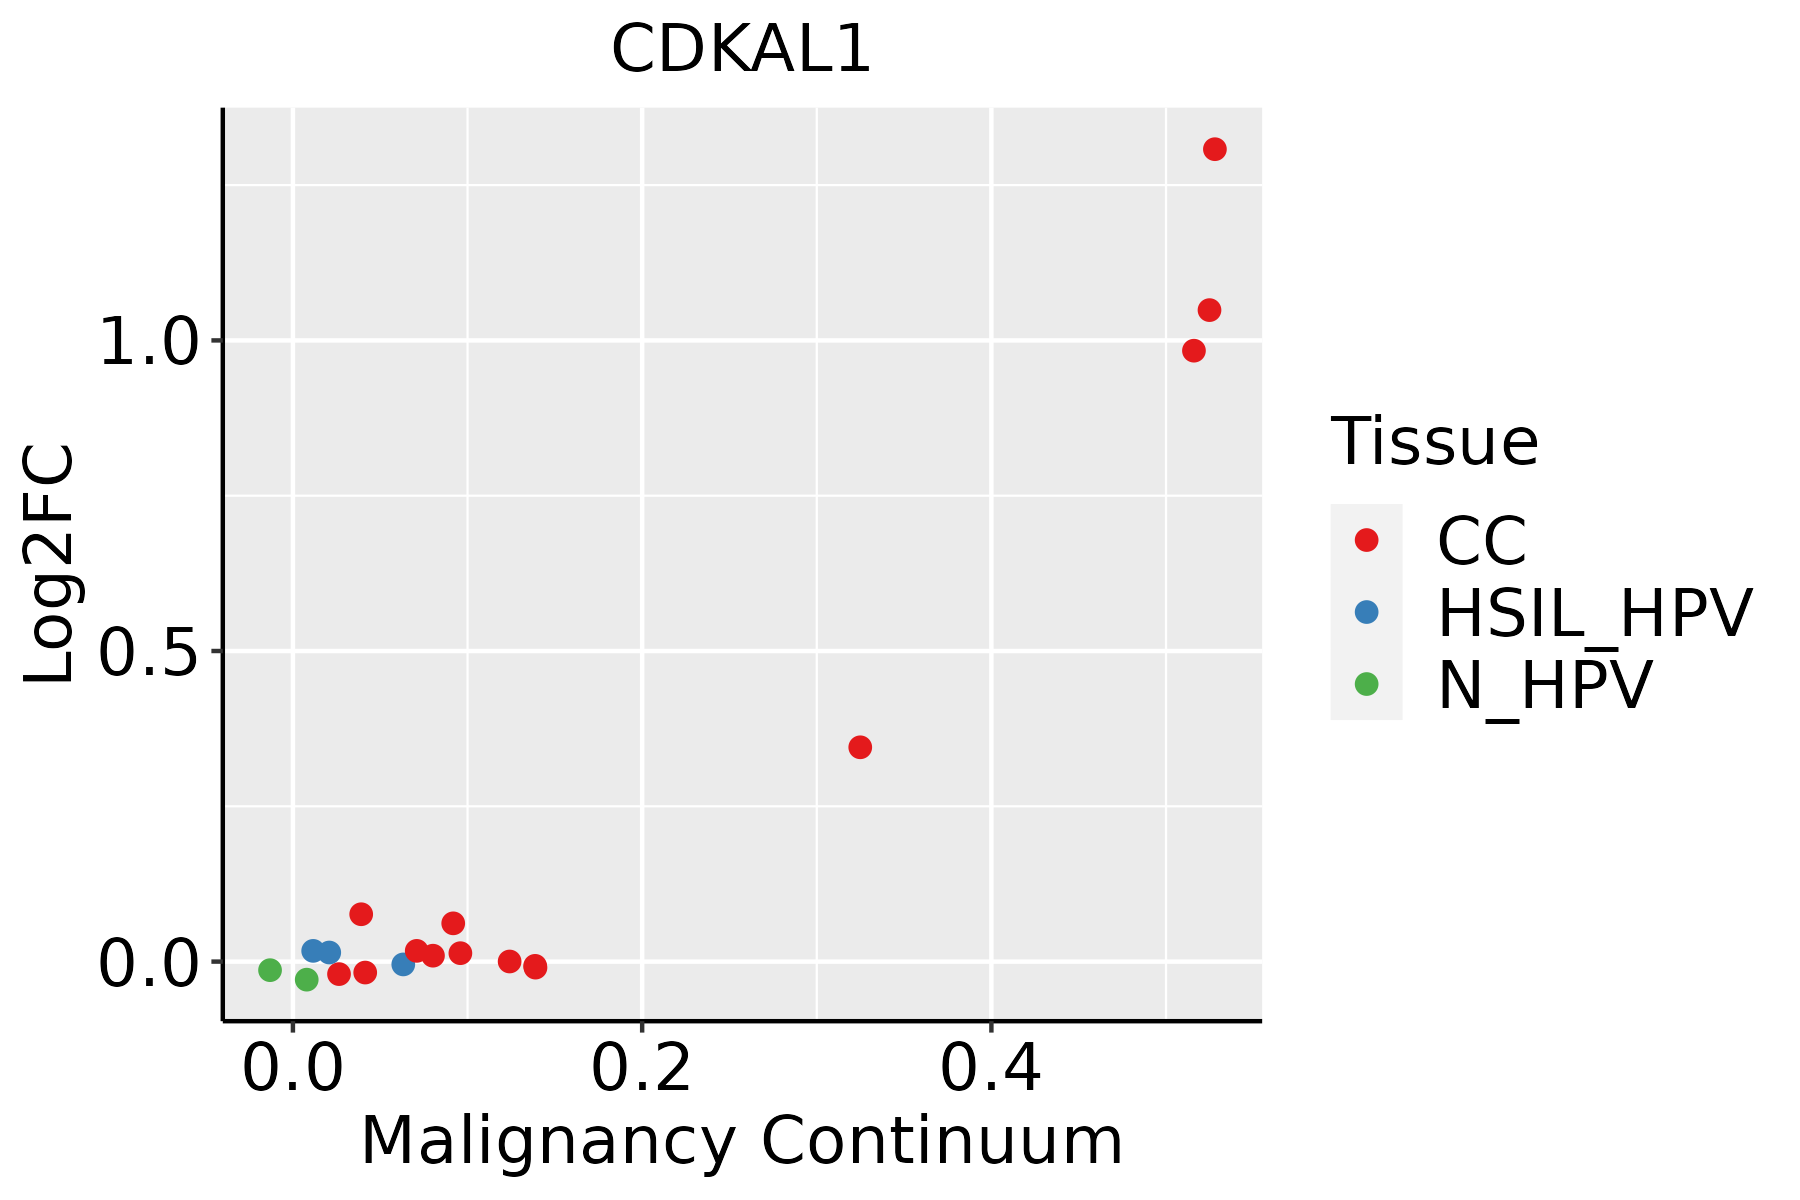 | CC: Cervix cancer |
| HSIL_HPV: HPV-infected high-grade squamous intraepithelial lesions | ||
| N_HPV: HPV-infected normal cervix | ||
| Colorectum (GSE201348) |  | FAP: Familial adenomatous polyposis |
| CRC: Colorectal cancer | ||
| Colorectum (HTA11) |  | AD: Adenomas |
| SER: Sessile serrated lesions | ||
| MSI-H: Microsatellite-high colorectal cancer | ||
| MSS: Microsatellite stable colorectal cancer | ||
| Endometrium | 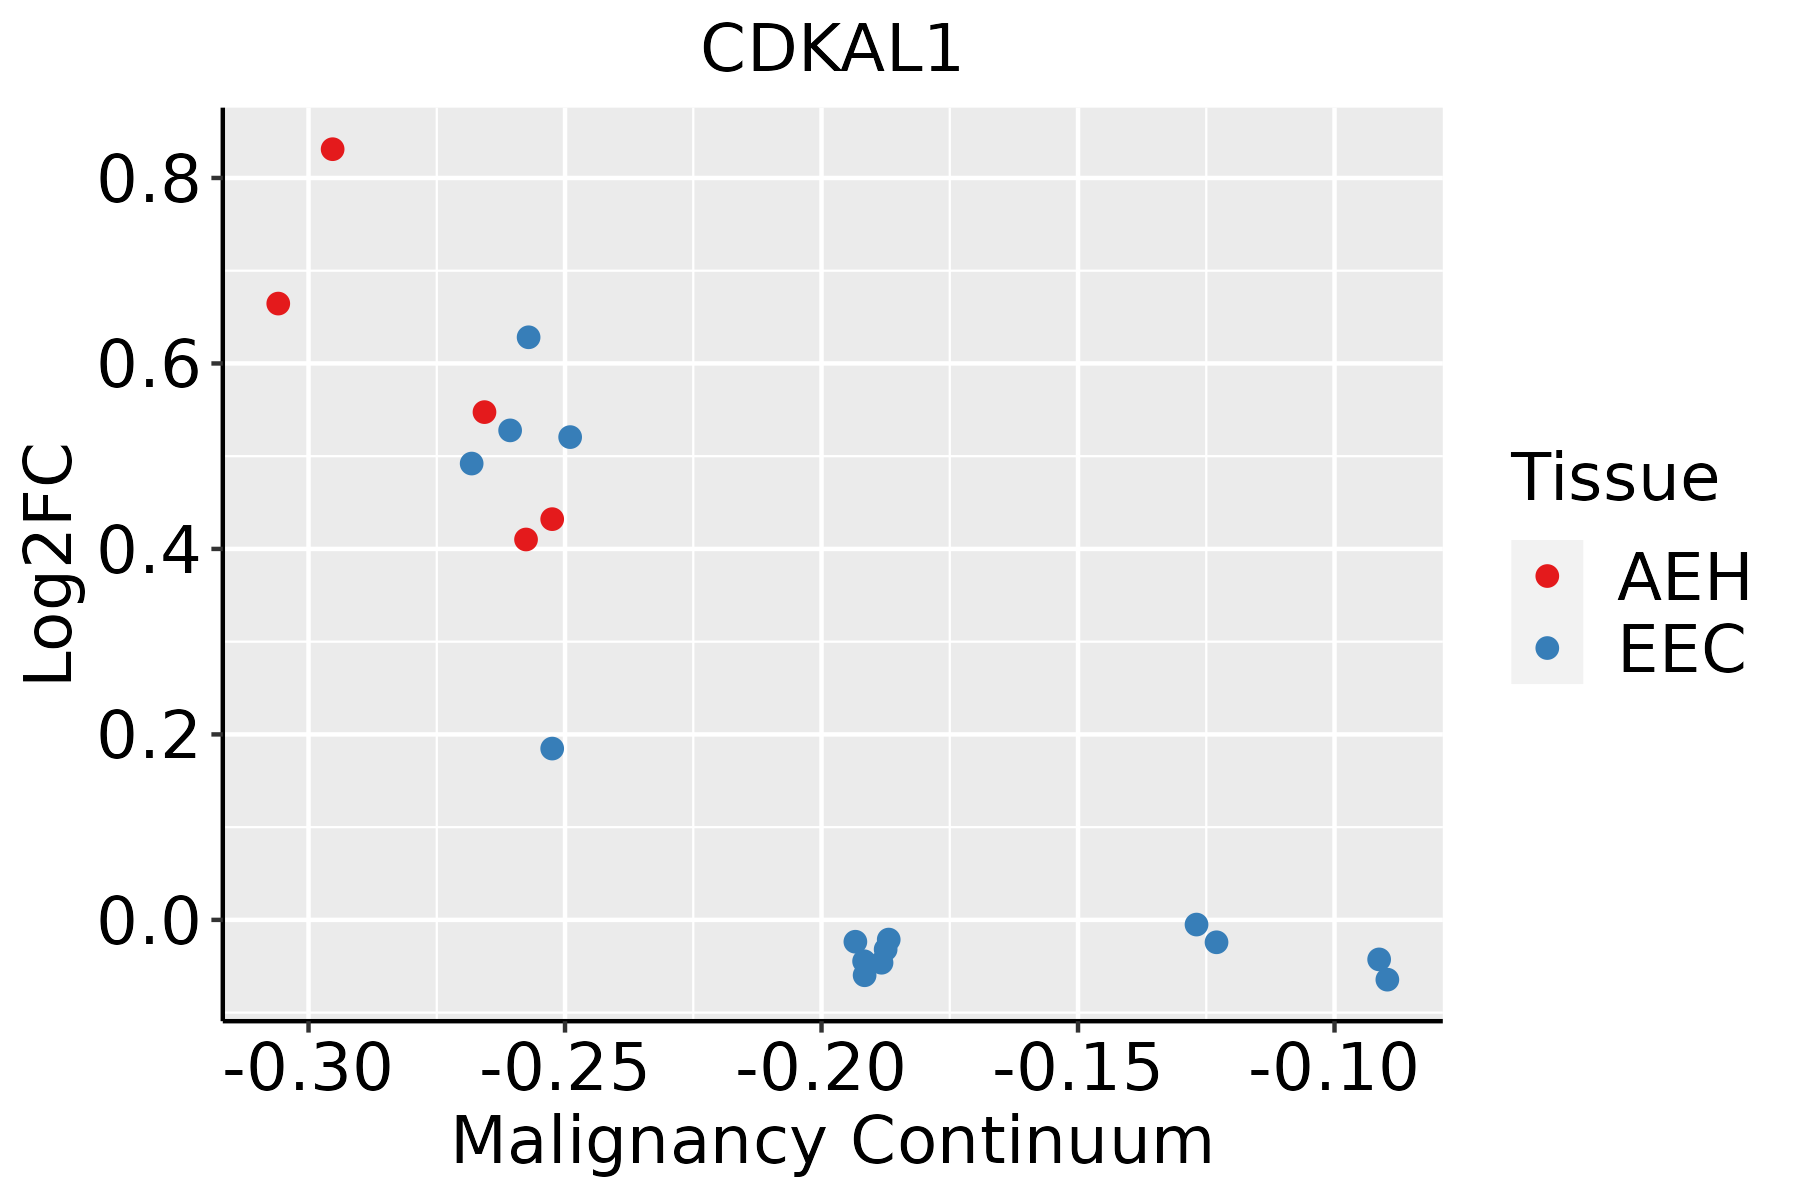 | AEH: Atypical endometrial hyperplasia |
| EEC: Endometrioid Cancer | ||
| Esophagus | 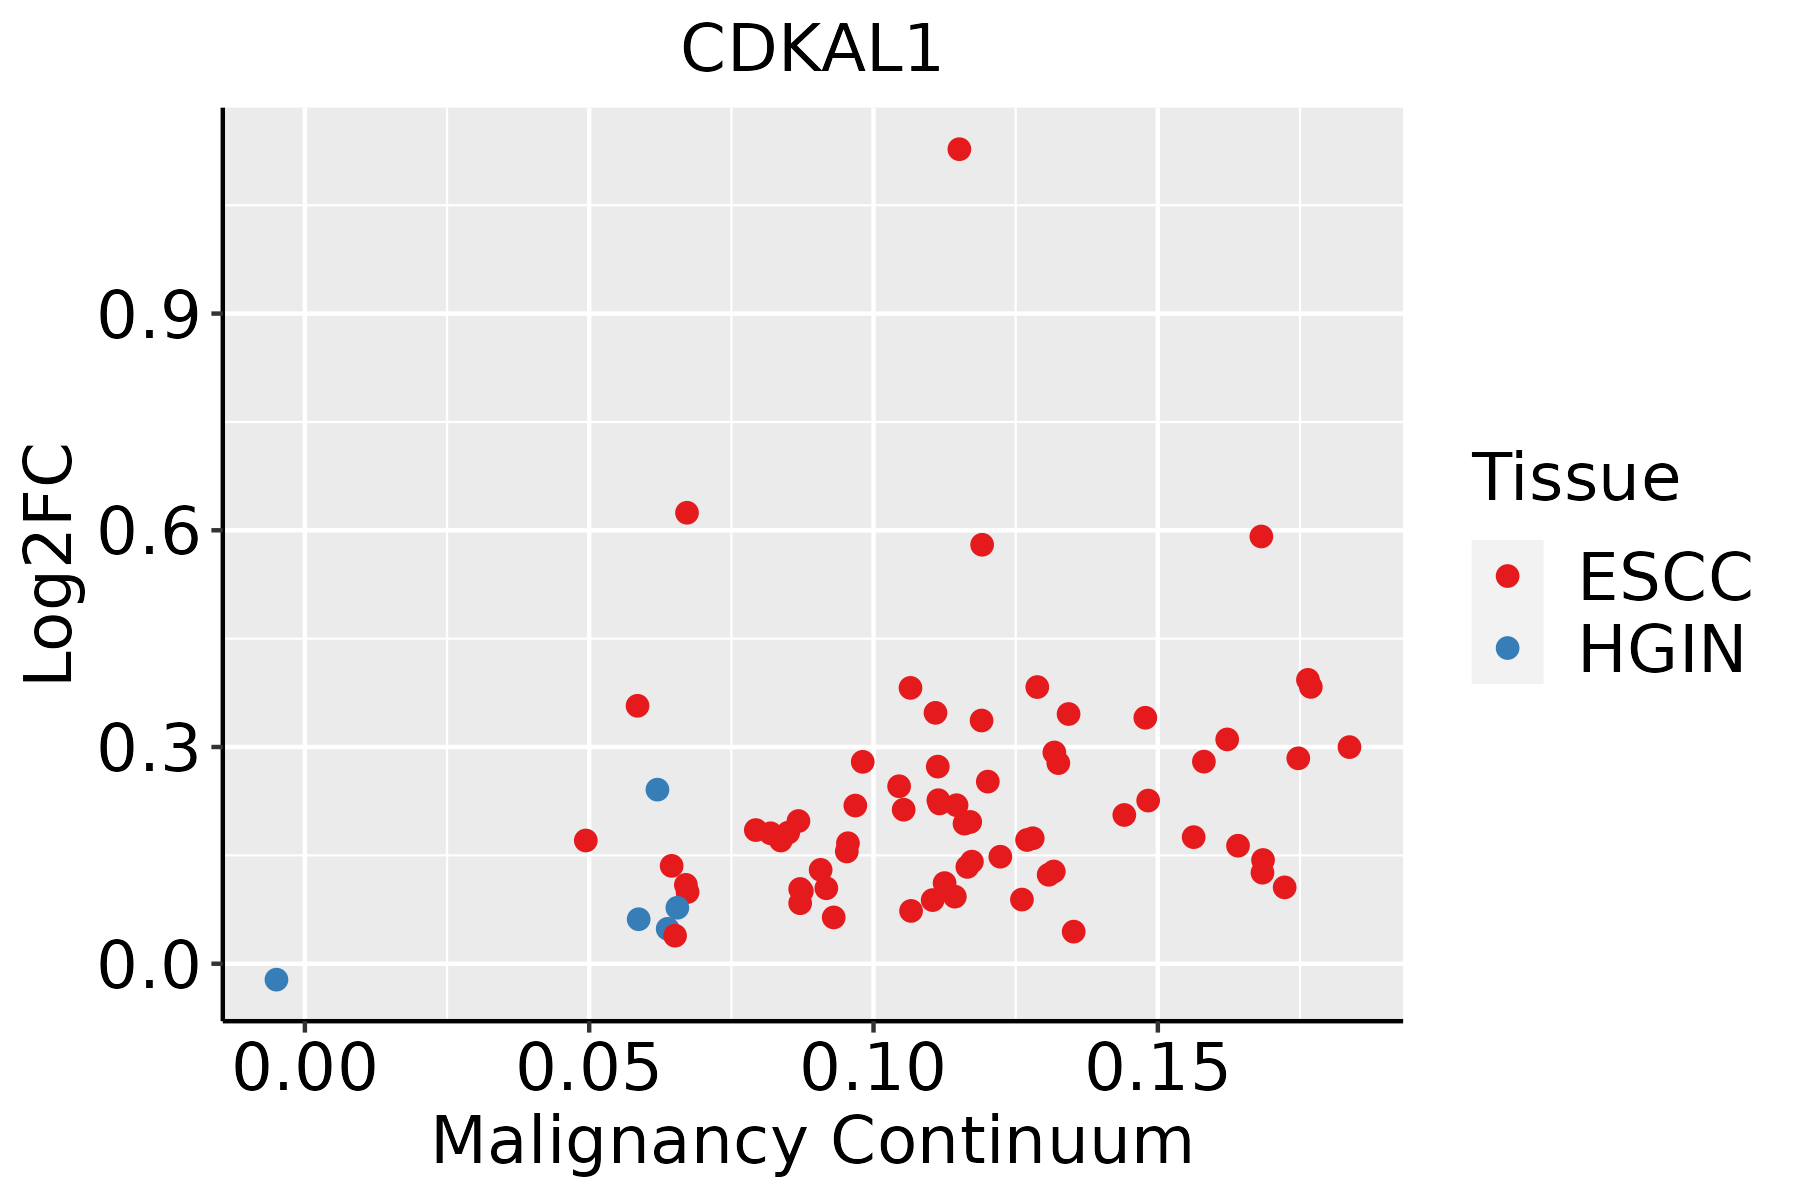 | ESCC: Esophageal squamous cell carcinoma |
| HGIN: High-grade intraepithelial neoplasias | ||
| LGIN: Low-grade intraepithelial neoplasias | ||
| Liver | 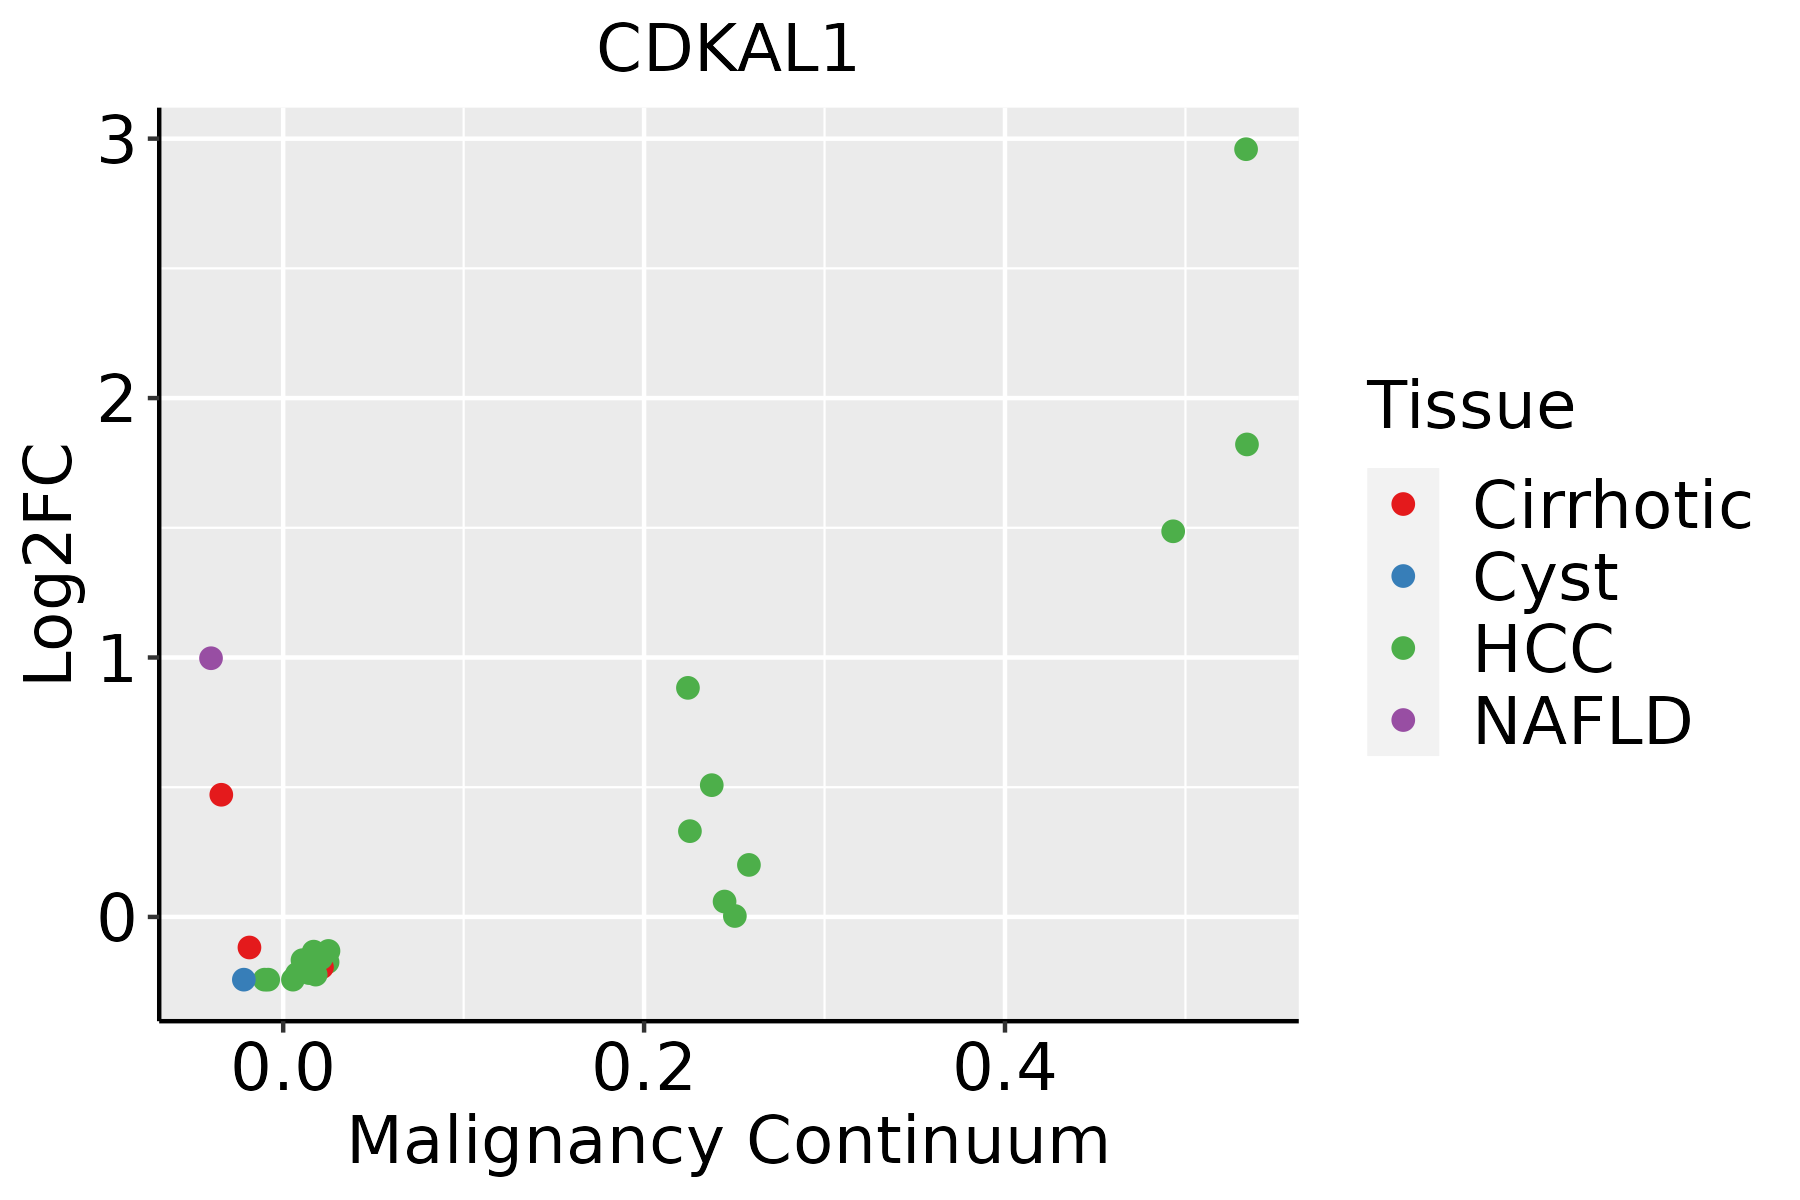 | HCC: Hepatocellular carcinoma |
| NAFLD: Non-alcoholic fatty liver disease | ||
| Lung |  | AAH: Atypical adenomatous hyperplasia |
| AIS: Adenocarcinoma in situ | ||
| IAC: Invasive lung adenocarcinoma | ||
| MIA: Minimally invasive adenocarcinoma | ||
| Oral Cavity |  | EOLP: Erosive Oral lichen planus |
| LP: leukoplakia | ||
| NEOLP: Non-erosive oral lichen planus | ||
| OSCC: Oral squamous cell carcinoma | ||
| Prostate | 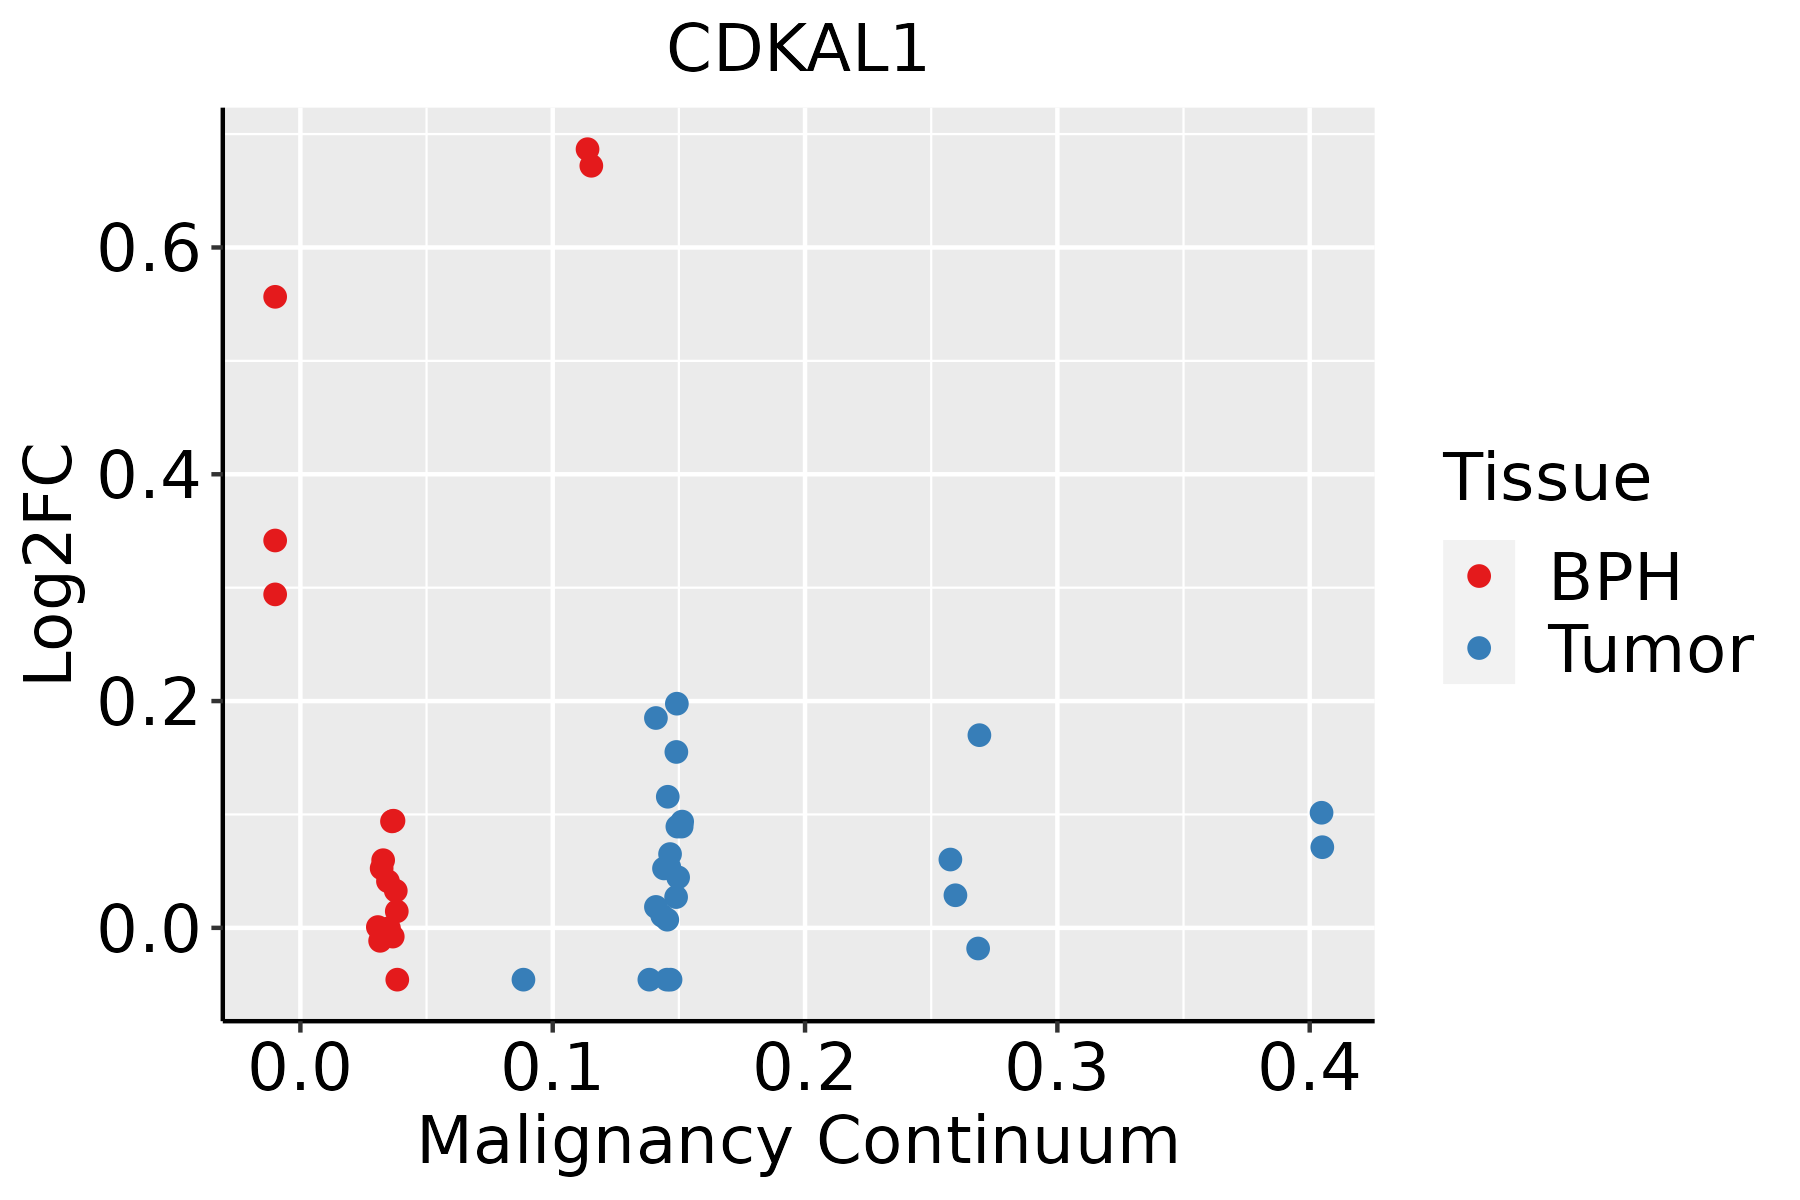 | BPH: Benign Prostatic Hyperplasia |
| Skin |  | AK: Actinic keratosis |
| cSCC: Cutaneous squamous cell carcinoma | ||
| SCCIS:squamous cell carcinoma in situ |
| ∗log2FC in expression of this searched gene in stem-like cells from each diseased tissue sample relative to stem-like cells in normal samples in each tissue plotted against the malignancy continuum. Samples are colored based on if they are from different disease stage. |
Top |
Malignant transformation related pathway analysis |
| Find out the enriched GO biological processes and KEGG pathways involved in transition from healthy to precancer to cancer |
| Tissue | Disease Stage | Enriched GO biological Processes |
| Colorectum | AD |  |
| Colorectum | SER |  |
| Colorectum | MSS |  |
| Colorectum | MSI-H |  |
| Colorectum | FAP |  |
| ∗Top 15 enriched GO BP terms are showed in the bar plot of each disease state in each tissue. Each row represents a significant GO biological process which is colored according to the -log10(p.adjust). |
| Page: 1 2 3 4 5 6 7 8 9 |
| GO ID | Tissue | Disease Stage | Description | Gene Ratio | Bg Ratio | pvalue | p.adjust | Count |
| GO:0034470 | Colorectum | MSI-H | ncRNA processing | 48/1319 | 395/18723 | 1.54e-04 | 4.47e-03 | 48 |
| GO:0034660 | Colorectum | MSI-H | ncRNA metabolic process | 53/1319 | 485/18723 | 9.66e-04 | 1.68e-02 | 53 |
| GO:00344707 | Endometrium | AEH | ncRNA processing | 62/2100 | 395/18723 | 3.93e-03 | 2.65e-02 | 62 |
| GO:003447012 | Endometrium | EEC | ncRNA processing | 63/2168 | 395/18723 | 5.20e-03 | 3.26e-02 | 63 |
| GO:003447015 | Esophagus | ESCC | ncRNA processing | 300/8552 | 395/18723 | 3.09e-35 | 3.26e-32 | 300 |
| GO:003466012 | Esophagus | ESCC | ncRNA metabolic process | 346/8552 | 485/18723 | 4.35e-31 | 2.51e-28 | 346 |
| GO:00080333 | Esophagus | ESCC | tRNA processing | 92/8552 | 127/18723 | 7.83e-10 | 1.93e-08 | 92 |
| GO:00063992 | Esophagus | ESCC | tRNA metabolic process | 122/8552 | 179/18723 | 9.03e-10 | 2.19e-08 | 122 |
| GO:00094512 | Esophagus | ESCC | RNA modification | 114/8552 | 167/18723 | 2.76e-09 | 6.04e-08 | 114 |
| GO:00064002 | Esophagus | ESCC | tRNA modification | 62/8552 | 90/18723 | 7.02e-06 | 7.04e-05 | 62 |
| GO:00344704 | Liver | NAFLD | ncRNA processing | 57/1882 | 395/18723 | 3.34e-03 | 2.93e-02 | 57 |
| GO:00344701 | Liver | Cirrhotic | ncRNA processing | 158/4634 | 395/18723 | 1.09e-11 | 6.96e-10 | 158 |
| GO:00346603 | Liver | Cirrhotic | ncRNA metabolic process | 173/4634 | 485/18723 | 3.64e-08 | 1.21e-06 | 173 |
| GO:00344702 | Liver | HCC | ncRNA processing | 293/7958 | 395/18723 | 4.26e-38 | 6.76e-35 | 293 |
| GO:00346601 | Liver | HCC | ncRNA metabolic process | 332/7958 | 485/18723 | 1.48e-31 | 7.80e-29 | 332 |
| GO:0008033 | Liver | HCC | tRNA processing | 87/7958 | 127/18723 | 2.66e-09 | 7.23e-08 | 87 |
| GO:0006399 | Liver | HCC | tRNA metabolic process | 108/7958 | 179/18723 | 1.07e-06 | 1.59e-05 | 108 |
| GO:0009451 | Liver | HCC | RNA modification | 101/7958 | 167/18723 | 2.02e-06 | 2.78e-05 | 101 |
| GO:0006400 | Liver | HCC | tRNA modification | 60/7958 | 90/18723 | 3.09e-06 | 4.09e-05 | 60 |
| GO:00344709 | Oral cavity | OSCC | ncRNA processing | 263/7305 | 395/18723 | 4.38e-29 | 2.78e-26 | 263 |
| Page: 1 2 |
| Pathway ID | Tissue | Disease Stage | Description | Gene Ratio | Bg Ratio | pvalue | p.adjust | qvalue | Count |
| Page: 1 |
Top |
Cell-cell communication analysis |
| Identification of potential cell-cell interactions between two cell types and their ligand-receptor pairs for different disease states |
| Ligand | Receptor | LRpair | Pathway | Tissue | Disease Stage |
| Page: 1 |
Top |
Single-cell gene regulatory network inference analysis |
| Find out the significant the regulons (TFs) and the target genes of each regulon across cell types for different disease states |
| TF | Cell Type | Tissue | Disease Stage | Target Gene | RSS | Regulon Activity |
| ∗The dot plots of a searched regulon are shown for all cell subpopulations in each disease state of each tissue based on the regulon specific score inferred using pySCENIC and by calculating the average expression. |
| Page: 1 |
Top |
Somatic mutation of malignant transformation related genes |
| Annotation of somatic variants for genes involved in malignant transformation |
| Hugo Symbol | Variant Class | Variant Classification | dbSNP RS | HGVSc | HGVSp | HGVSp Short | SWISSPROT | BIOTYPE | SIFT | PolyPhen | Tumor Sample Barcode | Tissue | Histology | Sex | Age | Stage | Therapy Types | Drugs | Outcome |
| CDKAL1 | SNV | Missense_Mutation | novel | c.1412N>G | p.Met471Arg | p.M471R | Q5VV42 | protein_coding | deleterious(0.01) | benign(0.209) | TCGA-A8-A09A-01 | Breast | breast invasive carcinoma | Female | <65 | I/II | Hormone Therapy | tamoxiphen | SD |
| CDKAL1 | SNV | Missense_Mutation | novel | c.794N>T | p.Arg265Ile | p.R265I | Q5VV42 | protein_coding | tolerated(0.09) | benign(0.1) | TCGA-AC-A8OR-01 | Breast | breast invasive carcinoma | Female | >=65 | I/II | Unknown | Unknown | SD |
| CDKAL1 | SNV | Missense_Mutation | novel | c.1142N>C | p.Val381Ala | p.V381A | Q5VV42 | protein_coding | deleterious(0) | possibly_damaging(0.796) | TCGA-B6-A40C-01 | Breast | breast invasive carcinoma | Female | <65 | I/II | Hormone Therapy | cyclophosphamide | SD |
| CDKAL1 | SNV | Missense_Mutation | novel | c.197N>G | p.Ile66Ser | p.I66S | Q5VV42 | protein_coding | deleterious(0) | probably_damaging(0.984) | TCGA-D8-A1XK-01 | Breast | breast invasive carcinoma | Female | <65 | I/II | Chemotherapy | doxorubicine+cyclophosphamide | SD |
| CDKAL1 | insertion | In_Frame_Ins | novel | c.1657_1658insCTTTCCTTCTTCACAGAAAGG | p.His553delinsProPheLeuLeuHisArgLysAsp | p.H553delinsPFLLHRKD | Q5VV42 | protein_coding | TCGA-BH-A0B1-01 | Breast | breast invasive carcinoma | Female | >=65 | I/II | Chemotherapy | adriamycin | SD | ||
| CDKAL1 | insertion | Nonsense_Mutation | novel | c.1659_1660insAGCCAGGCTTAGAGAGTTTAAA | p.Gln554SerfsTer4 | p.Q554Sfs*4 | Q5VV42 | protein_coding | TCGA-BH-A0B1-01 | Breast | breast invasive carcinoma | Female | >=65 | I/II | Chemotherapy | adriamycin | SD | ||
| CDKAL1 | SNV | Missense_Mutation | novel | c.910N>A | p.Glu304Lys | p.E304K | Q5VV42 | protein_coding | deleterious(0.01) | possibly_damaging(0.898) | TCGA-4J-AA1J-01 | Cervix | cervical & endocervical cancer | Female | <65 | I/II | Unknown | Unknown | SD |
| CDKAL1 | SNV | Missense_Mutation | c.365C>T | p.Ser122Leu | p.S122L | Q5VV42 | protein_coding | tolerated(0.63) | benign(0.01) | TCGA-Q1-A73O-01 | Cervix | cervical & endocervical cancer | Female | <65 | I/II | Chemotherapy | cisplatin | CR | |
| CDKAL1 | SNV | Missense_Mutation | c.1406C>G | p.Ala469Gly | p.A469G | Q5VV42 | protein_coding | tolerated(0.41) | benign(0.006) | TCGA-AA-A01Z-01 | Colorectum | colon adenocarcinoma | Male | >=65 | I/II | Unknown | Unknown | PD | |
| CDKAL1 | SNV | Missense_Mutation | novel | c.574G>A | p.Ala192Thr | p.A192T | Q5VV42 | protein_coding | deleterious(0.05) | benign(0.235) | TCGA-AM-5820-01 | Colorectum | colon adenocarcinoma | Female | <65 | I/II | Unknown | Unknown | SD |
| Page: 1 2 3 4 5 6 7 |
Top |
Related drugs of malignant transformation related genes |
| Identification of chemicals and drugs interact with genes involved in malignant transfromation |
| (DGIdb 4.0) |
| Entrez ID | Symbol | Category | Interaction Types | Drug Claim Name | Drug Name | PMIDs |
| 54901 | CDKAL1 | ENZYME | Dipeptidyl peptidase 4 (DPP-4) inhibitors | |||
| 54901 | CDKAL1 | ENZYME | Tumor necrosis factor alpha (TNF-alpha) inhibitors | 27670765 |
| Page: 1 |

Copyright 2023-Present -The University of Texas Health Science Center at Houston |