
|
|||||
|
 | |
| |
| |
| |
| |
| |
|
Gene: CDK9 |
Gene summary for CDK9 |
| Gene information | Species | Human | Gene symbol | CDK9 | Gene ID | 1025 |
| Gene name | cyclin dependent kinase 9 | |
| Gene Alias | C-2k | |
| Cytomap | 9q34.11 | |
| Gene Type | protein-coding | GO ID | GO:0001932 | UniProtAcc | A0A024R880 |
Top |
Malignant transformation analysis |
| Identification of the aberrant gene expression in precancerous and cancerous lesions by comparing the gene expression of stem-like cells in diseased tissues with normal stem cells |
| Entrez ID | Symbol | Replicates | Species | Organ | Tissue | Adj P-value | Log2FC | Malignancy |
| 1025 | CDK9 | LZE4T | Human | Esophagus | ESCC | 1.15e-03 | 6.13e-02 | 0.0811 |
| 1025 | CDK9 | LZE7T | Human | Esophagus | ESCC | 5.27e-04 | 7.40e-02 | 0.0667 |
| 1025 | CDK9 | LZE20T | Human | Esophagus | ESCC | 1.14e-08 | 1.91e-01 | 0.0662 |
| 1025 | CDK9 | LZE24T | Human | Esophagus | ESCC | 1.26e-10 | 2.15e-01 | 0.0596 |
| 1025 | CDK9 | LZE21T | Human | Esophagus | ESCC | 6.09e-04 | 1.09e-01 | 0.0655 |
| 1025 | CDK9 | P1T-E | Human | Esophagus | ESCC | 7.16e-10 | 3.42e-01 | 0.0875 |
| 1025 | CDK9 | P2T-E | Human | Esophagus | ESCC | 5.37e-39 | 5.98e-01 | 0.1177 |
| 1025 | CDK9 | P4T-E | Human | Esophagus | ESCC | 5.87e-22 | 4.79e-01 | 0.1323 |
| 1025 | CDK9 | P5T-E | Human | Esophagus | ESCC | 2.27e-24 | 1.96e-01 | 0.1327 |
| 1025 | CDK9 | P8T-E | Human | Esophagus | ESCC | 1.10e-21 | 4.34e-01 | 0.0889 |
| 1025 | CDK9 | P9T-E | Human | Esophagus | ESCC | 1.68e-16 | 3.47e-01 | 0.1131 |
| 1025 | CDK9 | P10T-E | Human | Esophagus | ESCC | 9.05e-21 | 1.61e-01 | 0.116 |
| 1025 | CDK9 | P11T-E | Human | Esophagus | ESCC | 4.62e-11 | 5.09e-01 | 0.1426 |
| 1025 | CDK9 | P12T-E | Human | Esophagus | ESCC | 5.95e-19 | 1.62e-01 | 0.1122 |
| 1025 | CDK9 | P15T-E | Human | Esophagus | ESCC | 4.34e-16 | 2.35e-01 | 0.1149 |
| 1025 | CDK9 | P16T-E | Human | Esophagus | ESCC | 8.43e-16 | 8.23e-02 | 0.1153 |
| 1025 | CDK9 | P17T-E | Human | Esophagus | ESCC | 1.65e-14 | 2.66e-01 | 0.1278 |
| 1025 | CDK9 | P20T-E | Human | Esophagus | ESCC | 7.40e-15 | 1.17e-01 | 0.1124 |
| 1025 | CDK9 | P21T-E | Human | Esophagus | ESCC | 4.35e-27 | 2.98e-01 | 0.1617 |
| 1025 | CDK9 | P22T-E | Human | Esophagus | ESCC | 1.64e-25 | 2.18e-01 | 0.1236 |
| Page: 1 2 3 4 5 |
| Tissue | Expression Dynamics | Abbreviation |
| Esophagus |  | ESCC: Esophageal squamous cell carcinoma |
| HGIN: High-grade intraepithelial neoplasias | ||
| LGIN: Low-grade intraepithelial neoplasias | ||
| Liver | 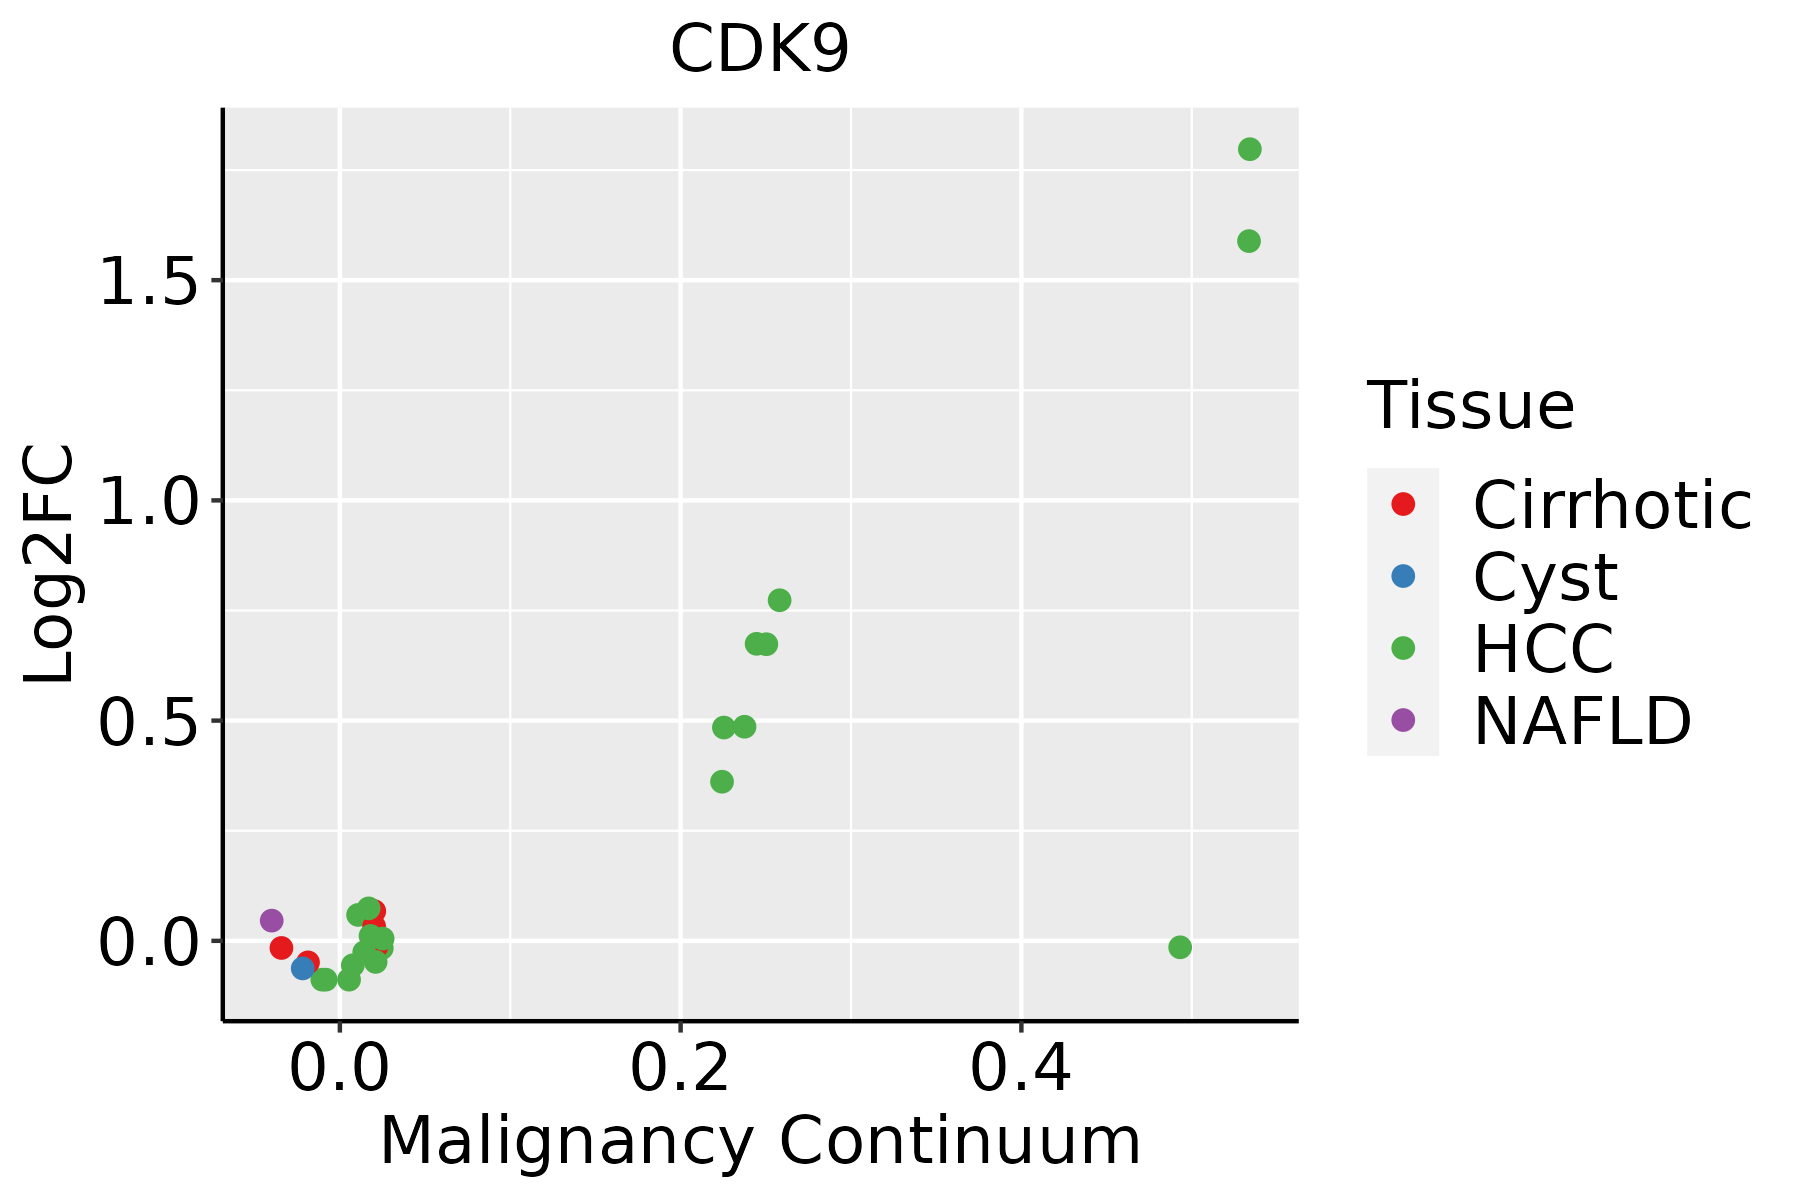 | HCC: Hepatocellular carcinoma |
| NAFLD: Non-alcoholic fatty liver disease | ||
| Oral Cavity | 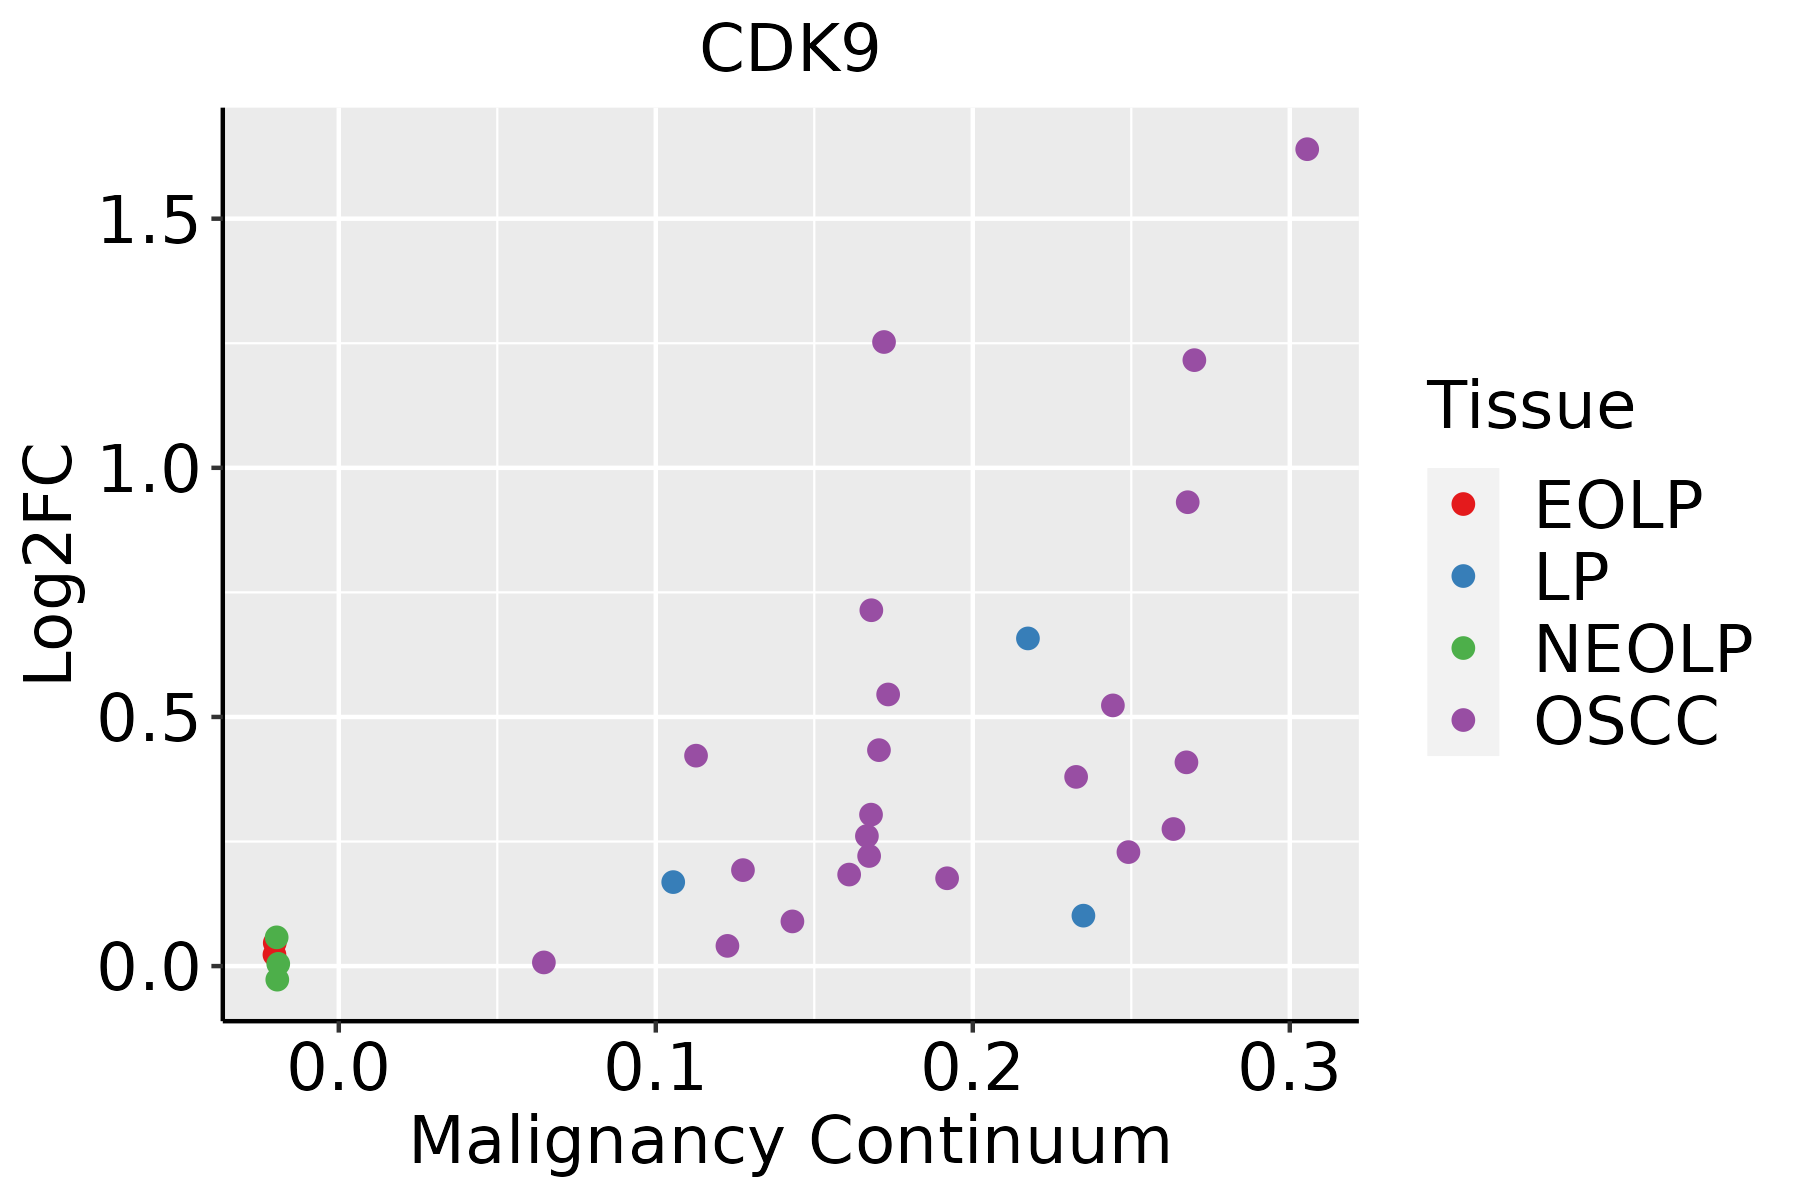 | EOLP: Erosive Oral lichen planus |
| LP: leukoplakia | ||
| NEOLP: Non-erosive oral lichen planus | ||
| OSCC: Oral squamous cell carcinoma | ||
| Skin |  | AK: Actinic keratosis |
| cSCC: Cutaneous squamous cell carcinoma | ||
| SCCIS:squamous cell carcinoma in situ | ||
| Thyroid | 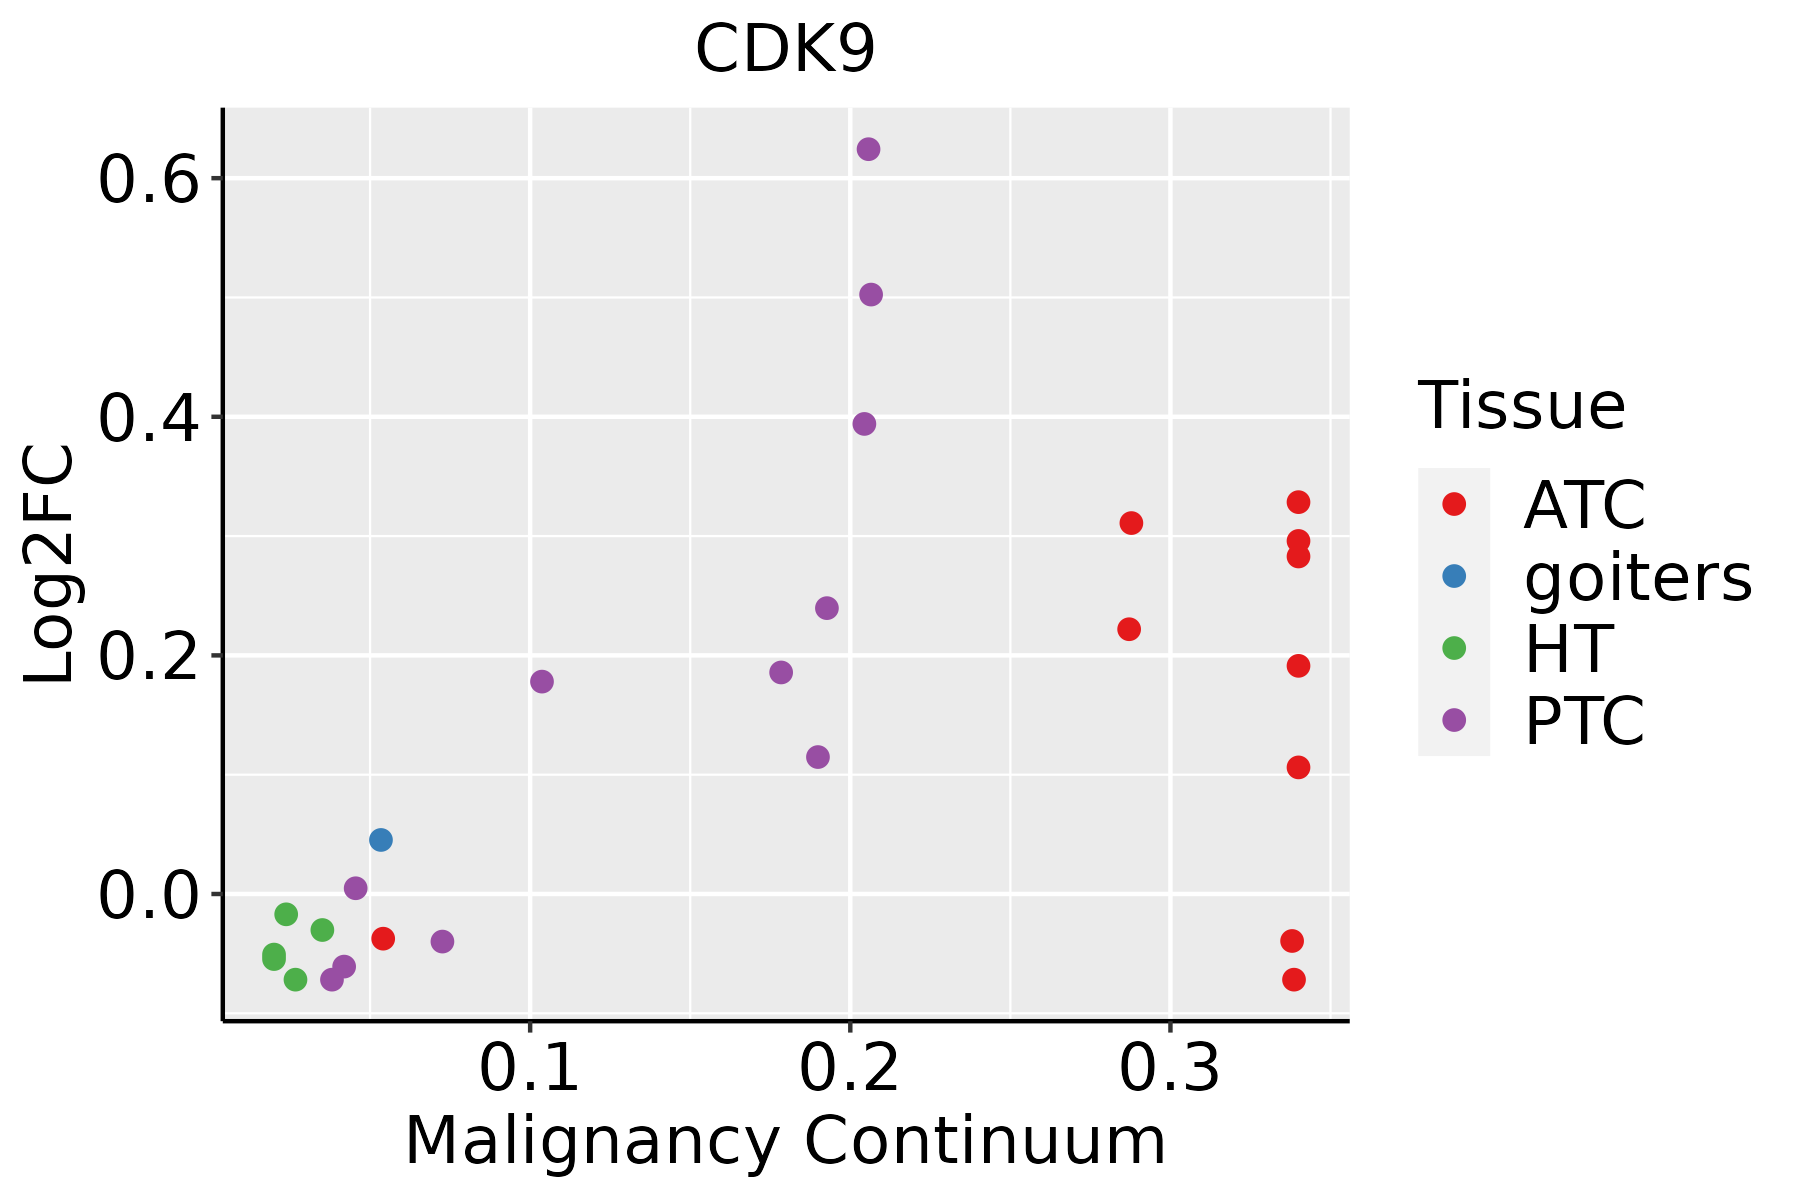 | ATC: Anaplastic thyroid cancer |
| HT: Hashimoto's thyroiditis | ||
| PTC: Papillary thyroid cancer |
| ∗log2FC in expression of this searched gene in stem-like cells from each diseased tissue sample relative to stem-like cells in normal samples in each tissue plotted against the malignancy continuum. Samples are colored based on if they are from different disease stage. |
Top |
Malignant transformation related pathway analysis |
| Find out the enriched GO biological processes and KEGG pathways involved in transition from healthy to precancer to cancer |
| Tissue | Disease Stage | Enriched GO biological Processes |
| Colorectum | AD |  |
| Colorectum | SER |  |
| Colorectum | MSS |  |
| Colorectum | MSI-H |  |
| Colorectum | FAP |  |
| ∗Top 15 enriched GO BP terms are showed in the bar plot of each disease state in each tissue. Each row represents a significant GO biological process which is colored according to the -log10(p.adjust). |
| Page: 1 2 3 4 5 6 7 8 9 |
| GO ID | Tissue | Disease Stage | Description | Gene Ratio | Bg Ratio | pvalue | p.adjust | Count |
| GO:001657015 | Esophagus | ESCC | histone modification | 323/8552 | 463/18723 | 2.61e-26 | 7.88e-24 | 323 |
| GO:1903311110 | Esophagus | ESCC | regulation of mRNA metabolic process | 210/8552 | 288/18723 | 3.25e-21 | 5.56e-19 | 210 |
| GO:1903320111 | Esophagus | ESCC | regulation of protein modification by small protein conjugation or removal | 181/8552 | 242/18723 | 1.80e-20 | 2.60e-18 | 181 |
| GO:0051098111 | Esophagus | ESCC | regulation of binding | 251/8552 | 363/18723 | 6.73e-20 | 8.46e-18 | 251 |
| GO:0031396111 | Esophagus | ESCC | regulation of protein ubiquitination | 154/8552 | 210/18723 | 2.70e-16 | 2.04e-14 | 154 |
| GO:0050684110 | Esophagus | ESCC | regulation of mRNA processing | 109/8552 | 137/18723 | 3.51e-16 | 2.59e-14 | 109 |
| GO:00062604 | Esophagus | ESCC | DNA replication | 181/8552 | 260/18723 | 3.55e-15 | 2.05e-13 | 181 |
| GO:000635414 | Esophagus | ESCC | DNA-templated transcription, elongation | 76/8552 | 91/18723 | 8.35e-14 | 4.11e-12 | 76 |
| GO:005105215 | Esophagus | ESCC | regulation of DNA metabolic process | 232/8552 | 359/18723 | 2.40e-13 | 1.13e-11 | 232 |
| GO:0051099111 | Esophagus | ESCC | positive regulation of binding | 122/8552 | 173/18723 | 2.79e-11 | 9.45e-10 | 122 |
| GO:190332216 | Esophagus | ESCC | positive regulation of protein modification by small protein conjugation or removal | 99/8552 | 138/18723 | 4.39e-10 | 1.16e-08 | 99 |
| GO:2001020110 | Esophagus | ESCC | regulation of response to DNA damage stimulus | 145/8552 | 219/18723 | 5.97e-10 | 1.50e-08 | 145 |
| GO:000636814 | Esophagus | ESCC | transcription elongation from RNA polymerase II promoter | 56/8552 | 69/18723 | 1.40e-09 | 3.30e-08 | 56 |
| GO:003105614 | Esophagus | ESCC | regulation of histone modification | 106/8552 | 152/18723 | 1.52e-09 | 3.55e-08 | 106 |
| GO:001657414 | Esophagus | ESCC | histone ubiquitination | 40/8552 | 47/18723 | 2.40e-08 | 4.55e-07 | 40 |
| GO:003139816 | Esophagus | ESCC | positive regulation of protein ubiquitination | 82/8552 | 119/18723 | 2.41e-07 | 3.64e-06 | 82 |
| GO:00062612 | Esophagus | ESCC | DNA-dependent DNA replication | 100/8552 | 151/18723 | 2.61e-07 | 3.94e-06 | 100 |
| GO:005068615 | Esophagus | ESCC | negative regulation of mRNA processing | 26/8552 | 29/18723 | 8.98e-07 | 1.15e-05 | 26 |
| GO:00310583 | Esophagus | ESCC | positive regulation of histone modification | 65/8552 | 92/18723 | 1.04e-06 | 1.31e-05 | 65 |
| GO:003112412 | Esophagus | ESCC | mRNA 3'-end processing | 47/8552 | 62/18723 | 1.29e-06 | 1.58e-05 | 47 |
| Page: 1 2 3 4 5 6 7 8 9 10 |
| Pathway ID | Tissue | Disease Stage | Description | Gene Ratio | Bg Ratio | pvalue | p.adjust | qvalue | Count |
| hsa032509 | Esophagus | ESCC | Viral life cycle - HIV-1 | 54/4205 | 63/8465 | 2.01e-09 | 2.17e-08 | 1.11e-08 | 54 |
| hsa052028 | Esophagus | ESCC | Transcriptional misregulation in cancer | 116/4205 | 193/8465 | 2.08e-03 | 5.95e-03 | 3.05e-03 | 116 |
| hsa0325014 | Esophagus | ESCC | Viral life cycle - HIV-1 | 54/4205 | 63/8465 | 2.01e-09 | 2.17e-08 | 1.11e-08 | 54 |
| hsa0520213 | Esophagus | ESCC | Transcriptional misregulation in cancer | 116/4205 | 193/8465 | 2.08e-03 | 5.95e-03 | 3.05e-03 | 116 |
| hsa032502 | Liver | HCC | Viral life cycle - HIV-1 | 46/4020 | 63/8465 | 3.25e-05 | 1.88e-04 | 1.04e-04 | 46 |
| hsa0325011 | Liver | HCC | Viral life cycle - HIV-1 | 46/4020 | 63/8465 | 3.25e-05 | 1.88e-04 | 1.04e-04 | 46 |
| hsa032508 | Oral cavity | OSCC | Viral life cycle - HIV-1 | 45/3704 | 63/8465 | 7.62e-06 | 3.59e-05 | 1.83e-05 | 45 |
| hsa0325013 | Oral cavity | OSCC | Viral life cycle - HIV-1 | 45/3704 | 63/8465 | 7.62e-06 | 3.59e-05 | 1.83e-05 | 45 |
| Page: 1 |
Top |
Cell-cell communication analysis |
| Identification of potential cell-cell interactions between two cell types and their ligand-receptor pairs for different disease states |
| Ligand | Receptor | LRpair | Pathway | Tissue | Disease Stage |
| Page: 1 |
Top |
Single-cell gene regulatory network inference analysis |
| Find out the significant the regulons (TFs) and the target genes of each regulon across cell types for different disease states |
| TF | Cell Type | Tissue | Disease Stage | Target Gene | RSS | Regulon Activity |
| ∗The dot plots of a searched regulon are shown for all cell subpopulations in each disease state of each tissue based on the regulon specific score inferred using pySCENIC and by calculating the average expression. |
| Page: 1 |
Top |
Somatic mutation of malignant transformation related genes |
| Annotation of somatic variants for genes involved in malignant transformation |
| Hugo Symbol | Variant Class | Variant Classification | dbSNP RS | HGVSc | HGVSp | HGVSp Short | SWISSPROT | BIOTYPE | SIFT | PolyPhen | Tumor Sample Barcode | Tissue | Histology | Sex | Age | Stage | Therapy Types | Drugs | Outcome |
| CDK9 | insertion | In_Frame_Ins | novel | c.1059_1060insGGGTCGAGTAGCAGTCTGGGAGCCTCCGAGTGGAGCAGGTATTTT | p.Ser353_Thr354insGlySerSerSerSerLeuGlyAlaSerGluTrpSerArgTyrPhe | p.S353_T354insGSSSSLGASEWSRYF | P50750 | protein_coding | TCGA-A8-A06Z-01 | Breast | breast invasive carcinoma | Female | >=65 | I/II | Unknown | Unknown | SD | ||
| CDK9 | insertion | Frame_Shift_Ins | novel | c.984_985insCGAGTAGCAGTCTGGGAGCCTCCGAG | p.Ser329ArgfsTer13 | p.S329Rfs*13 | P50750 | protein_coding | TCGA-AO-A0J9-01 | Breast | breast invasive carcinoma | Female | <65 | III/IV | Chemotherapy | cyclophosphamide | PD | ||
| CDK9 | SNV | Missense_Mutation | novel | c.342G>C | p.Leu114Phe | p.L114F | P50750 | protein_coding | deleterious(0.01) | probably_damaging(0.999) | TCGA-C5-A1BJ-01 | Cervix | cervical & endocervical cancer | Female | <65 | I/II | Unknown | Unknown | SD |
| CDK9 | SNV | Missense_Mutation | c.851N>A | p.Arg284His | p.R284H | P50750 | protein_coding | deleterious(0.01) | benign(0.4) | TCGA-AA-3980-01 | Colorectum | colon adenocarcinoma | Female | >=65 | I/II | Unknown | Unknown | SD | |
| CDK9 | SNV | Missense_Mutation | rs770506343 | c.604G>A | p.Gly202Arg | p.G202R | P50750 | protein_coding | deleterious(0) | probably_damaging(0.996) | TCGA-AD-6889-01 | Colorectum | colon adenocarcinoma | Male | >=65 | I/II | Chemotherapy | xeloda | PD |
| CDK9 | SNV | Missense_Mutation | c.793N>G | p.Leu265Val | p.L265V | P50750 | protein_coding | tolerated(0.15) | benign(0.031) | TCGA-AD-6895-01 | Colorectum | colon adenocarcinoma | Male | >=65 | III/IV | Unknown | Unknown | SD | |
| CDK9 | SNV | Missense_Mutation | c.278N>C | p.Asn93Thr | p.N93T | P50750 | protein_coding | tolerated(0.06) | possibly_damaging(0.531) | TCGA-CA-6718-01 | Colorectum | colon adenocarcinoma | Male | <65 | I/II | Unknown | Unknown | PD | |
| CDK9 | SNV | Missense_Mutation | rs370938433 | c.850C>T | p.Arg284Cys | p.R284C | P50750 | protein_coding | tolerated(0.06) | benign(0.019) | TCGA-G4-6309-01 | Colorectum | colon adenocarcinoma | Female | <65 | III/IV | Chemotherapy | xeloda | PD |
| CDK9 | SNV | Missense_Mutation | rs753758776 | c.1073N>A | p.Arg358His | p.R358H | P50750 | protein_coding | tolerated(0.2) | benign(0.001) | TCGA-F5-6814-01 | Colorectum | rectum adenocarcinoma | Male | <65 | I/II | Unknown | Unknown | SD |
| CDK9 | SNV | Missense_Mutation | c.877N>T | p.Asp293Tyr | p.D293Y | P50750 | protein_coding | deleterious(0.03) | probably_damaging(0.992) | TCGA-G5-6572-02 | Colorectum | NA | NA | NA | NA | NA | NA | NA |
| Page: 1 2 3 4 |
Top |
Related drugs of malignant transformation related genes |
| Identification of chemicals and drugs interact with genes involved in malignant transfromation |
| (DGIdb 4.0) |
| Entrez ID | Symbol | Category | Interaction Types | Drug Claim Name | Drug Name | PMIDs |
| 1025 | CDK9 | SERINE THREONINE KINASE, TUMOR SUPPRESSOR, DNA REPAIR, KINASE, DRUGGABLE GENOME, TRANSCRIPTION FACTOR, ENZYME | inhibitor | CHEMBL14762 | SELICICLIB | |
| 1025 | CDK9 | SERINE THREONINE KINASE, TUMOR SUPPRESSOR, DNA REPAIR, KINASE, DRUGGABLE GENOME, TRANSCRIPTION FACTOR, ENZYME | inhibitor | SCH727965 | DINACICLIB | |
| 1025 | CDK9 | SERINE THREONINE KINASE, TUMOR SUPPRESSOR, DNA REPAIR, KINASE, DRUGGABLE GENOME, TRANSCRIPTION FACTOR, ENZYME | Diaryl amine derivative 1 | |||
| 1025 | CDK9 | SERINE THREONINE KINASE, TUMOR SUPPRESSOR, DNA REPAIR, KINASE, DRUGGABLE GENOME, TRANSCRIPTION FACTOR, ENZYME | inhibitor | CHEMBL2103840 | DINACICLIB | |
| 1025 | CDK9 | SERINE THREONINE KINASE, TUMOR SUPPRESSOR, DNA REPAIR, KINASE, DRUGGABLE GENOME, TRANSCRIPTION FACTOR, ENZYME | inhibitor | CHEMBL3545283 | RIVICICLIB | |
| 1025 | CDK9 | SERINE THREONINE KINASE, TUMOR SUPPRESSOR, DNA REPAIR, KINASE, DRUGGABLE GENOME, TRANSCRIPTION FACTOR, ENZYME | PF-562271 | PF-00562271 | ||
| 1025 | CDK9 | SERINE THREONINE KINASE, TUMOR SUPPRESSOR, DNA REPAIR, KINASE, DRUGGABLE GENOME, TRANSCRIPTION FACTOR, ENZYME | inhibitor | 315661180 | ZOTIRACICLIB | |
| 1025 | CDK9 | SERINE THREONINE KINASE, TUMOR SUPPRESSOR, DNA REPAIR, KINASE, DRUGGABLE GENOME, TRANSCRIPTION FACTOR, ENZYME | inhibitor | 375973268 | ||
| 1025 | CDK9 | SERINE THREONINE KINASE, TUMOR SUPPRESSOR, DNA REPAIR, KINASE, DRUGGABLE GENOME, TRANSCRIPTION FACTOR, ENZYME | inhibitor | 340590256 | TRILACICLIB | |
| 1025 | CDK9 | SERINE THREONINE KINASE, TUMOR SUPPRESSOR, DNA REPAIR, KINASE, DRUGGABLE GENOME, TRANSCRIPTION FACTOR, ENZYME | inhibitor | 363894197 | CT-7001 |
| Page: 1 2 3 4 5 6 7 8 9 |

Copyright 2023-Present -The University of Texas Health Science Center at Houston |