
|
|||||
|
 | |
| |
| |
| |
| |
| |
|
Gene: CDK7 |
Gene summary for CDK7 |
| Gene information | Species | Human | Gene symbol | CDK7 | Gene ID | 1022 |
| Gene name | cyclin dependent kinase 7 | |
| Gene Alias | CAK | |
| Cytomap | 5q13.2 | |
| Gene Type | protein-coding | GO ID | GO:0000079 | UniProtAcc | P50613 |
Top |
Malignant transformation analysis |
| Identification of the aberrant gene expression in precancerous and cancerous lesions by comparing the gene expression of stem-like cells in diseased tissues with normal stem cells |
| Entrez ID | Symbol | Replicates | Species | Organ | Tissue | Adj P-value | Log2FC | Malignancy |
| 1022 | CDK7 | LZE4T | Human | Esophagus | ESCC | 3.00e-07 | 1.33e-01 | 0.0811 |
| 1022 | CDK7 | LZE24T | Human | Esophagus | ESCC | 1.21e-10 | 2.10e-01 | 0.0596 |
| 1022 | CDK7 | P2T-E | Human | Esophagus | ESCC | 1.18e-23 | 3.81e-01 | 0.1177 |
| 1022 | CDK7 | P4T-E | Human | Esophagus | ESCC | 2.06e-14 | 3.56e-01 | 0.1323 |
| 1022 | CDK7 | P5T-E | Human | Esophagus | ESCC | 1.80e-10 | 1.60e-01 | 0.1327 |
| 1022 | CDK7 | P8T-E | Human | Esophagus | ESCC | 4.55e-17 | 9.57e-02 | 0.0889 |
| 1022 | CDK7 | P9T-E | Human | Esophagus | ESCC | 4.44e-08 | 1.68e-01 | 0.1131 |
| 1022 | CDK7 | P10T-E | Human | Esophagus | ESCC | 1.67e-07 | 6.19e-02 | 0.116 |
| 1022 | CDK7 | P11T-E | Human | Esophagus | ESCC | 4.62e-13 | 5.43e-01 | 0.1426 |
| 1022 | CDK7 | P12T-E | Human | Esophagus | ESCC | 6.49e-16 | 2.35e-01 | 0.1122 |
| 1022 | CDK7 | P15T-E | Human | Esophagus | ESCC | 4.49e-13 | 2.64e-01 | 0.1149 |
| 1022 | CDK7 | P16T-E | Human | Esophagus | ESCC | 3.06e-19 | 1.34e-01 | 0.1153 |
| 1022 | CDK7 | P19T-E | Human | Esophagus | ESCC | 7.15e-04 | 2.69e-01 | 0.1662 |
| 1022 | CDK7 | P20T-E | Human | Esophagus | ESCC | 3.62e-17 | 2.59e-01 | 0.1124 |
| 1022 | CDK7 | P21T-E | Human | Esophagus | ESCC | 2.07e-15 | 3.81e-01 | 0.1617 |
| 1022 | CDK7 | P22T-E | Human | Esophagus | ESCC | 7.47e-24 | 2.03e-01 | 0.1236 |
| 1022 | CDK7 | P23T-E | Human | Esophagus | ESCC | 3.50e-15 | 2.01e-01 | 0.108 |
| 1022 | CDK7 | P24T-E | Human | Esophagus | ESCC | 2.07e-16 | 1.56e-01 | 0.1287 |
| 1022 | CDK7 | P26T-E | Human | Esophagus | ESCC | 2.55e-14 | 2.59e-01 | 0.1276 |
| 1022 | CDK7 | P27T-E | Human | Esophagus | ESCC | 5.44e-12 | 1.47e-01 | 0.1055 |
| Page: 1 2 3 4 5 |
| Tissue | Expression Dynamics | Abbreviation |
| Esophagus | 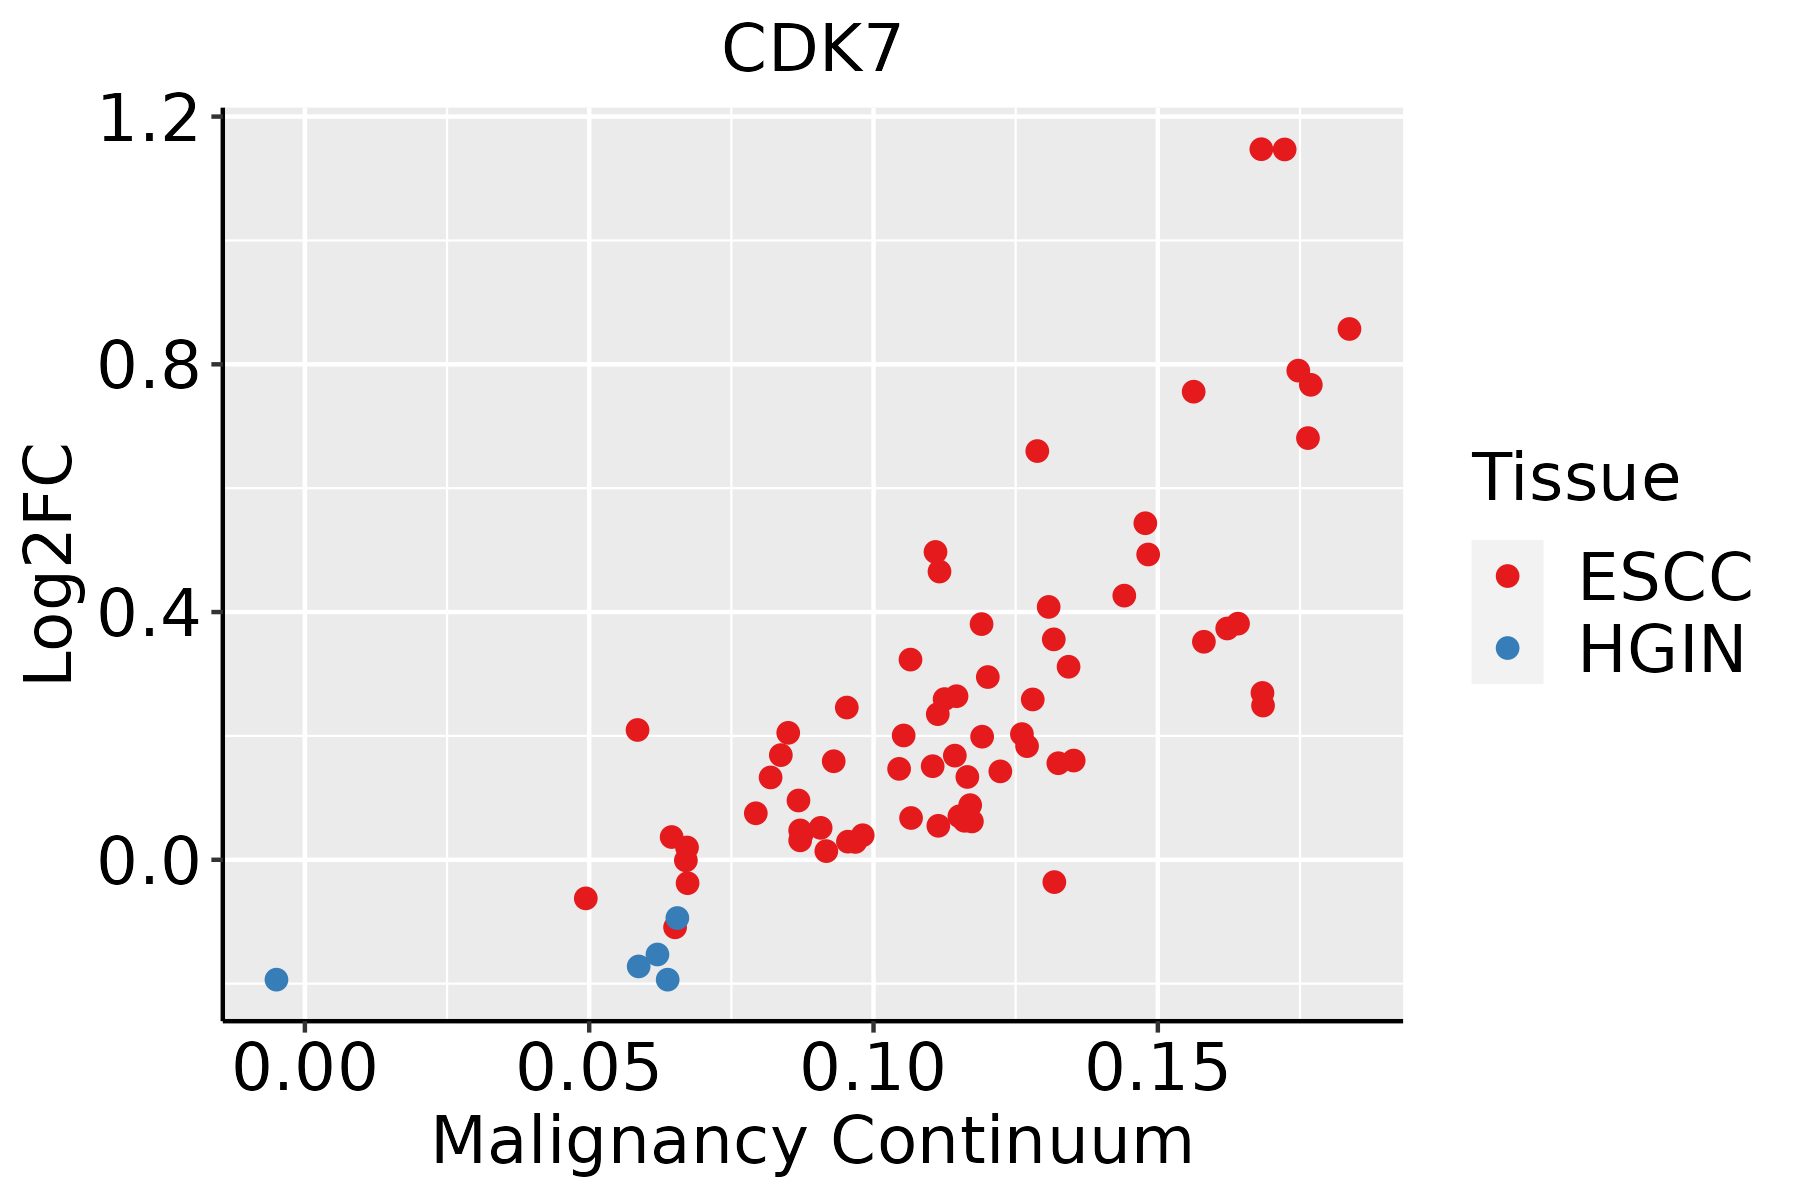 | ESCC: Esophageal squamous cell carcinoma |
| HGIN: High-grade intraepithelial neoplasias | ||
| LGIN: Low-grade intraepithelial neoplasias | ||
| Oral Cavity | 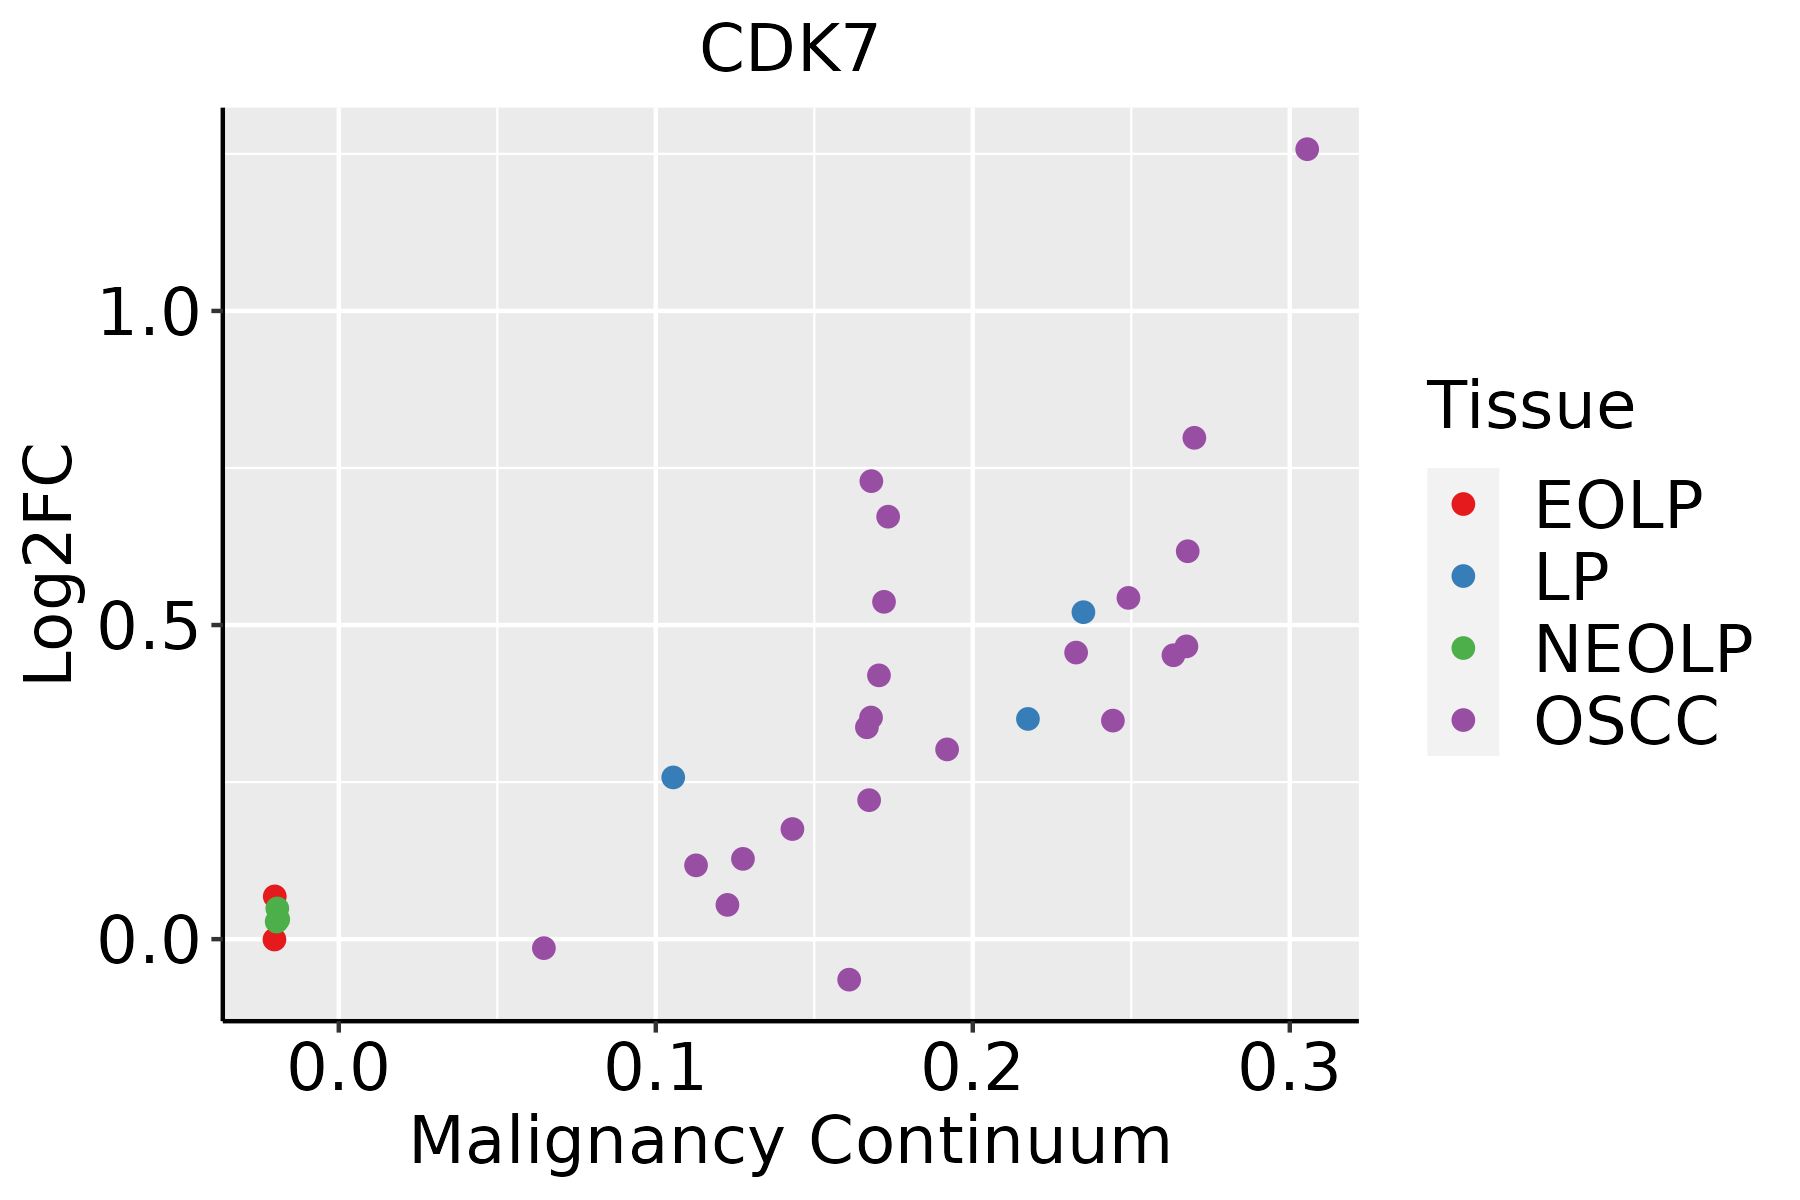 | EOLP: Erosive Oral lichen planus |
| LP: leukoplakia | ||
| NEOLP: Non-erosive oral lichen planus | ||
| OSCC: Oral squamous cell carcinoma | ||
| Skin | 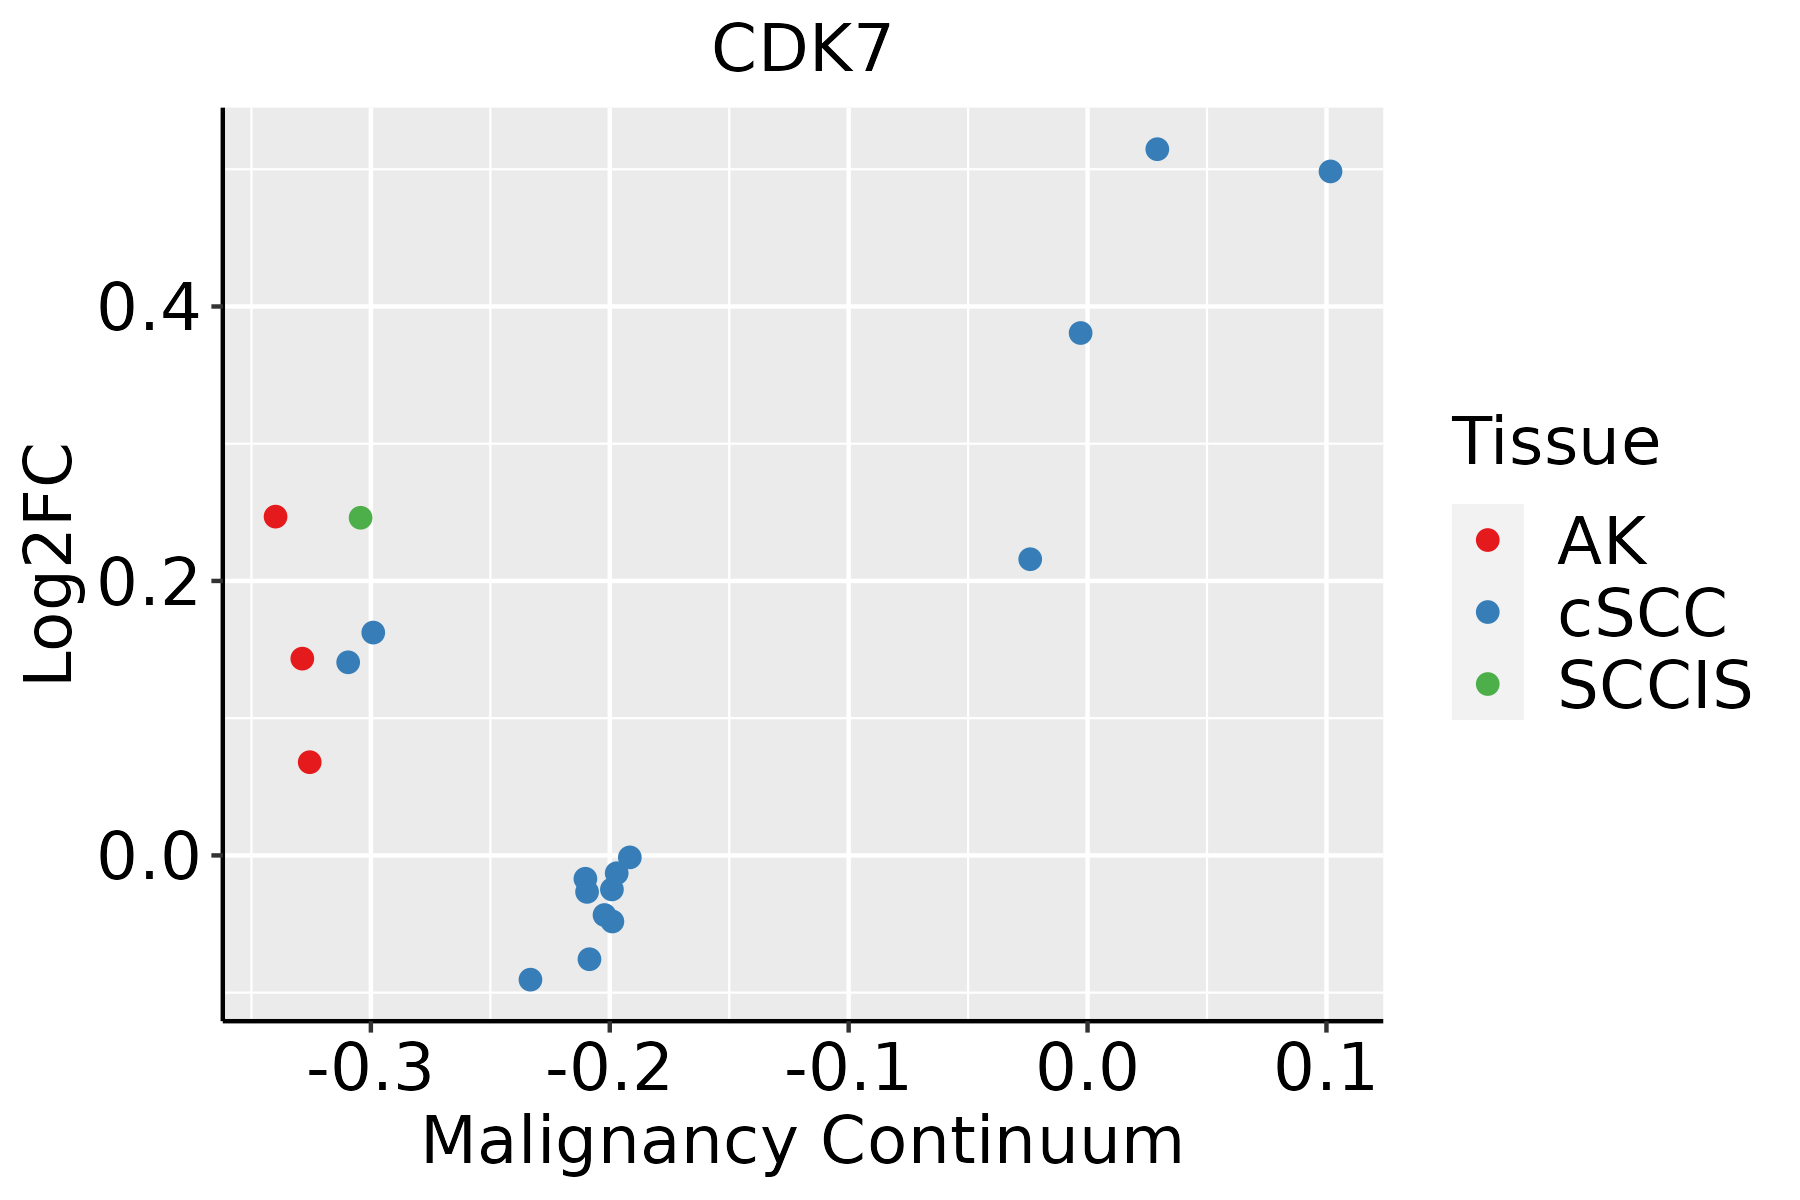 | AK: Actinic keratosis |
| cSCC: Cutaneous squamous cell carcinoma | ||
| SCCIS:squamous cell carcinoma in situ |
| ∗log2FC in expression of this searched gene in stem-like cells from each diseased tissue sample relative to stem-like cells in normal samples in each tissue plotted against the malignancy continuum. Samples are colored based on if they are from different disease stage. |
Top |
Malignant transformation related pathway analysis |
| Find out the enriched GO biological processes and KEGG pathways involved in transition from healthy to precancer to cancer |
| Tissue | Disease Stage | Enriched GO biological Processes |
| Colorectum | AD |  |
| Colorectum | SER |  |
| Colorectum | MSS |  |
| Colorectum | MSI-H |  |
| Colorectum | FAP |  |
| ∗Top 15 enriched GO BP terms are showed in the bar plot of each disease state in each tissue. Each row represents a significant GO biological process which is colored according to the -log10(p.adjust). |
| Page: 1 2 3 4 5 6 7 8 9 |
| GO ID | Tissue | Disease Stage | Description | Gene Ratio | Bg Ratio | pvalue | p.adjust | Count |
| GO:0031647111 | Esophagus | ESCC | regulation of protein stability | 223/8552 | 298/18723 | 5.76e-25 | 1.52e-22 | 223 |
| GO:0050821111 | Esophagus | ESCC | protein stabilization | 140/8552 | 191/18723 | 6.50e-15 | 3.61e-13 | 140 |
| GO:007190016 | Esophagus | ESCC | regulation of protein serine/threonine kinase activity | 227/8552 | 359/18723 | 1.12e-11 | 4.10e-10 | 227 |
| GO:00987812 | Esophagus | ESCC | ncRNA transcription | 45/8552 | 56/18723 | 1.05e-07 | 1.72e-06 | 45 |
| GO:19040294 | Esophagus | ESCC | regulation of cyclin-dependent protein kinase activity | 69/8552 | 98/18723 | 6.04e-07 | 7.91e-06 | 69 |
| GO:00000794 | Esophagus | ESCC | regulation of cyclin-dependent protein serine/threonine kinase activity | 66/8552 | 94/18723 | 1.24e-06 | 1.53e-05 | 66 |
| GO:00063673 | Esophagus | ESCC | transcription initiation from RNA polymerase II promoter | 56/8552 | 77/18723 | 1.30e-06 | 1.59e-05 | 56 |
| GO:000635211 | Esophagus | ESCC | DNA-templated transcription, initiation | 86/8552 | 130/18723 | 1.88e-06 | 2.19e-05 | 86 |
| GO:00708161 | Esophagus | ESCC | phosphorylation of RNA polymerase II C-terminal domain | 12/8552 | 12/18723 | 8.21e-05 | 6.01e-04 | 12 |
| GO:00093011 | Esophagus | ESCC | snRNA transcription | 16/8552 | 19/18723 | 6.45e-04 | 3.43e-03 | 16 |
| GO:00427951 | Esophagus | ESCC | snRNA transcription by RNA polymerase II | 13/8552 | 16/18723 | 4.05e-03 | 1.62e-02 | 13 |
| GO:003164720 | Oral cavity | OSCC | regulation of protein stability | 193/7305 | 298/18723 | 1.30e-19 | 1.95e-17 | 193 |
| GO:005082120 | Oral cavity | OSCC | protein stabilization | 122/7305 | 191/18723 | 2.69e-12 | 1.09e-10 | 122 |
| GO:007190010 | Oral cavity | OSCC | regulation of protein serine/threonine kinase activity | 201/7305 | 359/18723 | 3.90e-11 | 1.27e-09 | 201 |
| GO:19040293 | Oral cavity | OSCC | regulation of cyclin-dependent protein kinase activity | 60/7305 | 98/18723 | 6.90e-06 | 7.56e-05 | 60 |
| GO:00000793 | Oral cavity | OSCC | regulation of cyclin-dependent protein serine/threonine kinase activity | 58/7305 | 94/18723 | 6.92e-06 | 7.57e-05 | 58 |
| GO:00987811 | Oral cavity | OSCC | ncRNA transcription | 38/7305 | 56/18723 | 1.15e-05 | 1.18e-04 | 38 |
| GO:00063522 | Oral cavity | OSCC | DNA-templated transcription, initiation | 74/7305 | 130/18723 | 2.56e-05 | 2.39e-04 | 74 |
| GO:00063672 | Oral cavity | OSCC | transcription initiation from RNA polymerase II promoter | 46/7305 | 77/18723 | 1.82e-04 | 1.24e-03 | 46 |
| GO:0009301 | Oral cavity | OSCC | snRNA transcription | 13/7305 | 19/18723 | 9.07e-03 | 3.26e-02 | 13 |
| Page: 1 2 |
| Pathway ID | Tissue | Disease Stage | Description | Gene Ratio | Bg Ratio | pvalue | p.adjust | qvalue | Count |
| hsa0411023 | Esophagus | ESCC | Cell cycle | 126/4205 | 157/8465 | 1.34e-15 | 5.60e-14 | 2.87e-14 | 126 |
| hsa0342022 | Esophagus | ESCC | Nucleotide excision repair | 54/4205 | 63/8465 | 2.01e-09 | 2.17e-08 | 1.11e-08 | 54 |
| hsa030222 | Esophagus | ESCC | Basal transcription factors | 35/4205 | 45/8465 | 1.01e-04 | 4.06e-04 | 2.08e-04 | 35 |
| hsa0411033 | Esophagus | ESCC | Cell cycle | 126/4205 | 157/8465 | 1.34e-15 | 5.60e-14 | 2.87e-14 | 126 |
| hsa0342032 | Esophagus | ESCC | Nucleotide excision repair | 54/4205 | 63/8465 | 2.01e-09 | 2.17e-08 | 1.11e-08 | 54 |
| hsa0302211 | Esophagus | ESCC | Basal transcription factors | 35/4205 | 45/8465 | 1.01e-04 | 4.06e-04 | 2.08e-04 | 35 |
| hsa041108 | Oral cavity | OSCC | Cell cycle | 118/3704 | 157/8465 | 7.15e-16 | 2.66e-14 | 1.35e-14 | 118 |
| hsa034204 | Oral cavity | OSCC | Nucleotide excision repair | 49/3704 | 63/8465 | 3.48e-08 | 2.91e-07 | 1.48e-07 | 49 |
| hsa03022 | Oral cavity | OSCC | Basal transcription factors | 28/3704 | 45/8465 | 9.53e-03 | 2.11e-02 | 1.08e-02 | 28 |
| hsa0411015 | Oral cavity | OSCC | Cell cycle | 118/3704 | 157/8465 | 7.15e-16 | 2.66e-14 | 1.35e-14 | 118 |
| hsa0342011 | Oral cavity | OSCC | Nucleotide excision repair | 49/3704 | 63/8465 | 3.48e-08 | 2.91e-07 | 1.48e-07 | 49 |
| hsa030221 | Oral cavity | OSCC | Basal transcription factors | 28/3704 | 45/8465 | 9.53e-03 | 2.11e-02 | 1.08e-02 | 28 |
| Page: 1 |
Top |
Cell-cell communication analysis |
| Identification of potential cell-cell interactions between two cell types and their ligand-receptor pairs for different disease states |
| Ligand | Receptor | LRpair | Pathway | Tissue | Disease Stage |
| Page: 1 |
Top |
Single-cell gene regulatory network inference analysis |
| Find out the significant the regulons (TFs) and the target genes of each regulon across cell types for different disease states |
| TF | Cell Type | Tissue | Disease Stage | Target Gene | RSS | Regulon Activity |
| ∗The dot plots of a searched regulon are shown for all cell subpopulations in each disease state of each tissue based on the regulon specific score inferred using pySCENIC and by calculating the average expression. |
| Page: 1 |
Top |
Somatic mutation of malignant transformation related genes |
| Annotation of somatic variants for genes involved in malignant transformation |
| Hugo Symbol | Variant Class | Variant Classification | dbSNP RS | HGVSc | HGVSp | HGVSp Short | SWISSPROT | BIOTYPE | SIFT | PolyPhen | Tumor Sample Barcode | Tissue | Histology | Sex | Age | Stage | Therapy Types | Drugs | Outcome |
| CDK7 | SNV | Missense_Mutation | c.274N>A | p.Asp92Asn | p.D92N | P50613 | protein_coding | deleterious(0.03) | possibly_damaging(0.907) | TCGA-A8-A09N-01 | Breast | breast invasive carcinoma | Female | <65 | III/IV | Unknown | Unknown | SD | |
| CDK7 | SNV | Missense_Mutation | c.658G>C | p.Asp220His | p.D220H | P50613 | protein_coding | deleterious(0.02) | probably_damaging(0.988) | TCGA-BH-A0DI-01 | Breast | breast invasive carcinoma | Female | <65 | I/II | Chemotherapy | adriamycin | CR | |
| CDK7 | SNV | Missense_Mutation | c.715N>C | p.Asp239His | p.D239H | P50613 | protein_coding | tolerated(0.08) | benign(0.001) | TCGA-D8-A1JA-01 | Breast | breast invasive carcinoma | Female | <65 | III/IV | Chemotherapy | adriamycin | PD | |
| CDK7 | SNV | Missense_Mutation | novel | c.799G>A | p.Asp267Asn | p.D267N | P50613 | protein_coding | deleterious(0) | probably_damaging(0.987) | TCGA-2W-A8YY-01 | Cervix | cervical & endocervical cancer | Female | <65 | I/II | Chemotherapy | cisplatin | CR |
| CDK7 | SNV | Missense_Mutation | novel | c.367C>G | p.Gln123Glu | p.Q123E | P50613 | protein_coding | tolerated(0.09) | benign(0.048) | TCGA-C5-A8YR-01 | Cervix | cervical & endocervical cancer | Female | <65 | I/II | Unknown | Unknown | PD |
| CDK7 | SNV | Missense_Mutation | c.388N>A | p.Gln130Lys | p.Q130K | P50613 | protein_coding | tolerated(0.95) | benign(0.003) | TCGA-AA-3712-01 | Colorectum | colon adenocarcinoma | Male | >=65 | III/IV | Unknown | Unknown | SD | |
| CDK7 | SNV | Missense_Mutation | rs866887561 | c.475N>A | p.Ala159Thr | p.A159T | P50613 | protein_coding | deleterious(0) | probably_damaging(1) | TCGA-AA-3947-01 | Colorectum | colon adenocarcinoma | Female | <65 | I/II | Unknown | Unknown | SD |
| CDK7 | SNV | Missense_Mutation | c.116C>T | p.Ala39Val | p.A39V | P50613 | protein_coding | deleterious(0) | probably_damaging(1) | TCGA-AA-3977-01 | Colorectum | colon adenocarcinoma | Male | >=65 | I/II | Unknown | Unknown | SD | |
| CDK7 | SNV | Missense_Mutation | novel | c.20N>A | p.Ser7Tyr | p.S7Y | P50613 | protein_coding | deleterious(0.01) | benign(0.342) | TCGA-AA-A010-01 | Colorectum | colon adenocarcinoma | Female | <65 | I/II | Chemotherapy | folinic | CR |
| CDK7 | SNV | Missense_Mutation | novel | c.314N>C | p.Asn105Thr | p.N105T | P50613 | protein_coding | tolerated(0.48) | benign(0.003) | TCGA-CA-6717-01 | Colorectum | colon adenocarcinoma | Male | <65 | I/II | Chemotherapy | oxaliplatin | CR |
| Page: 1 2 3 4 |
Top |
Related drugs of malignant transformation related genes |
| Identification of chemicals and drugs interact with genes involved in malignant transfromation |
| (DGIdb 4.0) |
| Entrez ID | Symbol | Category | Interaction Types | Drug Claim Name | Drug Name | PMIDs |
| 1022 | CDK7 | DRUGGABLE GENOME, KINASE, SERINE THREONINE KINASE, TUMOR SUPPRESSOR, DNA REPAIR, TRANSCRIPTION FACTOR, ENZYME | inhibitor | SNS-032 | BMS-387032 | |
| 1022 | CDK7 | DRUGGABLE GENOME, KINASE, SERINE THREONINE KINASE, TUMOR SUPPRESSOR, DNA REPAIR, TRANSCRIPTION FACTOR, ENZYME | Oxazolyl methylthiothiazole derivative 1 | |||
| 1022 | CDK7 | DRUGGABLE GENOME, KINASE, SERINE THREONINE KINASE, TUMOR SUPPRESSOR, DNA REPAIR, TRANSCRIPTION FACTOR, ENZYME | inhibitor | CHEMBL1944698 | ZOTIRACICLIB | |
| 1022 | CDK7 | DRUGGABLE GENOME, KINASE, SERINE THREONINE KINASE, TUMOR SUPPRESSOR, DNA REPAIR, TRANSCRIPTION FACTOR, ENZYME | inhibitor | SELICICLIB | SELICICLIB | |
| 1022 | CDK7 | DRUGGABLE GENOME, KINASE, SERINE THREONINE KINASE, TUMOR SUPPRESSOR, DNA REPAIR, TRANSCRIPTION FACTOR, ENZYME | SELICICLIB | SELICICLIB | ||
| 1022 | CDK7 | DRUGGABLE GENOME, KINASE, SERINE THREONINE KINASE, TUMOR SUPPRESSOR, DNA REPAIR, TRANSCRIPTION FACTOR, ENZYME | inhibitor | CHEMBL296468 | BMS-387032 | |
| 1022 | CDK7 | DRUGGABLE GENOME, KINASE, SERINE THREONINE KINASE, TUMOR SUPPRESSOR, DNA REPAIR, TRANSCRIPTION FACTOR, ENZYME | inhibitor | 178102568 | ||
| 1022 | CDK7 | DRUGGABLE GENOME, KINASE, SERINE THREONINE KINASE, TUMOR SUPPRESSOR, DNA REPAIR, TRANSCRIPTION FACTOR, ENZYME | Pyrazolo-triazine derivative 2 | |||
| 1022 | CDK7 | DRUGGABLE GENOME, KINASE, SERINE THREONINE KINASE, TUMOR SUPPRESSOR, DNA REPAIR, TRANSCRIPTION FACTOR, ENZYME | inhibitor | 387065624 | ||
| 1022 | CDK7 | DRUGGABLE GENOME, KINASE, SERINE THREONINE KINASE, TUMOR SUPPRESSOR, DNA REPAIR, TRANSCRIPTION FACTOR, ENZYME | ENTRECTINIB | ENTRECTINIB |
| Page: 1 2 3 4 5 6 |

Copyright 2023-Present -The University of Texas Health Science Center at Houston |