
|
|||||
|
 | |
| |
| |
| |
| |
| |
|
Gene: CDK6 |
Gene summary for CDK6 |
| Gene information | Species | Human | Gene symbol | CDK6 | Gene ID | 1021 |
| Gene name | cyclin dependent kinase 6 | |
| Gene Alias | MCPH12 | |
| Cytomap | 7q21.2 | |
| Gene Type | protein-coding | GO ID | GO:0000082 | UniProtAcc | Q00534 |
Top |
Malignant transformation analysis |
| Identification of the aberrant gene expression in precancerous and cancerous lesions by comparing the gene expression of stem-like cells in diseased tissues with normal stem cells |
| Entrez ID | Symbol | Replicates | Species | Organ | Tissue | Adj P-value | Log2FC | Malignancy |
| 1021 | CDK6 | HTA11_3410_2000001011 | Human | Colorectum | AD | 1.50e-28 | -7.37e-01 | 0.0155 |
| 1021 | CDK6 | HTA11_2487_2000001011 | Human | Colorectum | SER | 2.63e-20 | -9.28e-01 | -0.1808 |
| 1021 | CDK6 | HTA11_2112_2000001011 | Human | Colorectum | SER | 1.01e-03 | -8.96e-01 | -0.2196 |
| 1021 | CDK6 | HTA11_3361_2000001011 | Human | Colorectum | AD | 1.28e-19 | -9.63e-01 | -0.1207 |
| 1021 | CDK6 | HTA11_83_2000001011 | Human | Colorectum | SER | 3.53e-13 | -9.09e-01 | -0.1526 |
| 1021 | CDK6 | HTA11_696_2000001011 | Human | Colorectum | AD | 2.58e-24 | -6.62e-01 | -0.1464 |
| 1021 | CDK6 | HTA11_866_2000001011 | Human | Colorectum | AD | 2.63e-22 | -6.97e-01 | -0.1001 |
| 1021 | CDK6 | HTA11_1391_2000001011 | Human | Colorectum | AD | 7.07e-03 | -4.20e-01 | -0.059 |
| 1021 | CDK6 | HTA11_2992_2000001011 | Human | Colorectum | SER | 1.15e-03 | -8.07e-01 | -0.1706 |
| 1021 | CDK6 | HTA11_5212_2000001011 | Human | Colorectum | AD | 2.23e-10 | -1.01e+00 | -0.2061 |
| 1021 | CDK6 | HTA11_5216_2000001011 | Human | Colorectum | SER | 3.85e-05 | -8.77e-01 | -0.1462 |
| 1021 | CDK6 | HTA11_866_3004761011 | Human | Colorectum | AD | 1.77e-02 | -4.04e-01 | 0.096 |
| 1021 | CDK6 | HTA11_10711_2000001011 | Human | Colorectum | AD | 3.36e-04 | -5.34e-01 | 0.0338 |
| 1021 | CDK6 | HTA11_7696_3000711011 | Human | Colorectum | AD | 1.35e-12 | -5.16e-01 | 0.0674 |
| 1021 | CDK6 | HTA11_6818_2000001011 | Human | Colorectum | AD | 1.88e-03 | -5.51e-01 | 0.0112 |
| 1021 | CDK6 | HTA11_99999971662_82457 | Human | Colorectum | MSS | 1.03e-02 | -3.11e-01 | 0.3859 |
| 1021 | CDK6 | HTA11_99999973899_84307 | Human | Colorectum | MSS | 3.31e-15 | -1.01e+00 | 0.2585 |
| 1021 | CDK6 | HTA11_99999974143_84620 | Human | Colorectum | MSS | 1.48e-48 | -9.77e-01 | 0.3005 |
| 1021 | CDK6 | F007 | Human | Colorectum | FAP | 1.84e-06 | -5.67e-01 | 0.1176 |
| 1021 | CDK6 | A001-C-207 | Human | Colorectum | FAP | 4.40e-11 | -6.23e-01 | 0.1278 |
| Page: 1 2 3 4 5 6 7 8 9 10 |
| Tissue | Expression Dynamics | Abbreviation |
| Colorectum (GSE201348) |  | FAP: Familial adenomatous polyposis |
| CRC: Colorectal cancer | ||
| Colorectum (HTA11) |  | AD: Adenomas |
| SER: Sessile serrated lesions | ||
| MSI-H: Microsatellite-high colorectal cancer | ||
| MSS: Microsatellite stable colorectal cancer | ||
| Esophagus | 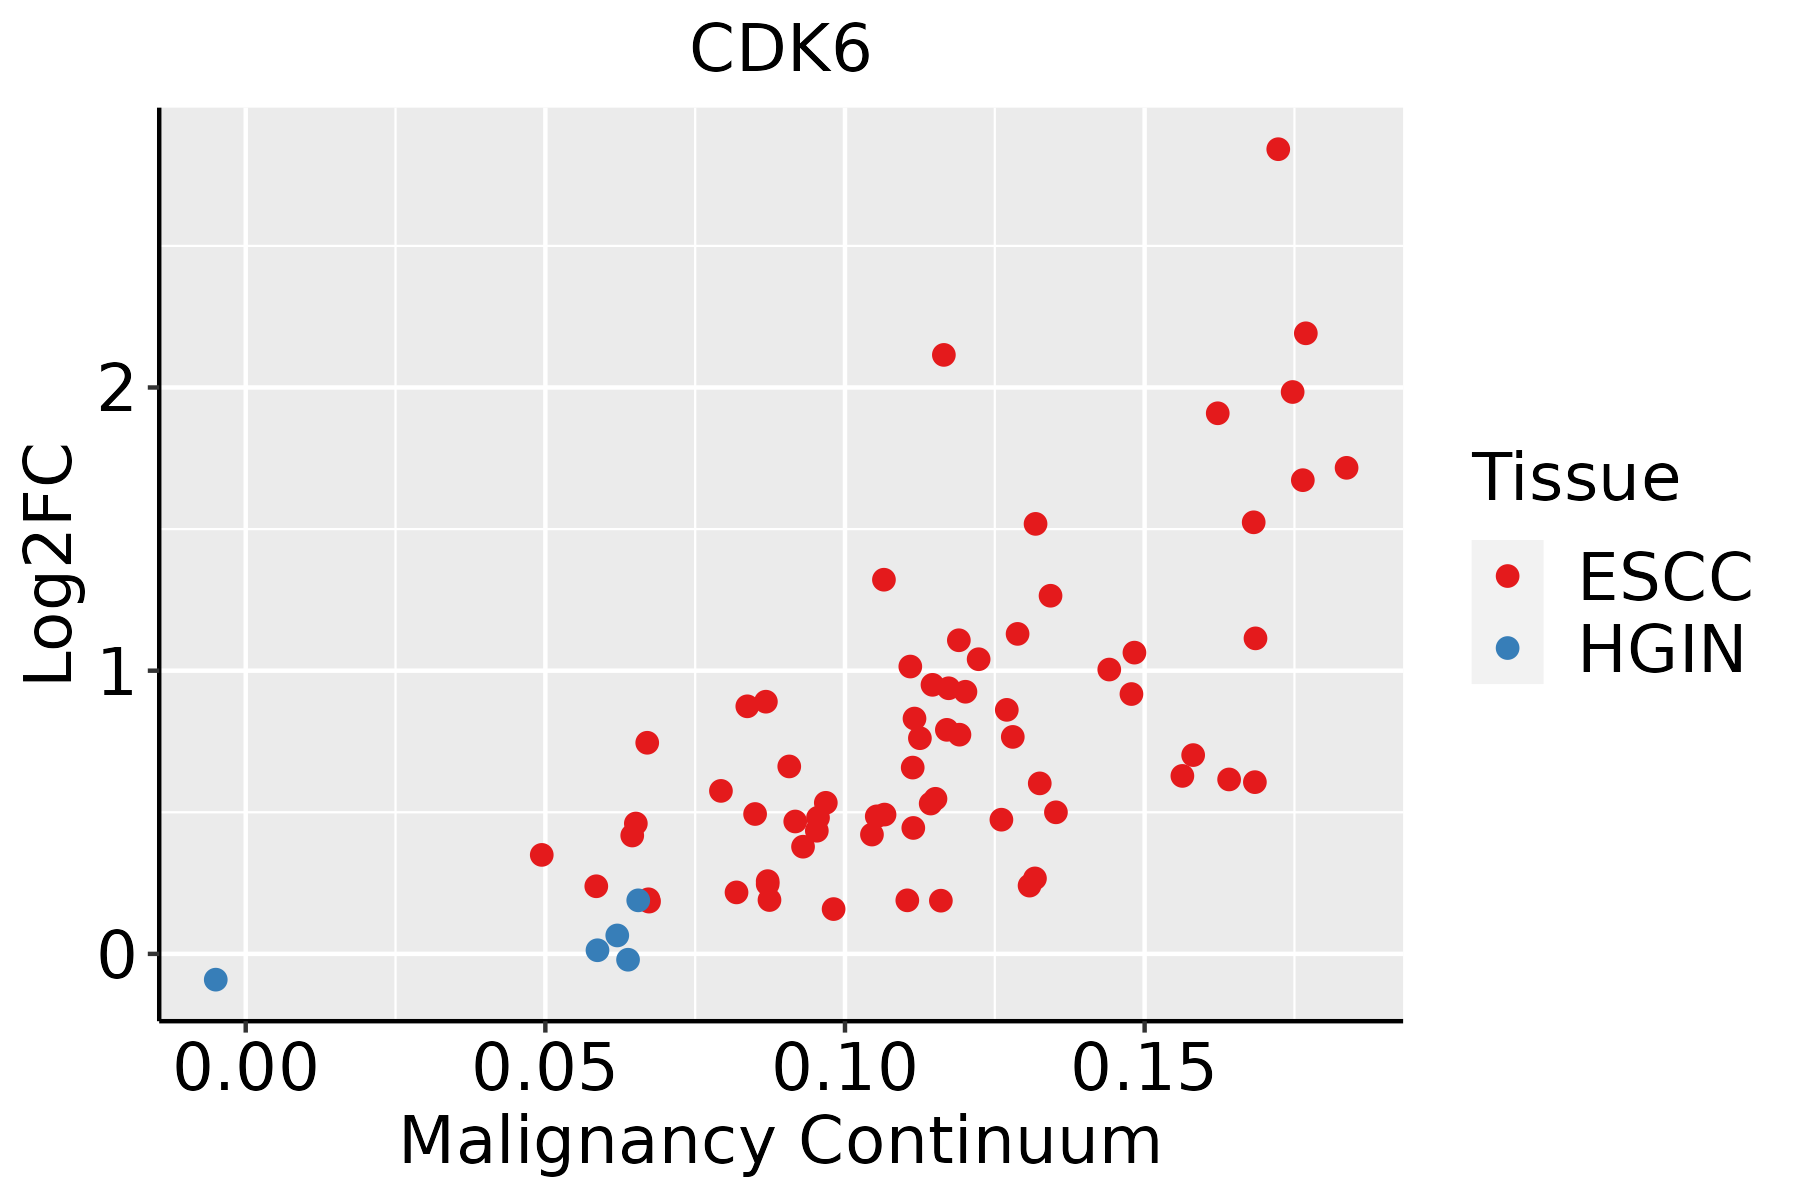 | ESCC: Esophageal squamous cell carcinoma |
| HGIN: High-grade intraepithelial neoplasias | ||
| LGIN: Low-grade intraepithelial neoplasias | ||
| GC |  | CAG: Chronic atrophic gastritis |
| CAG with IM: Chronic atrophic gastritis with intestinal metaplasia | ||
| CSG: Chronic superficial gastritis | ||
| GC: Gastric cancer | ||
| SIM: Severe intestinal metaplasia | ||
| WIM: Wild intestinal metaplasia | ||
| Liver | 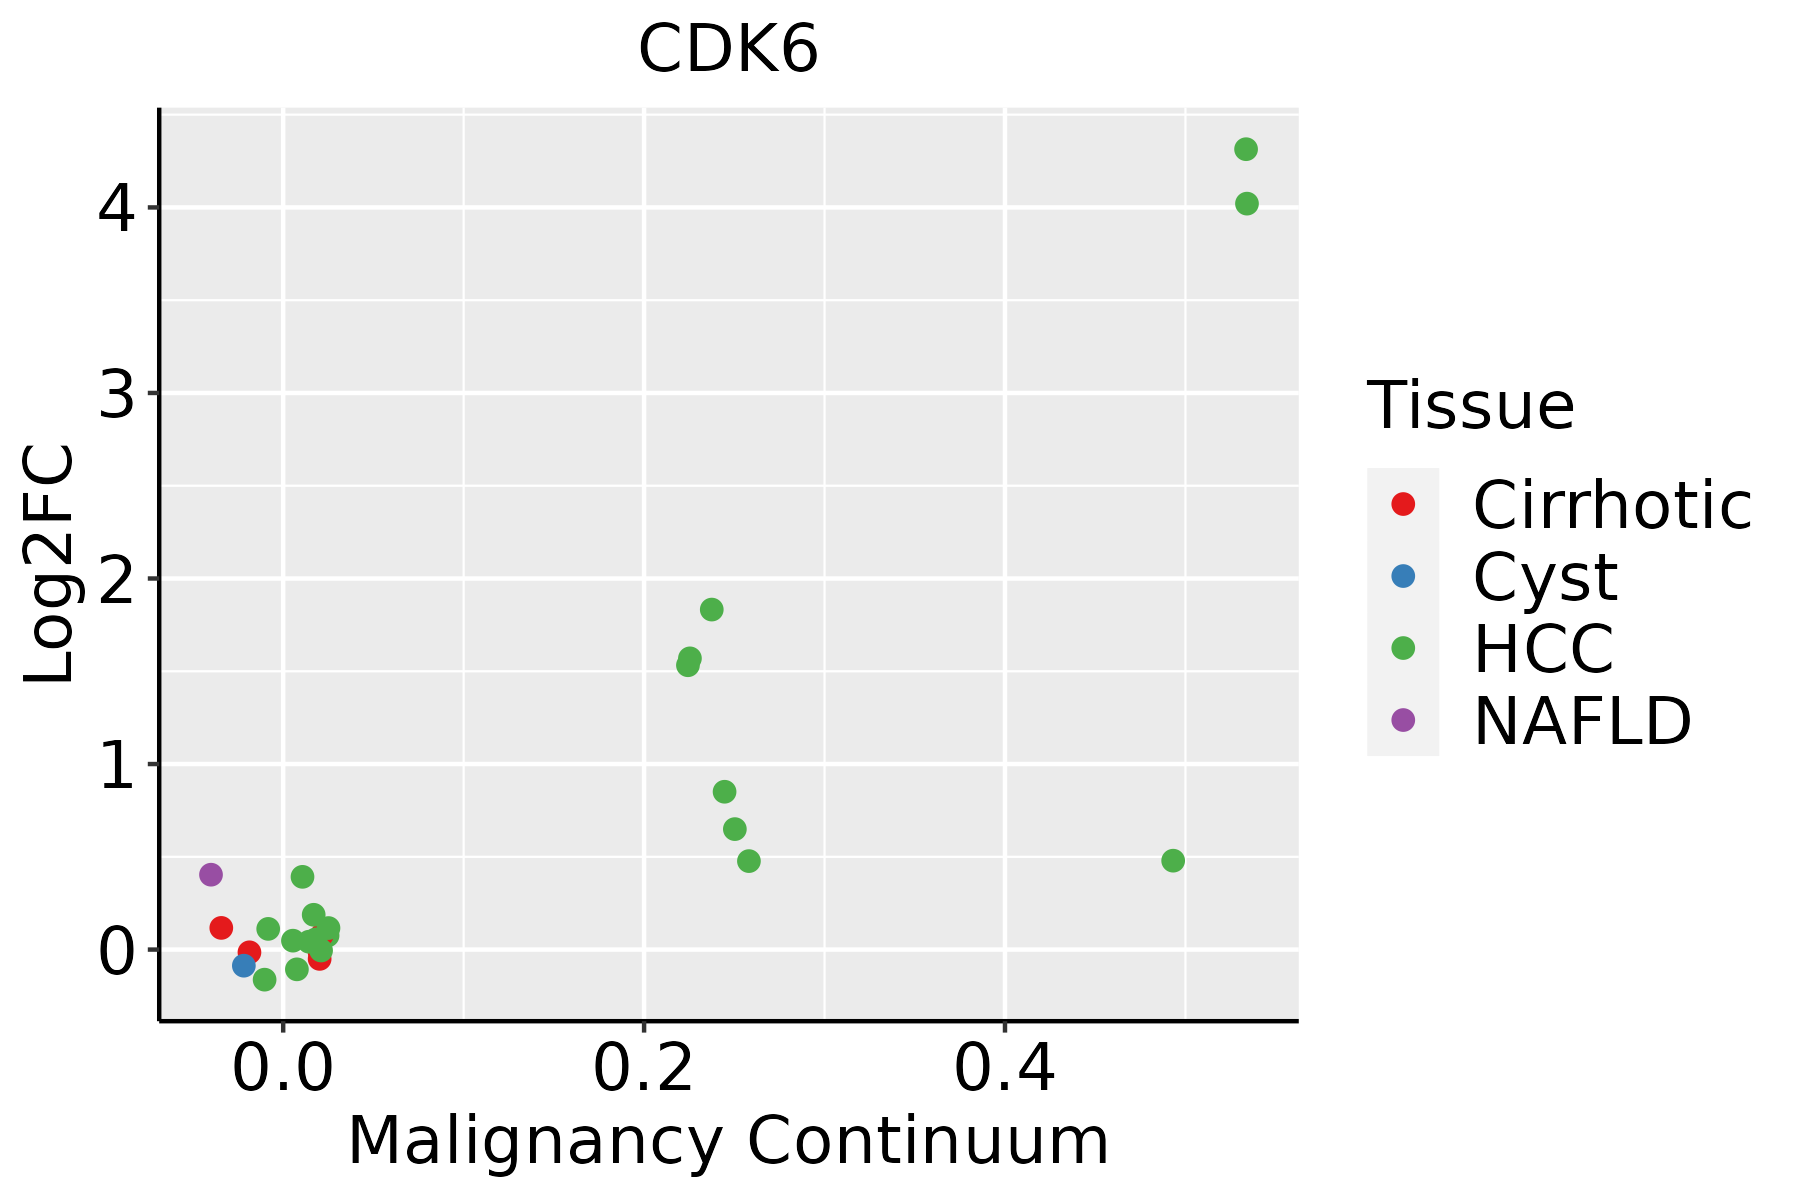 | HCC: Hepatocellular carcinoma |
| NAFLD: Non-alcoholic fatty liver disease | ||
| Oral Cavity | 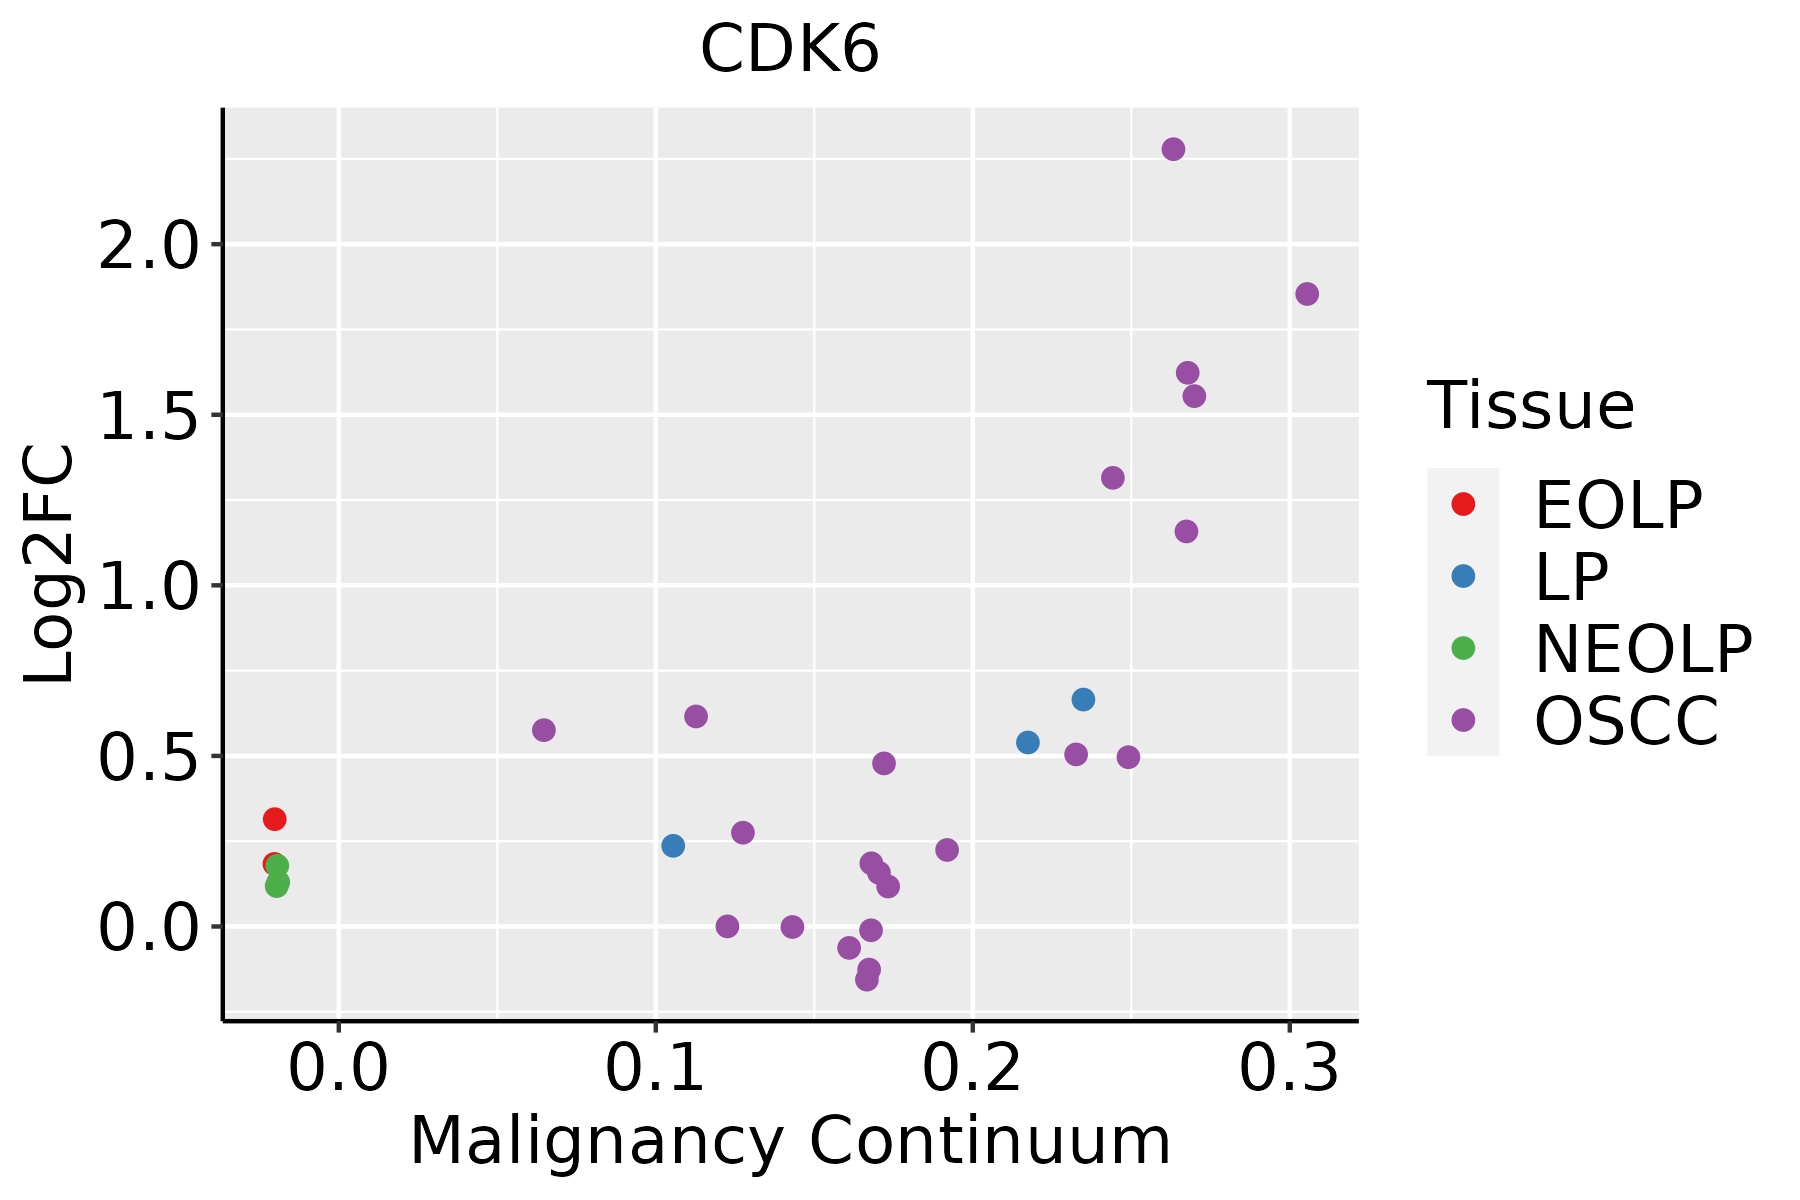 | EOLP: Erosive Oral lichen planus |
| LP: leukoplakia | ||
| NEOLP: Non-erosive oral lichen planus | ||
| OSCC: Oral squamous cell carcinoma | ||
| Prostate | 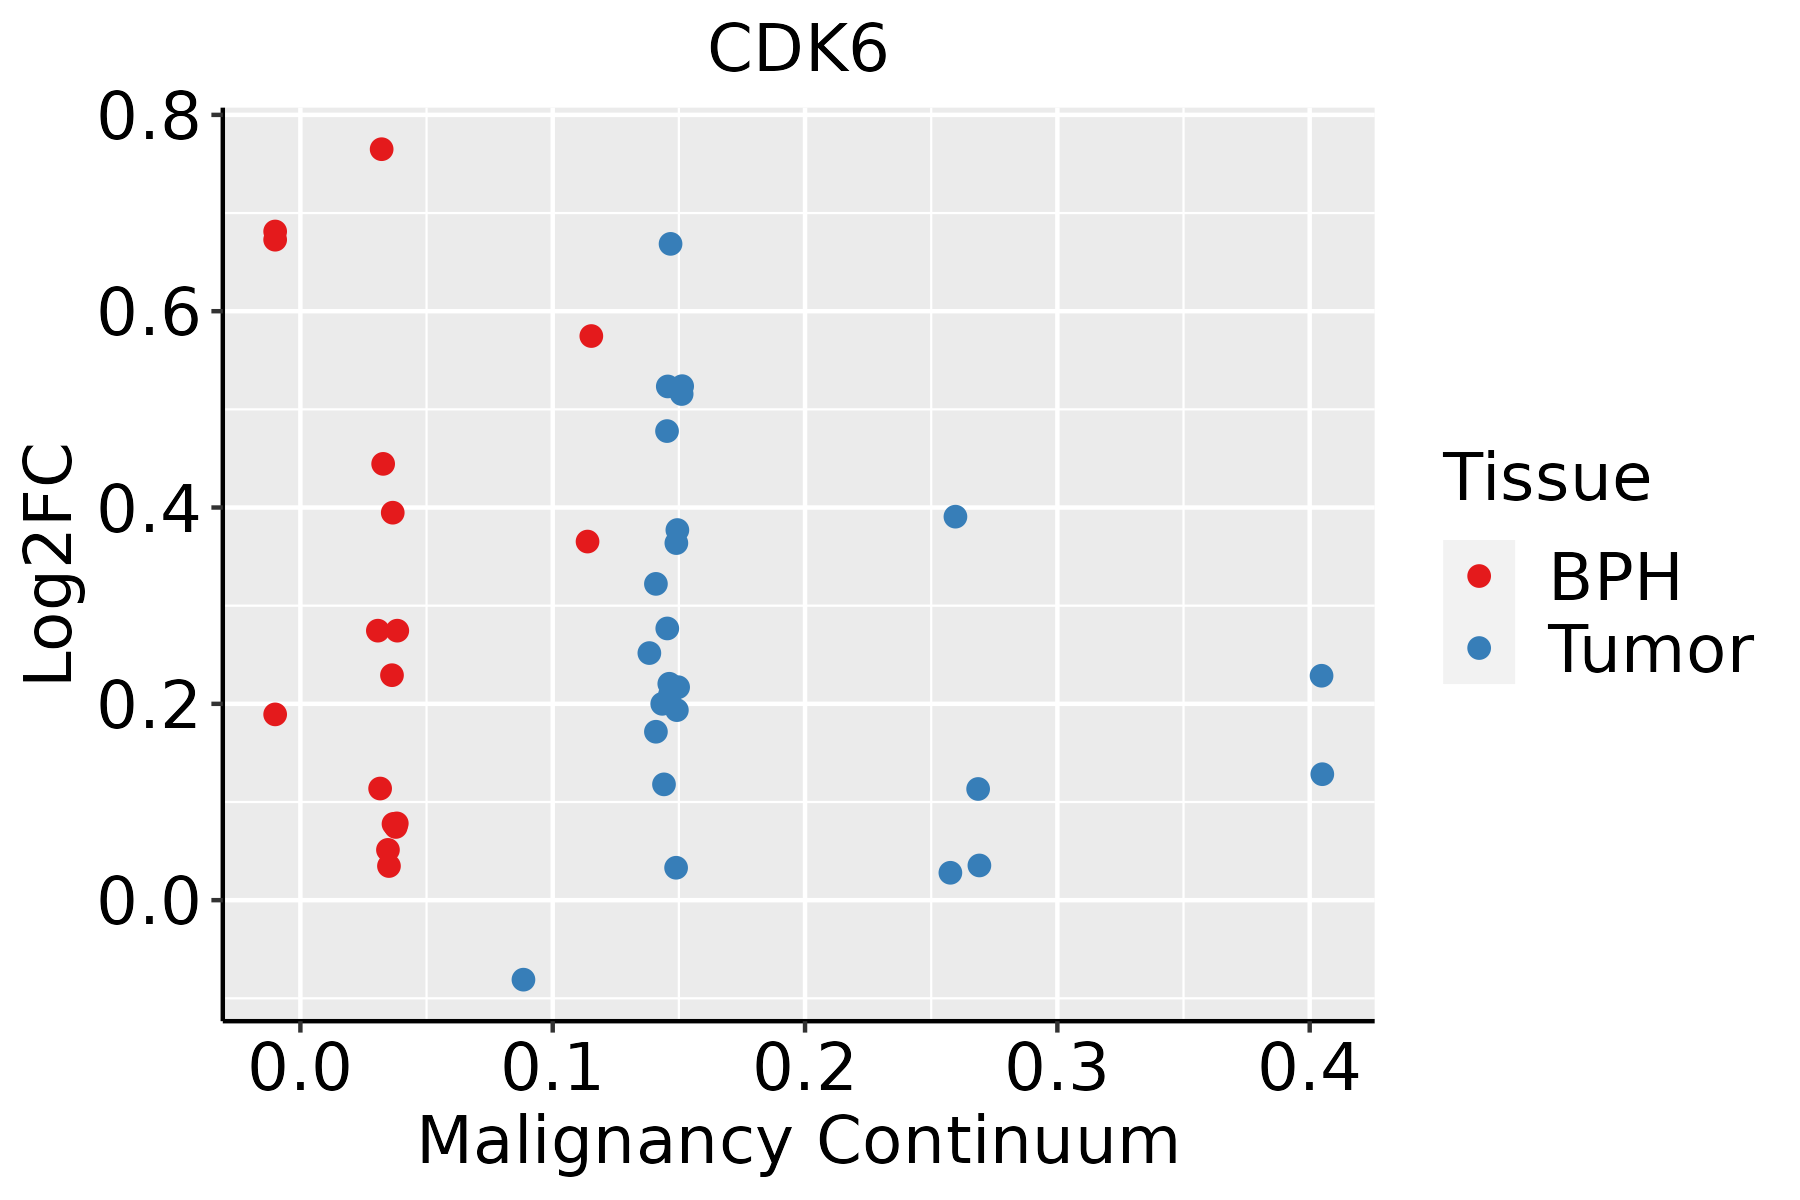 | BPH: Benign Prostatic Hyperplasia |
| Skin | 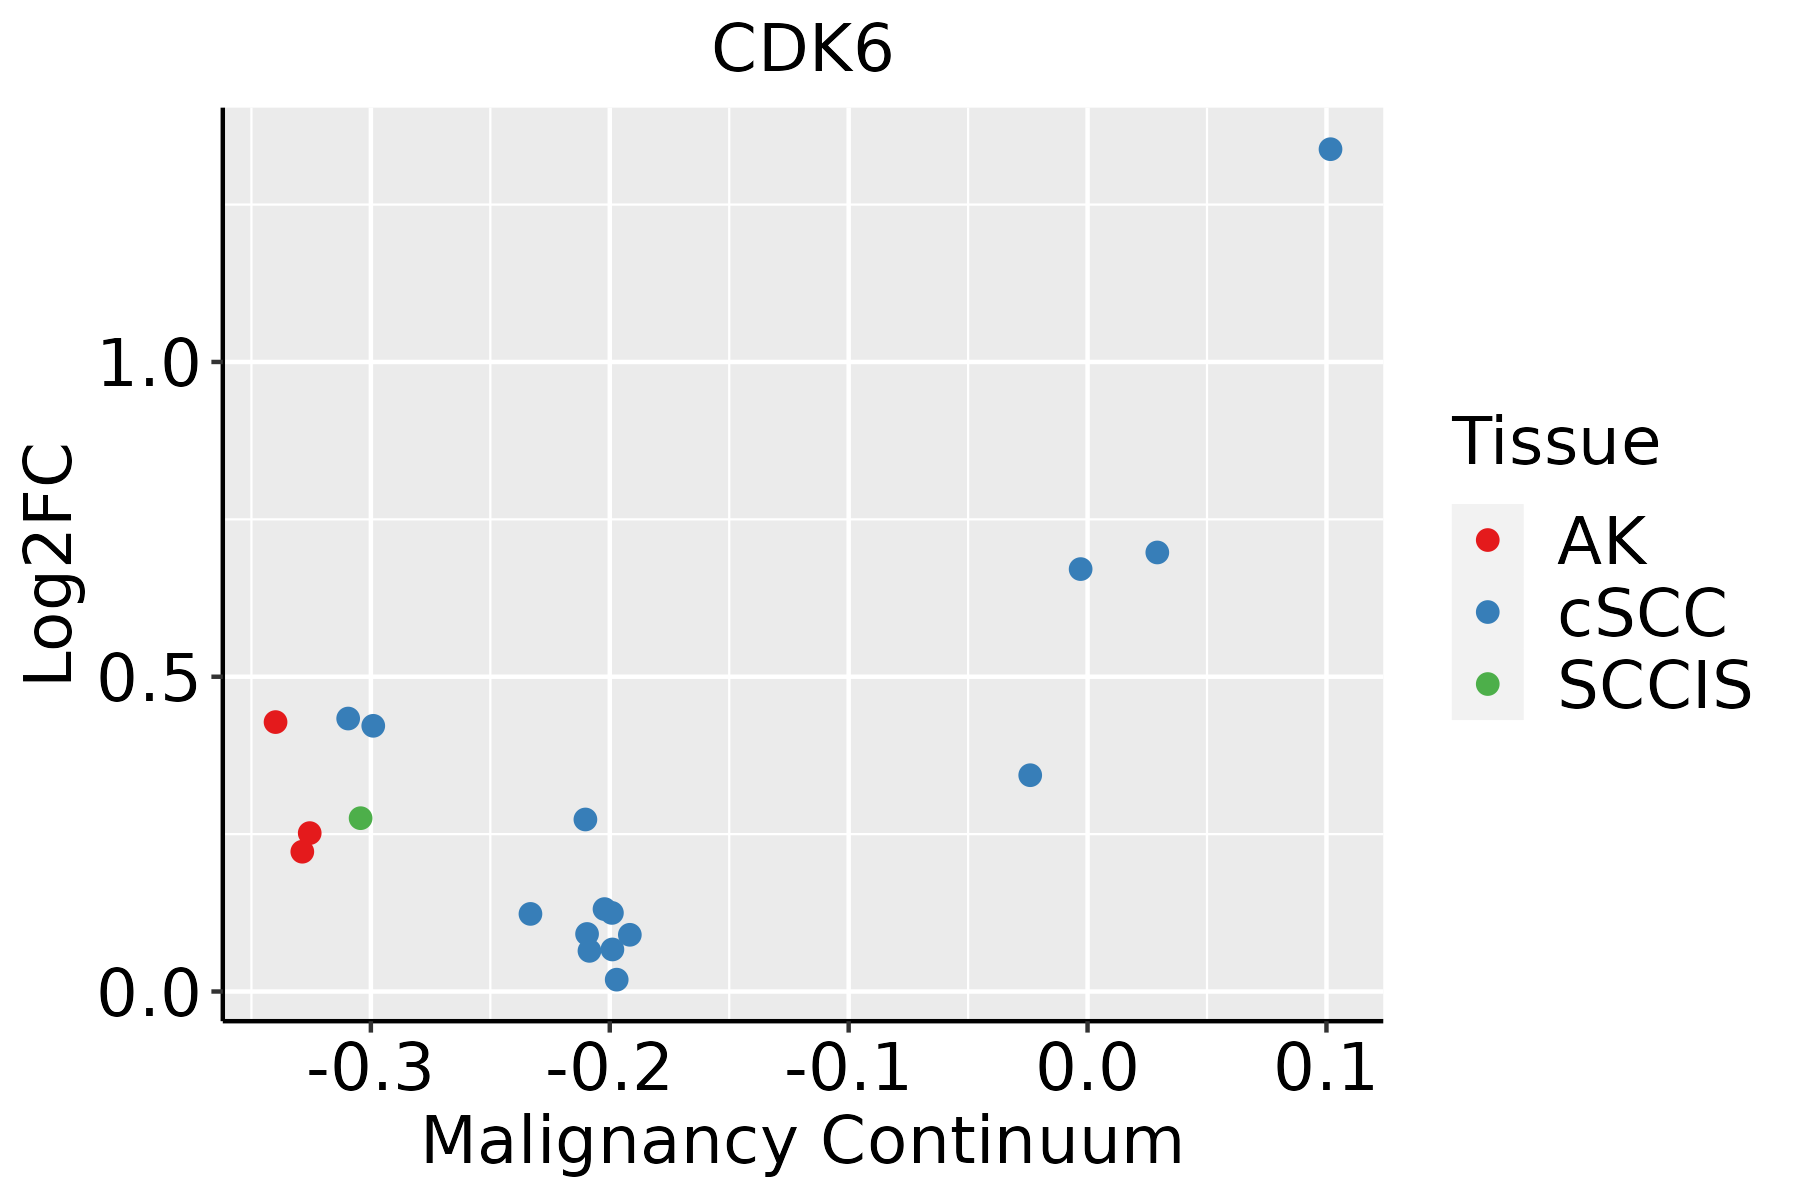 | AK: Actinic keratosis |
| cSCC: Cutaneous squamous cell carcinoma | ||
| SCCIS:squamous cell carcinoma in situ | ||
| Thyroid |  | ATC: Anaplastic thyroid cancer |
| HT: Hashimoto's thyroiditis | ||
| PTC: Papillary thyroid cancer |
| ∗log2FC in expression of this searched gene in stem-like cells from each diseased tissue sample relative to stem-like cells in normal samples in each tissue plotted against the malignancy continuum. Samples are colored based on if they are from different disease stage. |
Top |
Malignant transformation related pathway analysis |
| Find out the enriched GO biological processes and KEGG pathways involved in transition from healthy to precancer to cancer |
| Tissue | Disease Stage | Enriched GO biological Processes |
| Colorectum | AD |  |
| Colorectum | SER |  |
| Colorectum | MSS |  |
| Colorectum | MSI-H |  |
| Colorectum | FAP |  |
| ∗Top 15 enriched GO BP terms are showed in the bar plot of each disease state in each tissue. Each row represents a significant GO biological process which is colored according to the -log10(p.adjust). |
| Page: 1 2 3 4 5 6 7 8 9 |
| GO ID | Tissue | Disease Stage | Description | Gene Ratio | Bg Ratio | pvalue | p.adjust | Count |
| GO:0002064 | Colorectum | AD | epithelial cell development | 89/3918 | 220/18723 | 2.98e-11 | 3.52e-09 | 89 |
| GO:0010811 | Colorectum | AD | positive regulation of cell-substrate adhesion | 53/3918 | 123/18723 | 2.30e-08 | 1.27e-06 | 53 |
| GO:0010810 | Colorectum | AD | regulation of cell-substrate adhesion | 81/3918 | 221/18723 | 4.80e-08 | 2.55e-06 | 81 |
| GO:0031589 | Colorectum | AD | cell-substrate adhesion | 116/3918 | 363/18723 | 4.68e-07 | 1.76e-05 | 116 |
| GO:0034101 | Colorectum | AD | erythrocyte homeostasis | 51/3918 | 129/18723 | 1.07e-06 | 3.59e-05 | 51 |
| GO:0030099 | Colorectum | AD | myeloid cell differentiation | 119/3918 | 381/18723 | 1.24e-06 | 4.01e-05 | 119 |
| GO:0001952 | Colorectum | AD | regulation of cell-matrix adhesion | 50/3918 | 128/18723 | 2.05e-06 | 6.05e-05 | 50 |
| GO:0002262 | Colorectum | AD | myeloid cell homeostasis | 57/3918 | 157/18723 | 6.17e-06 | 1.56e-04 | 57 |
| GO:0001954 | Colorectum | AD | positive regulation of cell-matrix adhesion | 27/3918 | 58/18723 | 1.12e-05 | 2.55e-04 | 27 |
| GO:0048872 | Colorectum | AD | homeostasis of number of cells | 87/3918 | 272/18723 | 1.16e-05 | 2.61e-04 | 87 |
| GO:0030218 | Colorectum | AD | erythrocyte differentiation | 45/3918 | 120/18723 | 2.22e-05 | 4.39e-04 | 45 |
| GO:0007160 | Colorectum | AD | cell-matrix adhesion | 75/3918 | 233/18723 | 3.56e-05 | 6.45e-04 | 75 |
| GO:0045785 | Colorectum | AD | positive regulation of cell adhesion | 122/3918 | 437/18723 | 2.65e-04 | 3.28e-03 | 122 |
| GO:0007568 | Colorectum | AD | aging | 98/3918 | 339/18723 | 2.77e-04 | 3.39e-03 | 98 |
| GO:0001649 | Colorectum | AD | osteoblast differentiation | 70/3918 | 229/18723 | 3.59e-04 | 4.18e-03 | 70 |
| GO:0030224 | Colorectum | AD | monocyte differentiation | 17/3918 | 36/18723 | 3.79e-04 | 4.36e-03 | 17 |
| GO:0045646 | Colorectum | AD | regulation of erythrocyte differentiation | 20/3918 | 47/18723 | 6.54e-04 | 6.75e-03 | 20 |
| GO:0050673 | Colorectum | AD | epithelial cell proliferation | 119/3918 | 437/18723 | 8.75e-04 | 8.51e-03 | 119 |
| GO:1903706 | Colorectum | AD | regulation of hemopoiesis | 99/3918 | 367/18723 | 3.08e-03 | 2.28e-02 | 99 |
| GO:0045637 | Colorectum | AD | regulation of myeloid cell differentiation | 61/3918 | 210/18723 | 3.17e-03 | 2.35e-02 | 61 |
| Page: 1 2 3 4 5 6 7 8 9 10 11 12 13 14 15 16 17 18 19 20 21 22 23 24 25 26 27 28 29 30 |
| Pathway ID | Tissue | Disease Stage | Description | Gene Ratio | Bg Ratio | pvalue | p.adjust | qvalue | Count |
| hsa05220 | Colorectum | AD | Chronic myeloid leukemia | 31/2092 | 76/8465 | 1.41e-03 | 8.46e-03 | 5.39e-03 | 31 |
| hsa05225 | Colorectum | AD | Hepatocellular carcinoma | 59/2092 | 168/8465 | 1.50e-03 | 8.69e-03 | 5.54e-03 | 59 |
| hsa05163 | Colorectum | AD | Human cytomegalovirus infection | 75/2092 | 225/8465 | 2.00e-03 | 1.10e-02 | 7.01e-03 | 75 |
| hsa05160 | Colorectum | AD | Hepatitis C | 54/2092 | 157/8465 | 3.87e-03 | 1.96e-02 | 1.25e-02 | 54 |
| hsa04218 | Colorectum | AD | Cellular senescence | 53/2092 | 156/8465 | 5.55e-03 | 2.48e-02 | 1.58e-02 | 53 |
| hsa05212 | Colorectum | AD | Pancreatic cancer | 29/2092 | 76/8465 | 6.25e-03 | 2.68e-02 | 1.71e-02 | 29 |
| hsa052201 | Colorectum | AD | Chronic myeloid leukemia | 31/2092 | 76/8465 | 1.41e-03 | 8.46e-03 | 5.39e-03 | 31 |
| hsa052251 | Colorectum | AD | Hepatocellular carcinoma | 59/2092 | 168/8465 | 1.50e-03 | 8.69e-03 | 5.54e-03 | 59 |
| hsa051631 | Colorectum | AD | Human cytomegalovirus infection | 75/2092 | 225/8465 | 2.00e-03 | 1.10e-02 | 7.01e-03 | 75 |
| hsa051601 | Colorectum | AD | Hepatitis C | 54/2092 | 157/8465 | 3.87e-03 | 1.96e-02 | 1.25e-02 | 54 |
| hsa042181 | Colorectum | AD | Cellular senescence | 53/2092 | 156/8465 | 5.55e-03 | 2.48e-02 | 1.58e-02 | 53 |
| hsa052121 | Colorectum | AD | Pancreatic cancer | 29/2092 | 76/8465 | 6.25e-03 | 2.68e-02 | 1.71e-02 | 29 |
| hsa051632 | Colorectum | SER | Human cytomegalovirus infection | 57/1580 | 225/8465 | 7.40e-03 | 3.84e-02 | 2.79e-02 | 57 |
| hsa051633 | Colorectum | SER | Human cytomegalovirus infection | 57/1580 | 225/8465 | 7.40e-03 | 3.84e-02 | 2.79e-02 | 57 |
| hsa051634 | Colorectum | MSS | Human cytomegalovirus infection | 74/1875 | 225/8465 | 1.12e-04 | 1.01e-03 | 6.19e-04 | 74 |
| hsa052252 | Colorectum | MSS | Hepatocellular carcinoma | 56/1875 | 168/8465 | 5.04e-04 | 3.45e-03 | 2.11e-03 | 56 |
| hsa042182 | Colorectum | MSS | Cellular senescence | 52/1875 | 156/8465 | 7.87e-04 | 5.07e-03 | 3.11e-03 | 52 |
| hsa051602 | Colorectum | MSS | Hepatitis C | 52/1875 | 157/8465 | 9.29e-04 | 5.58e-03 | 3.42e-03 | 52 |
| hsa052202 | Colorectum | MSS | Chronic myeloid leukemia | 29/1875 | 76/8465 | 1.10e-03 | 6.27e-03 | 3.84e-03 | 29 |
| hsa05169 | Colorectum | MSS | Epstein-Barr virus infection | 63/1875 | 202/8465 | 1.63e-03 | 8.98e-03 | 5.50e-03 | 63 |
| Page: 1 2 3 4 5 6 7 8 9 10 11 12 13 14 15 16 |
Top |
Cell-cell communication analysis |
| Identification of potential cell-cell interactions between two cell types and their ligand-receptor pairs for different disease states |
| Ligand | Receptor | LRpair | Pathway | Tissue | Disease Stage |
| Page: 1 |
Top |
Single-cell gene regulatory network inference analysis |
| Find out the significant the regulons (TFs) and the target genes of each regulon across cell types for different disease states |
| TF | Cell Type | Tissue | Disease Stage | Target Gene | RSS | Regulon Activity |
| ∗The dot plots of a searched regulon are shown for all cell subpopulations in each disease state of each tissue based on the regulon specific score inferred using pySCENIC and by calculating the average expression. |
| Page: 1 |
Top |
Somatic mutation of malignant transformation related genes |
| Annotation of somatic variants for genes involved in malignant transformation |
| Hugo Symbol | Variant Class | Variant Classification | dbSNP RS | HGVSc | HGVSp | HGVSp Short | SWISSPROT | BIOTYPE | SIFT | PolyPhen | Tumor Sample Barcode | Tissue | Histology | Sex | Age | Stage | Therapy Types | Drugs | Outcome |
| CDK6 | SNV | Missense_Mutation | novel | c.262N>G | p.Thr88Ala | p.T88A | Q00534 | protein_coding | tolerated(0.49) | benign(0.015) | TCGA-AN-A0FJ-01 | Breast | breast invasive carcinoma | Female | <65 | III/IV | Unknown | Unknown | SD |
| CDK6 | SNV | Missense_Mutation | c.417N>A | p.His139Gln | p.H139Q | Q00534 | protein_coding | deleterious(0.02) | possibly_damaging(0.608) | TCGA-AN-A0FW-01 | Breast | breast invasive carcinoma | Female | >=65 | III/IV | Unknown | Unknown | SD | |
| CDK6 | SNV | Missense_Mutation | c.352C>T | p.Pro118Ser | p.P118S | Q00534 | protein_coding | tolerated(0.4) | benign(0.049) | TCGA-D8-A1J8-01 | Breast | breast invasive carcinoma | Female | >=65 | I/II | Hormone Therapy | nolvadex | SD | |
| CDK6 | SNV | Missense_Mutation | novel | c.413C>T | p.Ser138Leu | p.S138L | Q00534 | protein_coding | tolerated(0.06) | benign(0.02) | TCGA-MA-AA41-01 | Cervix | cervical & endocervical cancer | Female | <65 | I/II | Unknown | Unknown | SD |
| CDK6 | SNV | Missense_Mutation | c.749N>T | p.Pro250Leu | p.P250L | Q00534 | protein_coding | tolerated(0.07) | probably_damaging(0.961) | TCGA-AA-3968-01 | Colorectum | colon adenocarcinoma | Female | <65 | I/II | Unknown | Unknown | SD | |
| CDK6 | SNV | Missense_Mutation | rs761377867 | c.260G>A | p.Arg87Gln | p.R87Q | Q00534 | protein_coding | tolerated(0.15) | possibly_damaging(0.794) | TCGA-AA-3984-01 | Colorectum | colon adenocarcinoma | Female | <65 | I/II | Unknown | Unknown | SD |
| CDK6 | SNV | Missense_Mutation | c.250N>T | p.Thr84Ser | p.T84S | Q00534 | protein_coding | tolerated(0.5) | benign(0.161) | TCGA-DM-A28F-01 | Colorectum | colon adenocarcinoma | Male | >=65 | III/IV | Unknown | Unknown | SD | |
| CDK6 | SNV | Missense_Mutation | c.431G>A | p.Arg144His | p.R144H | Q00534 | protein_coding | deleterious(0) | probably_damaging(1) | TCGA-A5-A0G2-01 | Endometrium | uterine corpus endometrioid carcinoma | Female | <65 | III/IV | Unknown | Unknown | SD | |
| CDK6 | SNV | Missense_Mutation | novel | c.262A>G | p.Thr88Ala | p.T88A | Q00534 | protein_coding | tolerated(0.49) | benign(0.015) | TCGA-A5-A1OF-01 | Endometrium | uterine corpus endometrioid carcinoma | Female | <65 | I/II | Unknown | Unknown | SD |
| CDK6 | SNV | Missense_Mutation | novel | c.248G>A | p.Cys83Tyr | p.C83Y | Q00534 | protein_coding | deleterious(0.02) | benign(0.414) | TCGA-AJ-A3BH-01 | Endometrium | uterine corpus endometrioid carcinoma | Female | Unknown | I/II | Unknown | Unknown | SD |
| Page: 1 2 3 4 |
Top |
Related drugs of malignant transformation related genes |
| Identification of chemicals and drugs interact with genes involved in malignant transfromation |
| (DGIdb 4.0) |
| Entrez ID | Symbol | Category | Interaction Types | Drug Claim Name | Drug Name | PMIDs |
| 1021 | CDK6 | KINASE, ENZYME, DRUGGABLE GENOME, CLINICALLY ACTIONABLE, SERINE THREONINE KINASE, TUMOR SUPPRESSOR, DRUG RESISTANCE | inhibitor | 178102290 | AT-7519 | |
| 1021 | CDK6 | KINASE, ENZYME, DRUGGABLE GENOME, CLINICALLY ACTIONABLE, SERINE THREONINE KINASE, TUMOR SUPPRESSOR, DRUG RESISTANCE | inhibitor | CHEMBL1230607 | PHA-793887 | |
| 1021 | CDK6 | KINASE, ENZYME, DRUGGABLE GENOME, CLINICALLY ACTIONABLE, SERINE THREONINE KINASE, TUMOR SUPPRESSOR, DRUG RESISTANCE | inhibitor | 387065614 | ||
| 1021 | CDK6 | KINASE, ENZYME, DRUGGABLE GENOME, CLINICALLY ACTIONABLE, SERINE THREONINE KINASE, TUMOR SUPPRESSOR, DRUG RESISTANCE | inhibitor | CHEMBL428690 | ALVOCIDIB | |
| 1021 | CDK6 | KINASE, ENZYME, DRUGGABLE GENOME, CLINICALLY ACTIONABLE, SERINE THREONINE KINASE, TUMOR SUPPRESSOR, DRUG RESISTANCE | inhibitor | CHEMBL3545110 | RIBOCICLIB | |
| 1021 | CDK6 | KINASE, ENZYME, DRUGGABLE GENOME, CLINICALLY ACTIONABLE, SERINE THREONINE KINASE, TUMOR SUPPRESSOR, DRUG RESISTANCE | PMID25726713-Compound-48 | |||
| 1021 | CDK6 | KINASE, ENZYME, DRUGGABLE GENOME, CLINICALLY ACTIONABLE, SERINE THREONINE KINASE, TUMOR SUPPRESSOR, DRUG RESISTANCE | CS1229 | |||
| 1021 | CDK6 | KINASE, ENZYME, DRUGGABLE GENOME, CLINICALLY ACTIONABLE, SERINE THREONINE KINASE, TUMOR SUPPRESSOR, DRUG RESISTANCE | inhibitor | 387065613 | ||
| 1021 | CDK6 | KINASE, ENZYME, DRUGGABLE GENOME, CLINICALLY ACTIONABLE, SERINE THREONINE KINASE, TUMOR SUPPRESSOR, DRUG RESISTANCE | inhibitor | CHEMBL445813 | AT-7519 | |
| 1021 | CDK6 | KINASE, ENZYME, DRUGGABLE GENOME, CLINICALLY ACTIONABLE, SERINE THREONINE KINASE, TUMOR SUPPRESSOR, DRUG RESISTANCE | inhibitor | 363894217 | VORUCICLIB |
| Page: 1 2 3 4 5 6 |

Copyright 2023-Present -The University of Texas Health Science Center at Houston |