
|
|||||
|
 | |
| |
| |
| |
| |
| |
|
Gene: CDK5RAP1 |
Gene summary for CDK5RAP1 |
| Gene information | Species | Human | Gene symbol | CDK5RAP1 | Gene ID | 51654 |
| Gene name | CDK5 regulatory subunit associated protein 1 | |
| Gene Alias | C20orf34 | |
| Cytomap | 20q11.21 | |
| Gene Type | protein-coding | GO ID | GO:0000079 | UniProtAcc | Q53H36 |
Top |
Malignant transformation analysis |
| Identification of the aberrant gene expression in precancerous and cancerous lesions by comparing the gene expression of stem-like cells in diseased tissues with normal stem cells |
| Entrez ID | Symbol | Replicates | Species | Organ | Tissue | Adj P-value | Log2FC | Malignancy |
| 51654 | CDK5RAP1 | LZE4T | Human | Esophagus | ESCC | 3.56e-08 | 2.07e-01 | 0.0811 |
| 51654 | CDK5RAP1 | LZE20T | Human | Esophagus | ESCC | 8.32e-06 | 1.62e-01 | 0.0662 |
| 51654 | CDK5RAP1 | LZE24T | Human | Esophagus | ESCC | 2.24e-16 | 5.89e-01 | 0.0596 |
| 51654 | CDK5RAP1 | P1T-E | Human | Esophagus | ESCC | 4.16e-06 | 2.43e-01 | 0.0875 |
| 51654 | CDK5RAP1 | P2T-E | Human | Esophagus | ESCC | 4.10e-15 | 2.89e-01 | 0.1177 |
| 51654 | CDK5RAP1 | P4T-E | Human | Esophagus | ESCC | 4.61e-10 | 3.46e-01 | 0.1323 |
| 51654 | CDK5RAP1 | P5T-E | Human | Esophagus | ESCC | 1.25e-11 | 2.38e-01 | 0.1327 |
| 51654 | CDK5RAP1 | P8T-E | Human | Esophagus | ESCC | 7.87e-17 | 3.03e-01 | 0.0889 |
| 51654 | CDK5RAP1 | P9T-E | Human | Esophagus | ESCC | 3.64e-10 | 1.67e-01 | 0.1131 |
| 51654 | CDK5RAP1 | P10T-E | Human | Esophagus | ESCC | 2.09e-18 | 3.63e-01 | 0.116 |
| 51654 | CDK5RAP1 | P11T-E | Human | Esophagus | ESCC | 2.77e-11 | 3.41e-01 | 0.1426 |
| 51654 | CDK5RAP1 | P12T-E | Human | Esophagus | ESCC | 1.07e-23 | 4.37e-01 | 0.1122 |
| 51654 | CDK5RAP1 | P15T-E | Human | Esophagus | ESCC | 2.49e-08 | 2.70e-01 | 0.1149 |
| 51654 | CDK5RAP1 | P16T-E | Human | Esophagus | ESCC | 2.05e-18 | 3.63e-01 | 0.1153 |
| 51654 | CDK5RAP1 | P17T-E | Human | Esophagus | ESCC | 2.41e-06 | 3.09e-01 | 0.1278 |
| 51654 | CDK5RAP1 | P19T-E | Human | Esophagus | ESCC | 2.30e-04 | 3.10e-01 | 0.1662 |
| 51654 | CDK5RAP1 | P20T-E | Human | Esophagus | ESCC | 4.18e-21 | 3.66e-01 | 0.1124 |
| 51654 | CDK5RAP1 | P21T-E | Human | Esophagus | ESCC | 2.53e-19 | 4.48e-01 | 0.1617 |
| 51654 | CDK5RAP1 | P22T-E | Human | Esophagus | ESCC | 9.22e-16 | 2.37e-01 | 0.1236 |
| 51654 | CDK5RAP1 | P23T-E | Human | Esophagus | ESCC | 2.17e-18 | 4.62e-01 | 0.108 |
| Page: 1 2 3 4 |
| Tissue | Expression Dynamics | Abbreviation |
| Esophagus |  | ESCC: Esophageal squamous cell carcinoma |
| HGIN: High-grade intraepithelial neoplasias | ||
| LGIN: Low-grade intraepithelial neoplasias | ||
| Oral Cavity | 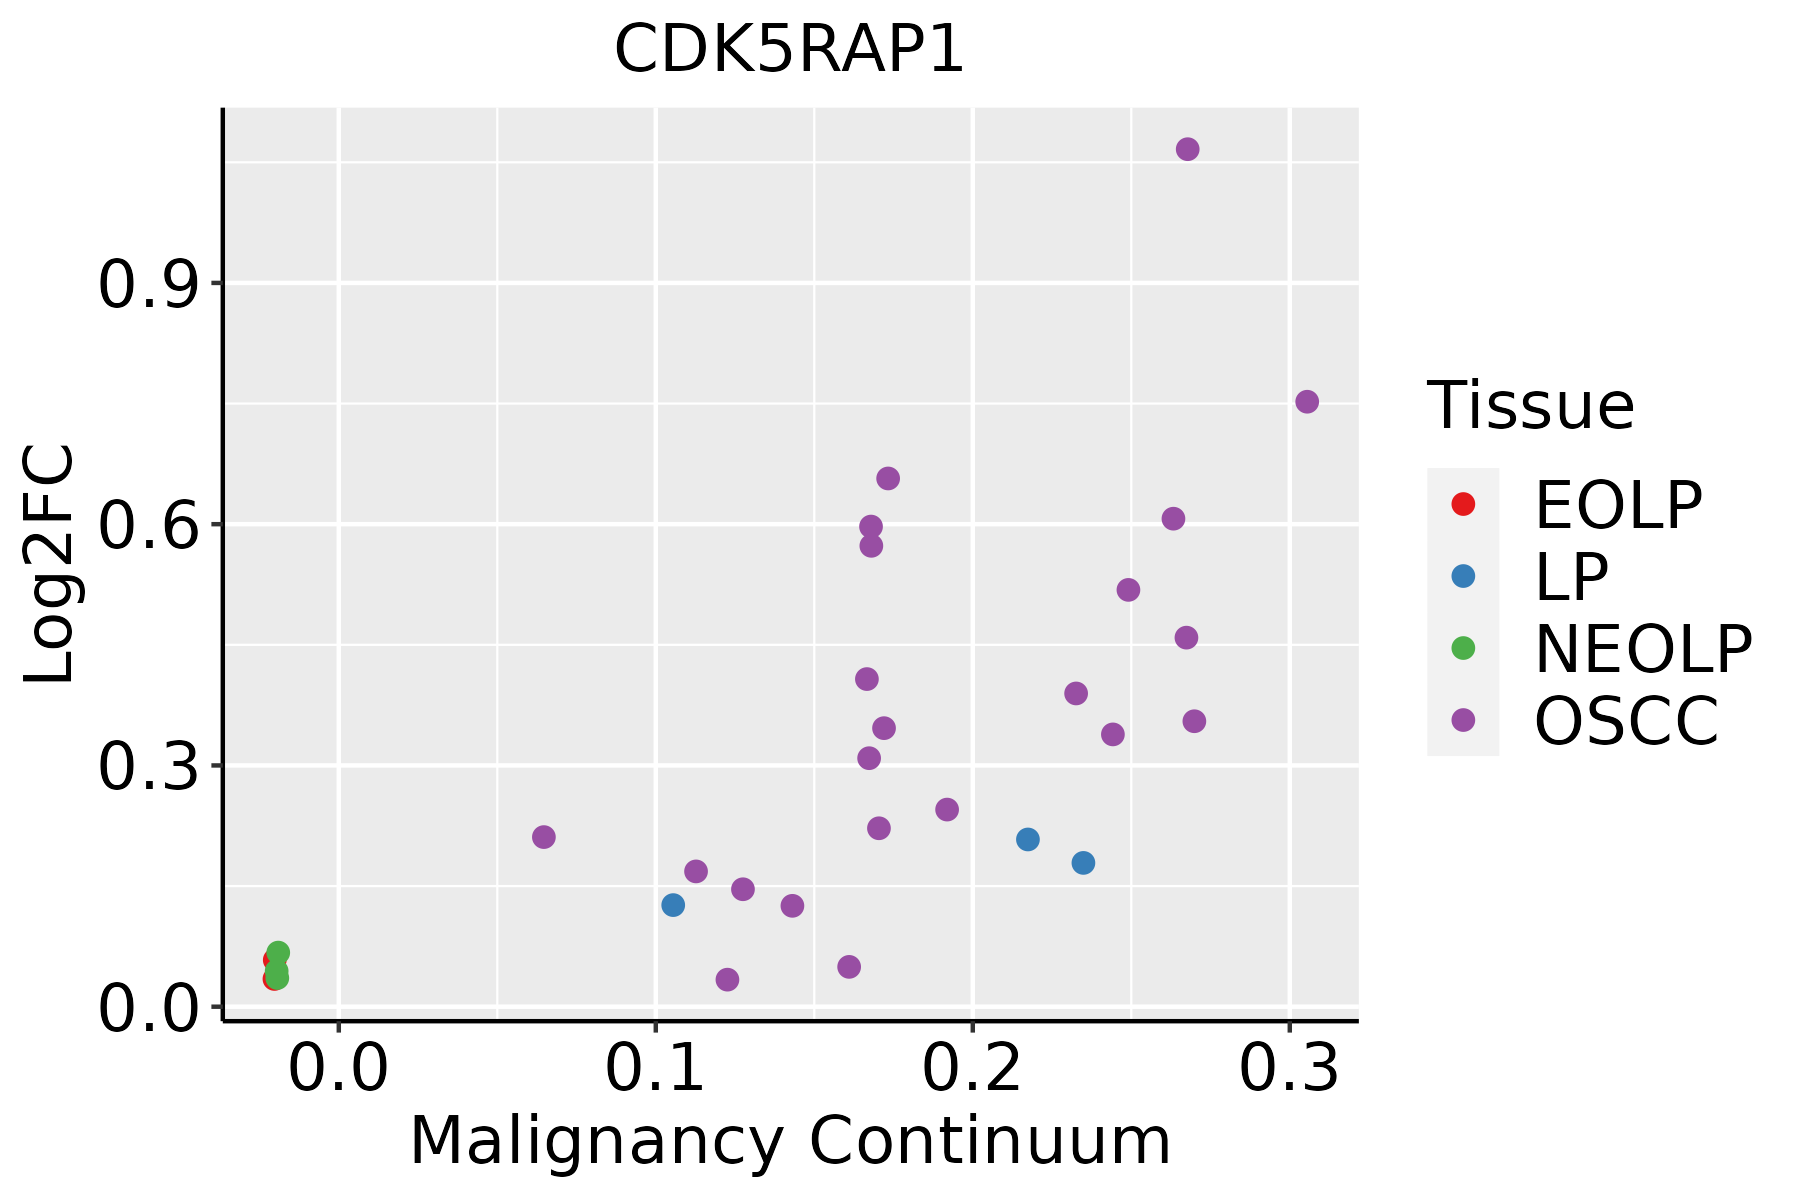 | EOLP: Erosive Oral lichen planus |
| LP: leukoplakia | ||
| NEOLP: Non-erosive oral lichen planus | ||
| OSCC: Oral squamous cell carcinoma |
| ∗log2FC in expression of this searched gene in stem-like cells from each diseased tissue sample relative to stem-like cells in normal samples in each tissue plotted against the malignancy continuum. Samples are colored based on if they are from different disease stage. |
Top |
Malignant transformation related pathway analysis |
| Find out the enriched GO biological processes and KEGG pathways involved in transition from healthy to precancer to cancer |
| Tissue | Disease Stage | Enriched GO biological Processes |
| Colorectum | AD |  |
| Colorectum | SER |  |
| Colorectum | MSS |  |
| Colorectum | MSI-H |  |
| Colorectum | FAP |  |
| ∗Top 15 enriched GO BP terms are showed in the bar plot of each disease state in each tissue. Each row represents a significant GO biological process which is colored according to the -log10(p.adjust). |
| Page: 1 2 3 4 5 6 7 8 9 |
| GO ID | Tissue | Disease Stage | Description | Gene Ratio | Bg Ratio | pvalue | p.adjust | Count |
| GO:003447015 | Esophagus | ESCC | ncRNA processing | 300/8552 | 395/18723 | 3.09e-35 | 3.26e-32 | 300 |
| GO:003466012 | Esophagus | ESCC | ncRNA metabolic process | 346/8552 | 485/18723 | 4.35e-31 | 2.51e-28 | 346 |
| GO:014005313 | Esophagus | ESCC | mitochondrial gene expression | 93/8552 | 108/18723 | 1.96e-18 | 2.03e-16 | 93 |
| GO:0006417111 | Esophagus | ESCC | regulation of translation | 304/8552 | 468/18723 | 1.53e-17 | 1.33e-15 | 304 |
| GO:003254314 | Esophagus | ESCC | mitochondrial translation | 68/8552 | 76/18723 | 1.02e-15 | 6.86e-14 | 68 |
| GO:0045727111 | Esophagus | ESCC | positive regulation of translation | 107/8552 | 136/18723 | 2.79e-15 | 1.68e-13 | 107 |
| GO:0034250111 | Esophagus | ESCC | positive regulation of cellular amide metabolic process | 123/8552 | 162/18723 | 3.32e-15 | 1.93e-13 | 123 |
| GO:0010563111 | Esophagus | ESCC | negative regulation of phosphorus metabolic process | 274/8552 | 442/18723 | 2.32e-12 | 9.41e-11 | 274 |
| GO:0045936111 | Esophagus | ESCC | negative regulation of phosphate metabolic process | 273/8552 | 441/18723 | 3.18e-12 | 1.25e-10 | 273 |
| GO:0051348111 | Esophagus | ESCC | negative regulation of transferase activity | 177/8552 | 268/18723 | 1.08e-11 | 4.00e-10 | 177 |
| GO:007190016 | Esophagus | ESCC | regulation of protein serine/threonine kinase activity | 227/8552 | 359/18723 | 1.12e-11 | 4.10e-10 | 227 |
| GO:0042326111 | Esophagus | ESCC | negative regulation of phosphorylation | 237/8552 | 385/18723 | 1.86e-10 | 5.33e-09 | 237 |
| GO:0001933111 | Esophagus | ESCC | negative regulation of protein phosphorylation | 213/8552 | 342/18723 | 3.54e-10 | 9.76e-09 | 213 |
| GO:00457865 | Esophagus | ESCC | negative regulation of cell cycle | 236/8552 | 385/18723 | 3.62e-10 | 9.93e-09 | 236 |
| GO:00080333 | Esophagus | ESCC | tRNA processing | 92/8552 | 127/18723 | 7.83e-10 | 1.93e-08 | 92 |
| GO:00063992 | Esophagus | ESCC | tRNA metabolic process | 122/8552 | 179/18723 | 9.03e-10 | 2.19e-08 | 122 |
| GO:004578710 | Esophagus | ESCC | positive regulation of cell cycle | 196/8552 | 313/18723 | 9.27e-10 | 2.24e-08 | 196 |
| GO:003367319 | Esophagus | ESCC | negative regulation of kinase activity | 154/8552 | 237/18723 | 1.38e-09 | 3.27e-08 | 154 |
| GO:000646920 | Esophagus | ESCC | negative regulation of protein kinase activity | 140/8552 | 212/18723 | 1.53e-09 | 3.56e-08 | 140 |
| GO:00094512 | Esophagus | ESCC | RNA modification | 114/8552 | 167/18723 | 2.76e-09 | 6.04e-08 | 114 |
| Page: 1 2 3 4 |
| Pathway ID | Tissue | Disease Stage | Description | Gene Ratio | Bg Ratio | pvalue | p.adjust | qvalue | Count |
| Page: 1 |
Top |
Cell-cell communication analysis |
| Identification of potential cell-cell interactions between two cell types and their ligand-receptor pairs for different disease states |
| Ligand | Receptor | LRpair | Pathway | Tissue | Disease Stage |
| Page: 1 |
Top |
Single-cell gene regulatory network inference analysis |
| Find out the significant the regulons (TFs) and the target genes of each regulon across cell types for different disease states |
| TF | Cell Type | Tissue | Disease Stage | Target Gene | RSS | Regulon Activity |
| ∗The dot plots of a searched regulon are shown for all cell subpopulations in each disease state of each tissue based on the regulon specific score inferred using pySCENIC and by calculating the average expression. |
| Page: 1 |
Top |
Somatic mutation of malignant transformation related genes |
| Annotation of somatic variants for genes involved in malignant transformation |
| Hugo Symbol | Variant Class | Variant Classification | dbSNP RS | HGVSc | HGVSp | HGVSp Short | SWISSPROT | BIOTYPE | SIFT | PolyPhen | Tumor Sample Barcode | Tissue | Histology | Sex | Age | Stage | Therapy Types | Drugs | Outcome |
| CDK5RAP1 | SNV | Missense_Mutation | c.620N>T | p.Ala207Val | p.A207V | Q96SZ6 | protein_coding | deleterious(0) | probably_damaging(0.962) | TCGA-A2-A1FW-01 | Breast | breast invasive carcinoma | Female | <65 | III/IV | Chemotherapy | cytoxan | SD | |
| CDK5RAP1 | SNV | Missense_Mutation | novel | c.463N>G | p.Ile155Val | p.I155V | Q96SZ6 | protein_coding | tolerated(0.43) | benign(0.08) | TCGA-A7-A4SA-01 | Breast | breast invasive carcinoma | Female | <65 | I/II | Chemotherapy | doxorubicin | CR |
| CDK5RAP1 | SNV | Missense_Mutation | c.135N>T | p.Glu45Asp | p.E45D | Q96SZ6 | protein_coding | tolerated(0.09) | benign(0.003) | TCGA-BH-A203-01 | Breast | breast invasive carcinoma | Female | >=65 | I/II | Unknown | Unknown | PD | |
| CDK5RAP1 | SNV | Missense_Mutation | rs773040434 | c.1198N>T | p.Arg400Trp | p.R400W | Q96SZ6 | protein_coding | deleterious(0) | probably_damaging(0.999) | TCGA-E2-A14N-01 | Breast | breast invasive carcinoma | Female | <65 | I/II | Chemotherapy | cyclophosphamide | SD |
| CDK5RAP1 | deletion | Frame_Shift_Del | novel | c.86delN | p.Met29SerfsTer41 | p.M29Sfs*41 | Q96SZ6 | protein_coding | TCGA-EW-A2FV-01 | Breast | breast invasive carcinoma | Female | <65 | III/IV | Chemotherapy | docetaxel | SD | ||
| CDK5RAP1 | SNV | Missense_Mutation | rs745597149 | c.1070G>A | p.Arg357His | p.R357H | Q96SZ6 | protein_coding | deleterious(0) | probably_damaging(1) | TCGA-A6-2672-01 | Colorectum | colon adenocarcinoma | Female | >=65 | III/IV | Unknown | Unknown | SD |
| CDK5RAP1 | SNV | Missense_Mutation | rs766215061 | c.830N>A | p.Arg277Gln | p.R277Q | Q96SZ6 | protein_coding | deleterious(0) | probably_damaging(0.998) | TCGA-A6-A565-01 | Colorectum | colon adenocarcinoma | Female | <65 | III/IV | Unspecific | 5FU | PD |
| CDK5RAP1 | SNV | Missense_Mutation | c.1321N>A | p.Val441Ile | p.V441I | Q96SZ6 | protein_coding | tolerated(0.15) | benign(0.001) | TCGA-AA-3941-01 | Colorectum | colon adenocarcinoma | Female | >=65 | I/II | Unknown | Unknown | SD | |
| CDK5RAP1 | SNV | Missense_Mutation | c.916A>C | p.Ser306Arg | p.S306R | Q96SZ6 | protein_coding | deleterious(0) | probably_damaging(0.999) | TCGA-AA-A010-01 | Colorectum | colon adenocarcinoma | Female | <65 | I/II | Chemotherapy | folinic | CR | |
| CDK5RAP1 | SNV | Missense_Mutation | c.799N>A | p.Val267Ile | p.V267I | Q96SZ6 | protein_coding | deleterious(0) | probably_damaging(1) | TCGA-AZ-6603-01 | Colorectum | colon adenocarcinoma | Female | >=65 | I/II | Unknown | Unknown | SD |
| Page: 1 2 3 4 5 6 |
Top |
Related drugs of malignant transformation related genes |
| Identification of chemicals and drugs interact with genes involved in malignant transfromation |
| (DGIdb 4.0) |
| Entrez ID | Symbol | Category | Interaction Types | Drug Claim Name | Drug Name | PMIDs |
| Page: 1 |

Copyright 2023-Present -The University of Texas Health Science Center at Houston |