Schematic overview of the cellular and molecular mechanisms involved in the cancer progression, including the proposed cellular and molecular mechanisms in cancer cells trajectory. AT1: alveolar type 1 cells; AT2: alveolar type 2 cells; AAH: atypical adenomatous hyperplasia; AIS: adenocarcinoma in situ; MIA: minimally invasive adenocarcinoma; IA: invasive adenocarcinoma; EMT: epithelial-mesenchymal transition

Home

Download

Statistics

Help

Contact

Center for Computational Systems Medicine
leaf

Gene summary

leaf

Malignant transformation analysis

leaf

Malignant transformation related pathway analysis

leaf

Cell-cell communication analysis

leaf

Single-cell gene regulatory network inference analysis

leaf

Somatic mutation of malignant transformation related genes

leaf

Related drugs of malignant transformation related genes

Gene: CDK2AP2

Gene summary for CDK2AP2

check button Gene summary.

Gene informationSpeciesHuman
Gene symbol

CDK2AP2

Gene ID

10263

Gene namecyclin dependent kinase 2 associated protein 2
Gene AliasDOC-1R
Cytomap11q13.2
Gene Typeprotein-coding
GO ID

GO:0000082

UniProtAcc

O75956


Top

Malignant transformation analysis

check button Identification of the aberrant gene expression in precancerous and cancerous lesions by comparing the gene expression of stem-like cells in diseased tissues with normal stem cells
check button Malignant transformation involving gene list.
Entrez IDSymbolReplicatesSpeciesOrganTissueAdj P-valueLog2FCMalignancy
10263CDK2AP2HTA11_3410_2000001011HumanColorectumAD2.41e-113.35e-010.0155
10263CDK2AP2HTA11_2487_2000001011HumanColorectumSER1.43e-247.96e-01-0.1808
10263CDK2AP2HTA11_2951_2000001011HumanColorectumAD2.31e-023.56e-010.0216
10263CDK2AP2HTA11_1938_2000001011HumanColorectumAD6.81e-279.13e-01-0.0811
10263CDK2AP2HTA11_78_2000001011HumanColorectumAD1.63e-073.84e-01-0.1088
10263CDK2AP2HTA11_347_2000001011HumanColorectumAD1.47e-377.85e-01-0.1954
10263CDK2AP2HTA11_411_2000001011HumanColorectumSER9.35e-161.54e+00-0.2602
10263CDK2AP2HTA11_2112_2000001011HumanColorectumSER1.71e-086.50e-01-0.2196
10263CDK2AP2HTA11_3361_2000001011HumanColorectumAD7.89e-218.12e-01-0.1207
10263CDK2AP2HTA11_83_2000001011HumanColorectumSER6.76e-248.70e-01-0.1526
10263CDK2AP2HTA11_696_2000001011HumanColorectumAD1.24e-439.67e-01-0.1464
10263CDK2AP2HTA11_866_2000001011HumanColorectumAD1.19e-165.38e-01-0.1001
10263CDK2AP2HTA11_1391_2000001011HumanColorectumAD1.43e-431.21e+00-0.059
10263CDK2AP2HTA11_2992_2000001011HumanColorectumSER3.63e-098.15e-01-0.1706
10263CDK2AP2HTA11_5212_2000001011HumanColorectumAD3.54e-187.89e-01-0.2061
10263CDK2AP2HTA11_5216_2000001011HumanColorectumSER8.64e-138.97e-01-0.1462
10263CDK2AP2HTA11_546_2000001011HumanColorectumAD6.09e-156.72e-01-0.0842
10263CDK2AP2HTA11_9341_2000001011HumanColorectumSER9.14e-036.28e-01-0.00410000000000005
10263CDK2AP2HTA11_7862_2000001011HumanColorectumAD9.44e-094.65e-01-0.0179
10263CDK2AP2HTA11_866_3004761011HumanColorectumAD1.39e-154.77e-010.096
Page: 1 2 3 4 5 6 7 8 9 

check button Transcriptomic changes along malignancy continuum.
TissueExpression DynamicsAbbreviation
Colorectum (GSE201348)The image shows the transcriptomic changes along malignancy continuum.log2FC in expression of this searched gene in stem-like cells from each diseased tissue sample relative to stem-like cells in normal samples in each tissue plotted against the malignancy continuum. Samples are colored based on if they are from different disease stage.FAP: Familial adenomatous polyposis
CRC: Colorectal cancer
Colorectum (HTA11)The image shows the transcriptomic changes along malignancy continuum.log2FC in expression of this searched gene in stem-like cells from each diseased tissue sample relative to stem-like cells in normal samples in each tissue plotted against the malignancy continuum. Samples are colored based on if they are from different disease stage.AD: Adenomas
SER: Sessile serrated lesions
MSI-H: Microsatellite-high colorectal cancer
MSS: Microsatellite stable colorectal cancer
EsophagusThe image shows the transcriptomic changes along malignancy continuum.log2FC in expression of this searched gene in stem-like cells from each diseased tissue sample relative to stem-like cells in normal samples in each tissue plotted against the malignancy continuum. Samples are colored based on if they are from different disease stage.
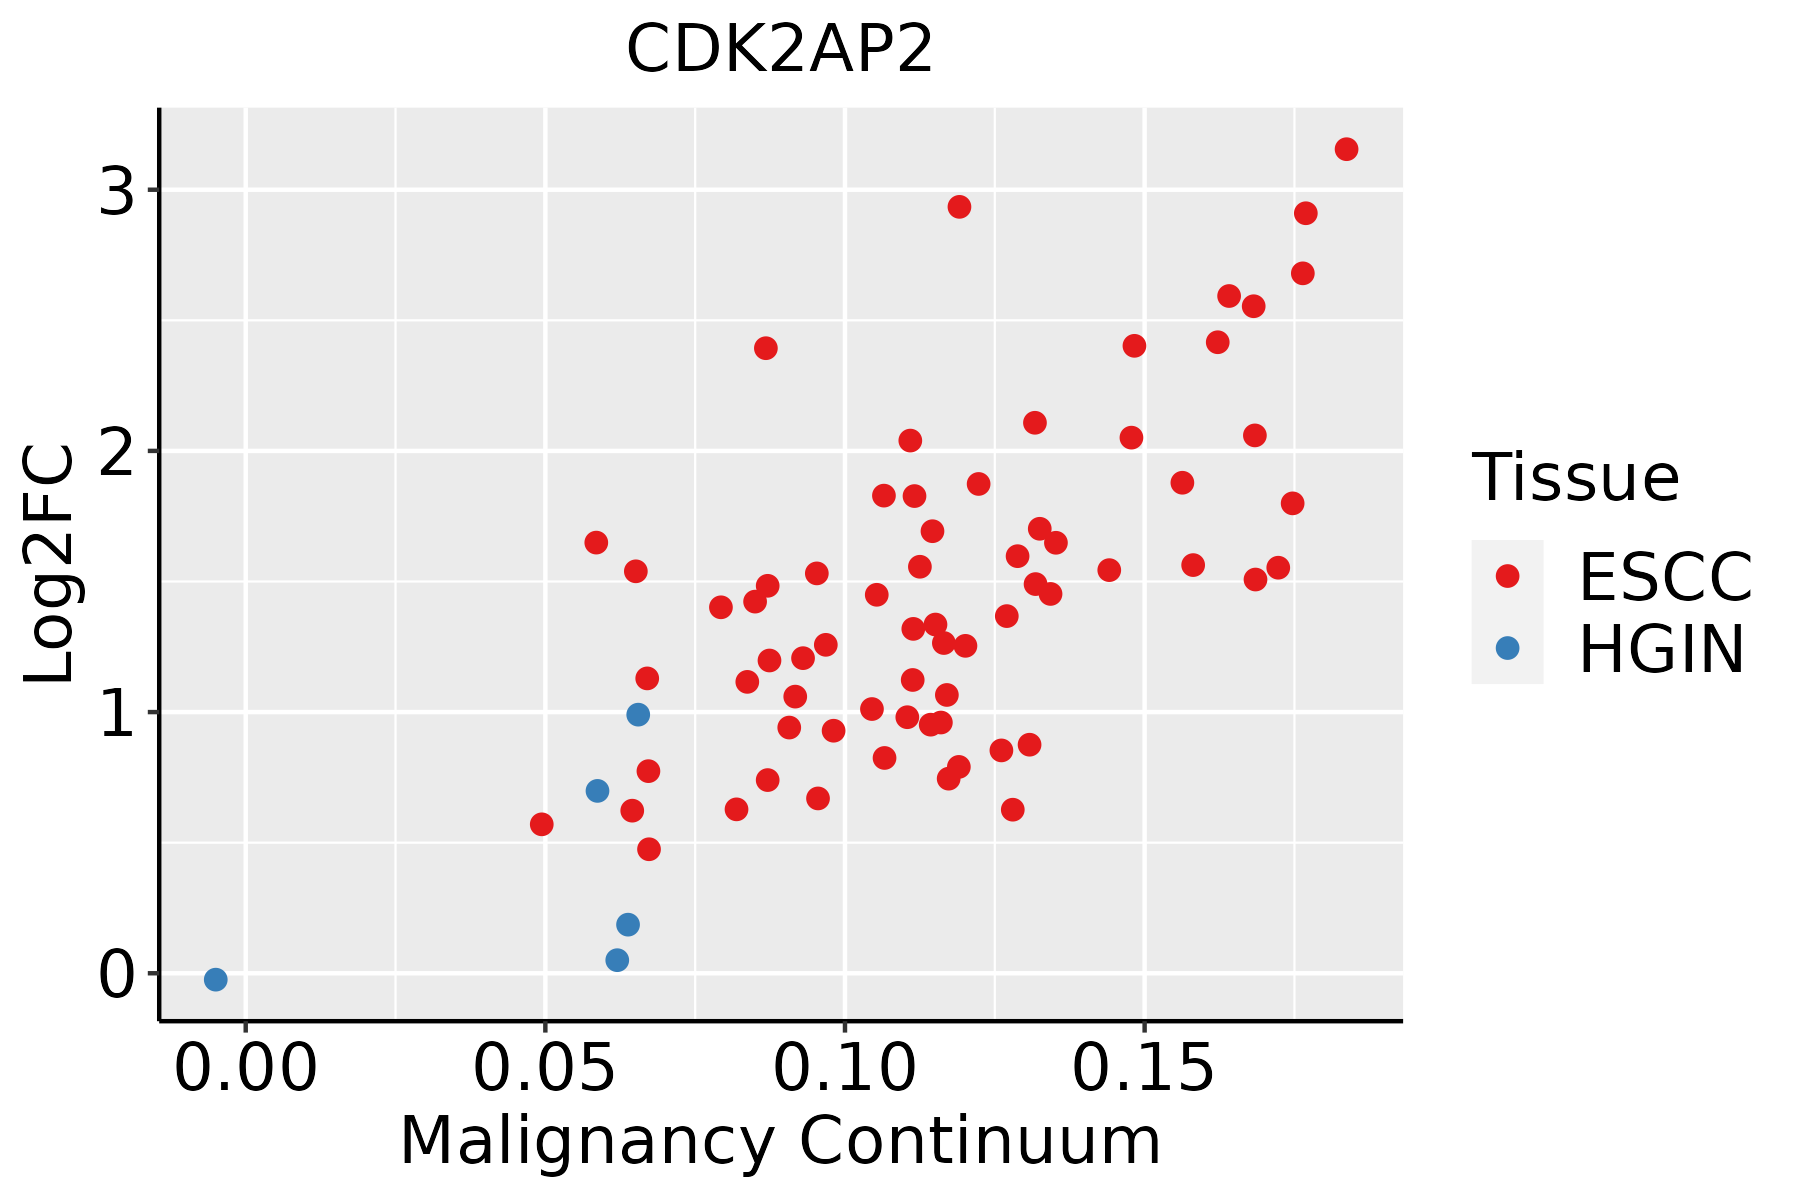
ESCC: Esophageal squamous cell carcinoma
HGIN: High-grade intraepithelial neoplasias
LGIN: Low-grade intraepithelial neoplasias
LiverThe image shows the transcriptomic changes along malignancy continuum.log2FC in expression of this searched gene in stem-like cells from each diseased tissue sample relative to stem-like cells in normal samples in each tissue plotted against the malignancy continuum. Samples are colored based on if they are from different disease stage.HCC: Hepatocellular carcinoma
NAFLD: Non-alcoholic fatty liver disease
Oral CavityThe image shows the transcriptomic changes along malignancy continuum.log2FC in expression of this searched gene in stem-like cells from each diseased tissue sample relative to stem-like cells in normal samples in each tissue plotted against the malignancy continuum. Samples are colored based on if they are from different disease stage.EOLP: Erosive Oral lichen planus
LP: leukoplakia
NEOLP: Non-erosive oral lichen planus
OSCC: Oral squamous cell carcinoma
ProstateThe image shows the transcriptomic changes along malignancy continuum.log2FC in expression of this searched gene in stem-like cells from each diseased tissue sample relative to stem-like cells in normal samples in each tissue plotted against the malignancy continuum. Samples are colored based on if they are from different disease stage.
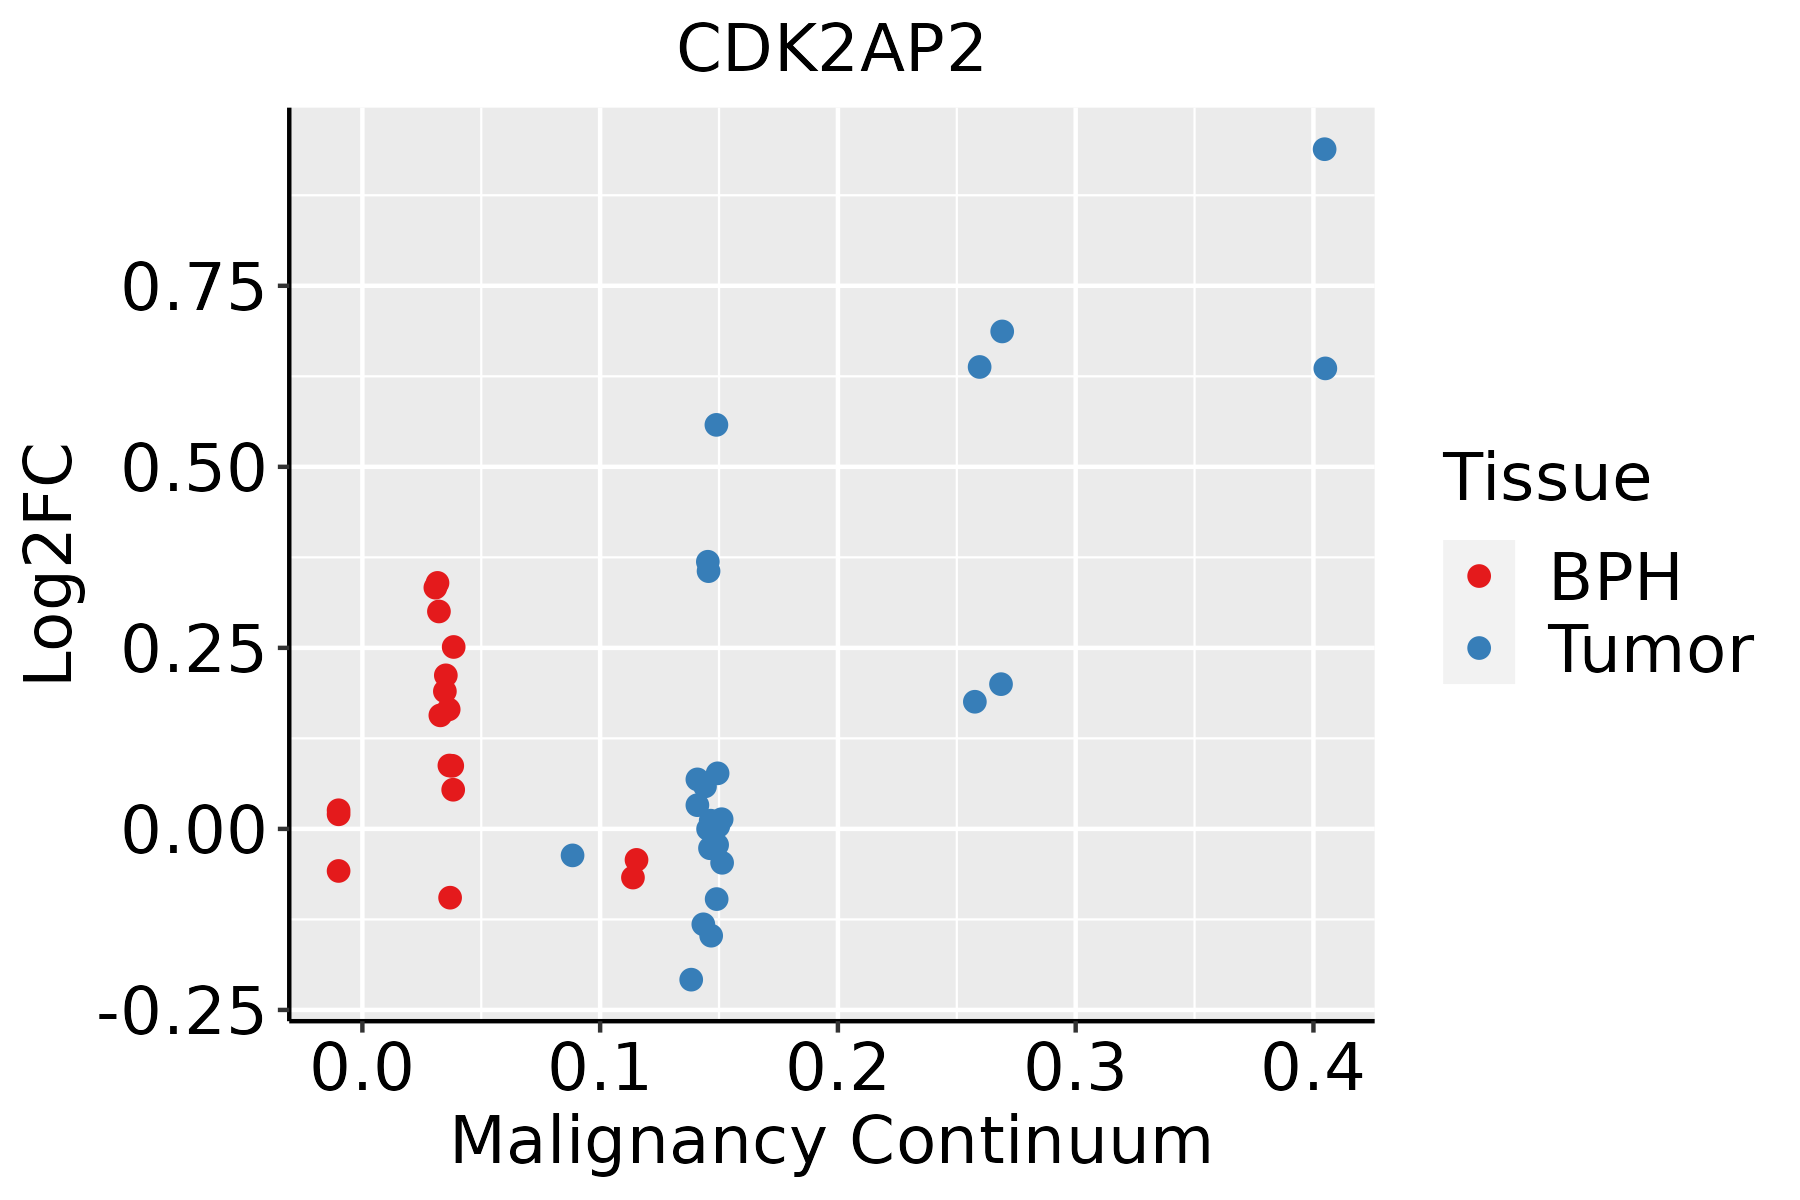
BPH: Benign Prostatic Hyperplasia
SkinThe image shows the transcriptomic changes along malignancy continuum.log2FC in expression of this searched gene in stem-like cells from each diseased tissue sample relative to stem-like cells in normal samples in each tissue plotted against the malignancy continuum. Samples are colored based on if they are from different disease stage.
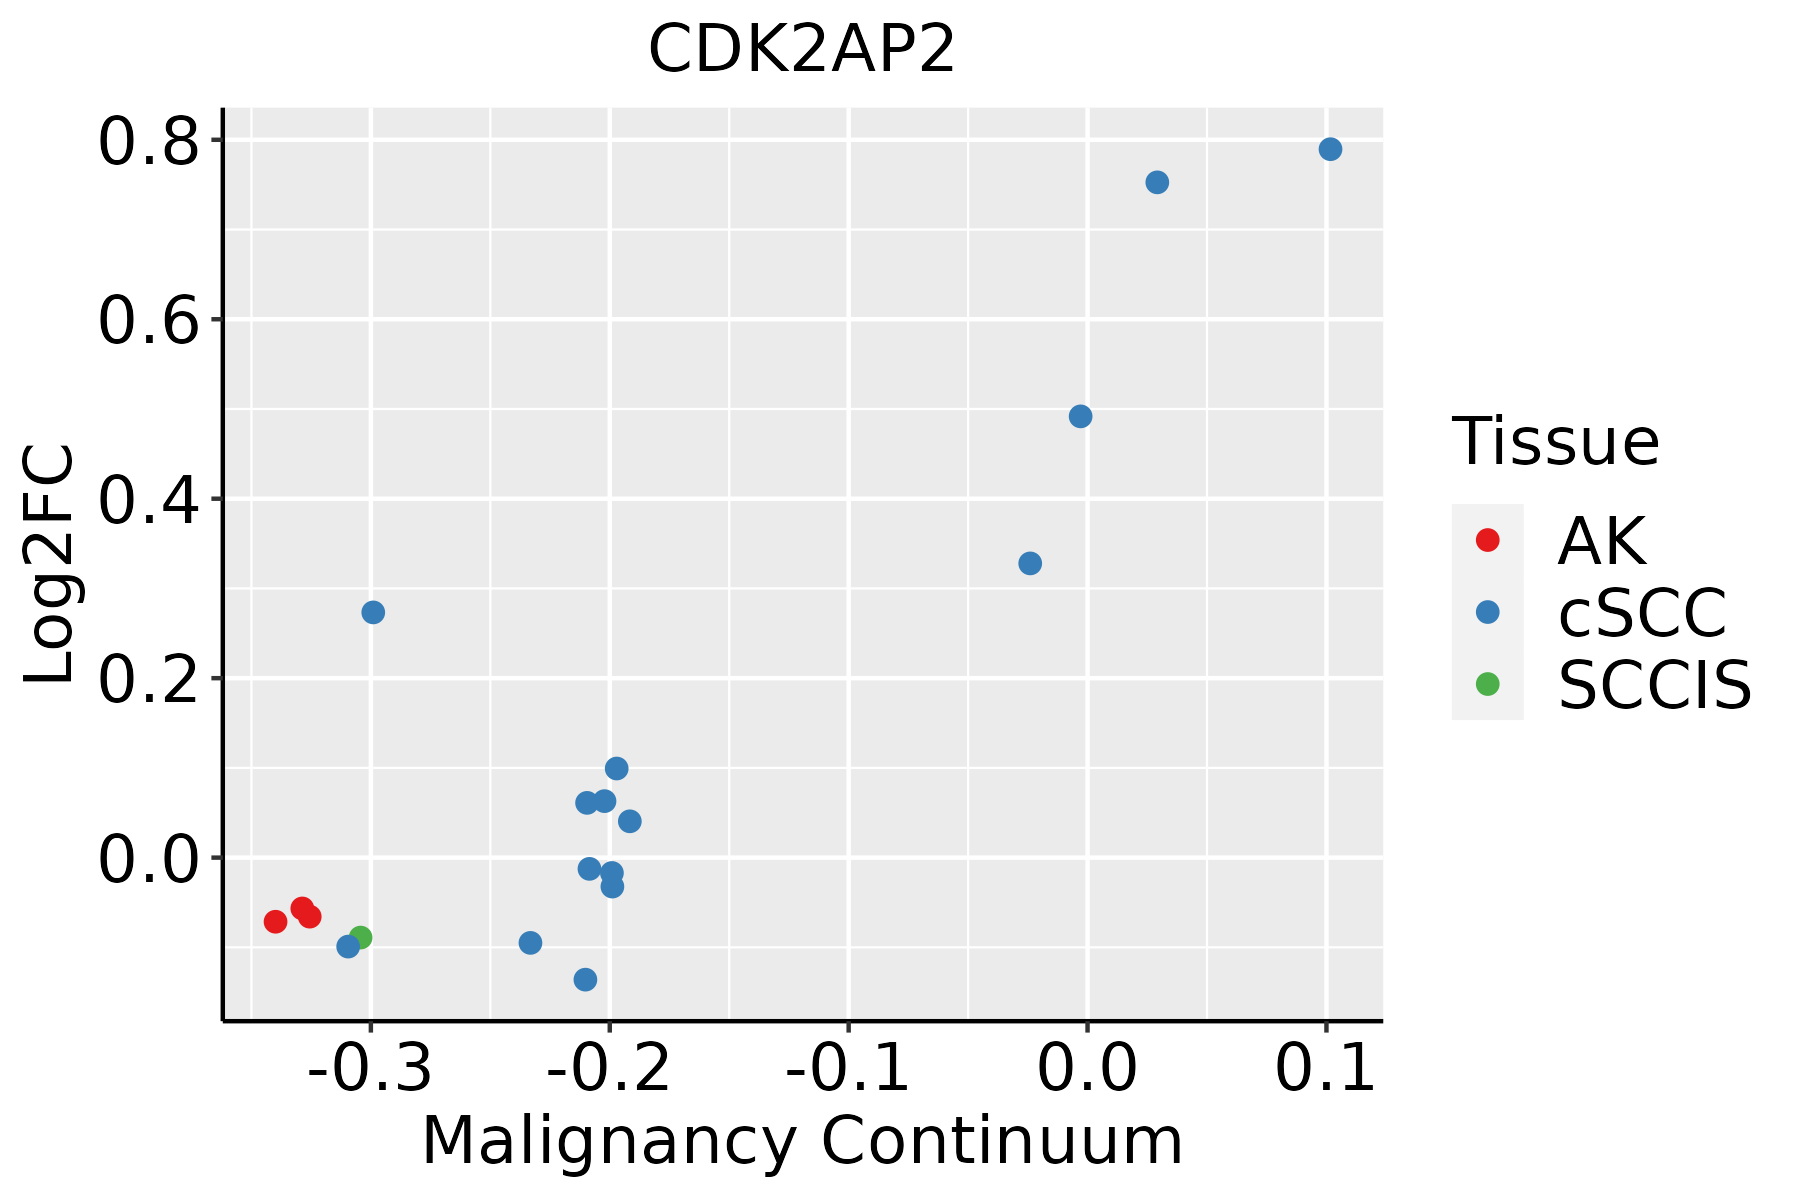
AK: Actinic keratosis
cSCC: Cutaneous squamous cell carcinoma
SCCIS:squamous cell carcinoma in situ
ThyroidThe image shows the transcriptomic changes along malignancy continuum.log2FC in expression of this searched gene in stem-like cells from each diseased tissue sample relative to stem-like cells in normal samples in each tissue plotted against the malignancy continuum. Samples are colored based on if they are from different disease stage.
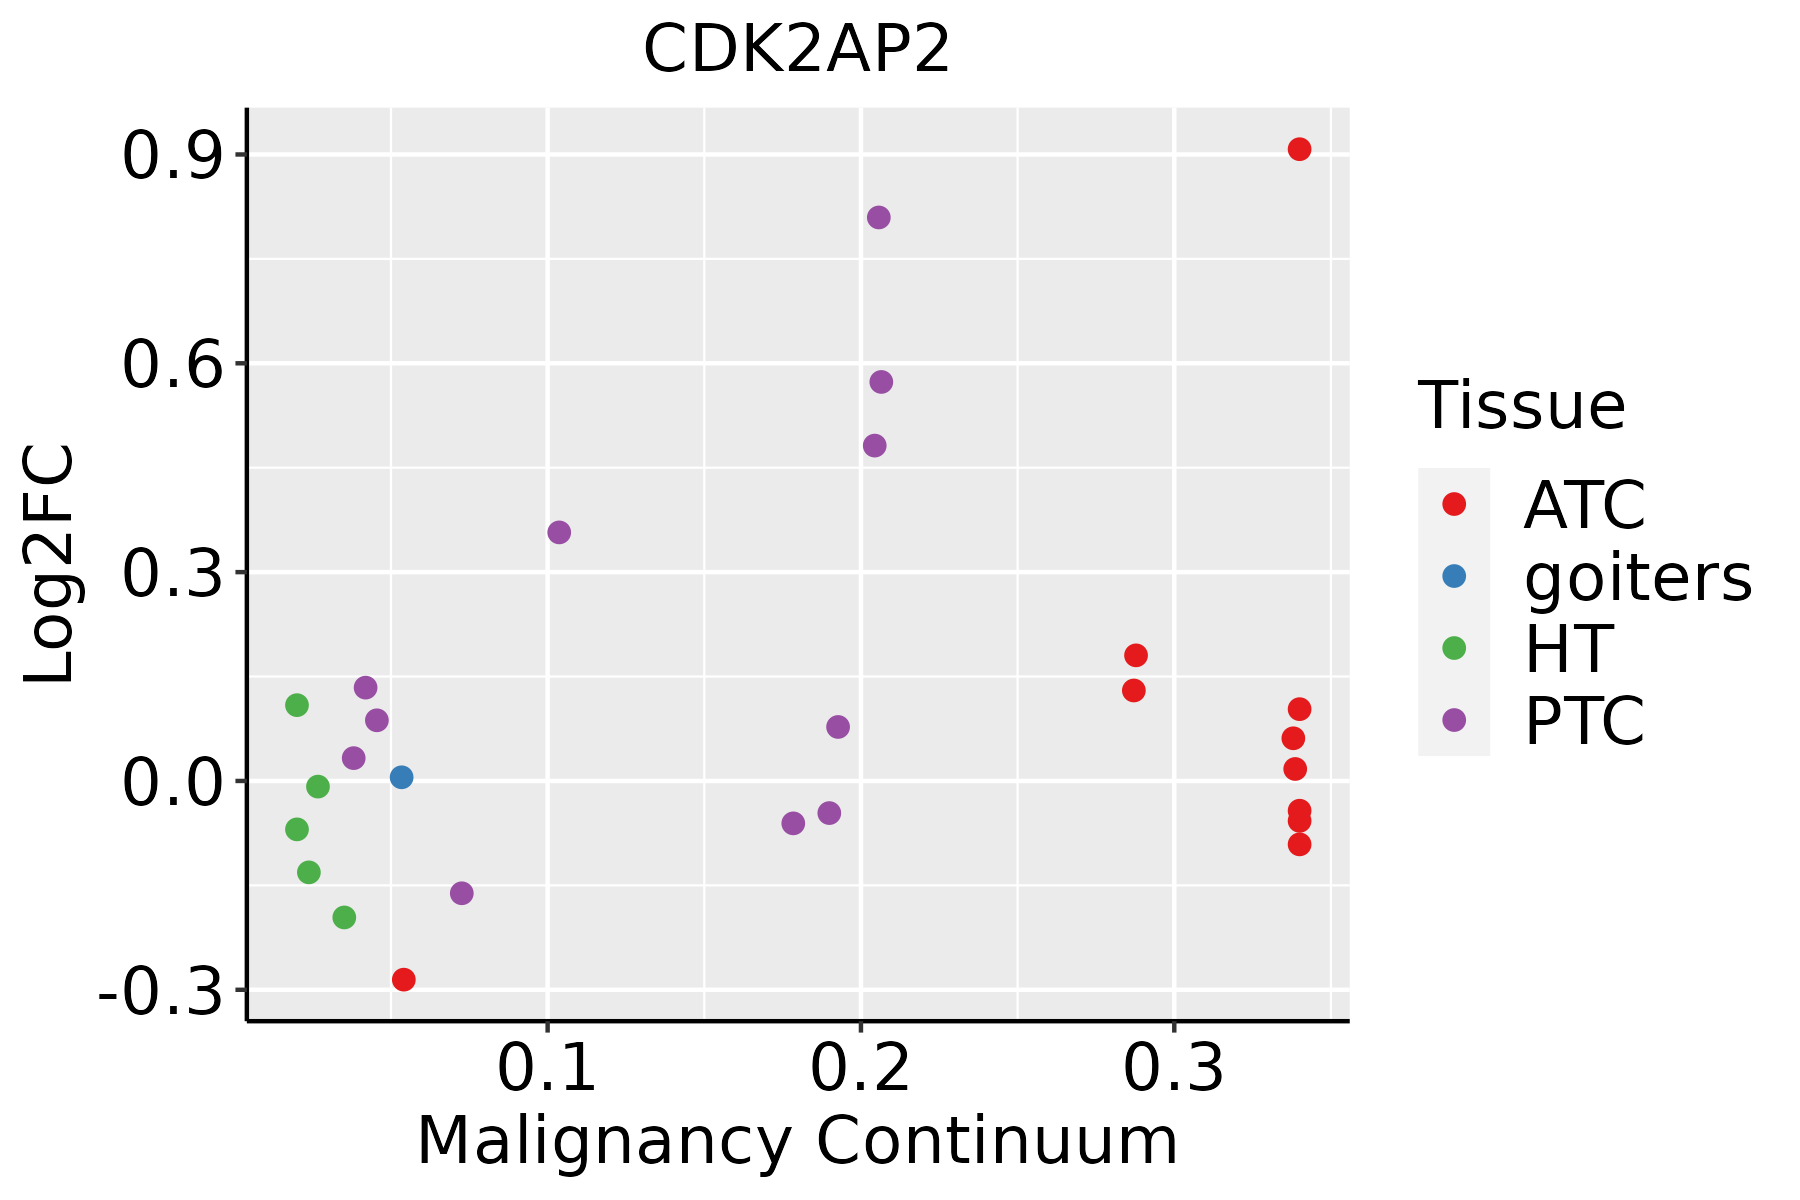
ATC: Anaplastic thyroid cancer
HT: Hashimoto's thyroiditis
PTC: Papillary thyroid cancer
∗log2FC in expression of this searched gene in stem-like cells from each diseased tissue sample relative to stem-like cells in normal samples in each tissue plotted against the malignancy continuum. Samples are colored based on if they are from different disease stage.

Top

Malignant transformation related pathway analysis

check buttonFind out the enriched GO biological processes and KEGG pathways involved in transition from healthy to precancer to cancer
check button Figure of enriched GO biological processes.
TissueDisease StageEnriched GO biological Processes
ColorectumADGO analysis - Figure of enriched GO biological processes: Top 15 enriched GO BP terms are showed in the bar plot of each disease state in each tissue. Each row represents a significant GO biological process which is colored according to the -log10(p.adjust).
ColorectumSERGO analysis - Figure of enriched GO biological processes: Top 15 enriched GO BP terms are showed in the bar plot of each disease state in each tissue. Each row represents a significant GO biological process which is colored according to the -log10(p.adjust).
ColorectumMSSGO analysis - Figure of enriched GO biological processes: Top 15 enriched GO BP terms are showed in the bar plot of each disease state in each tissue. Each row represents a significant GO biological process which is colored according to the -log10(p.adjust).
ColorectumMSI-HGO analysis - Figure of enriched GO biological processes: Top 15 enriched GO BP terms are showed in the bar plot of each disease state in each tissue. Each row represents a significant GO biological process which is colored according to the -log10(p.adjust).
ColorectumFAPGO analysis - Figure of enriched GO biological processes: Top 15 enriched GO BP terms are showed in the bar plot of each disease state in each tissue. Each row represents a significant GO biological process which is colored according to the -log10(p.adjust).
∗Top 15 enriched GO BP terms are showed in the bar plot of each disease state in each tissue. Each row represents a significant GO biological process which is colored according to the -log10(p.adjust).
Page: 1 2 3 4 5 6 7 8 9 

check button Enriched GO biological processes.
GO IDTissueDisease StageDescriptionGene RatioBg Ratiopvaluep.adjustCount
GO:0007346ColorectumADregulation of mitotic cell cycle119/3918457/187234.60e-033.14e-02119
GO:0070507ColorectumADregulation of microtubule cytoskeleton organization44/3918148/187237.05e-034.31e-0244
GO:00073461ColorectumMSSregulation of mitotic cell cycle108/3467457/187233.30e-032.50e-02108
GO:000734610EsophagusHGINregulation of mitotic cell cycle98/2587457/187234.39e-061.42e-0498
GO:00447729EsophagusHGINmitotic cell cycle phase transition89/2587424/187232.80e-057.21e-0489
GO:19019906EsophagusHGINregulation of mitotic cell cycle phase transition65/2587299/187231.12e-042.36e-0365
GO:20000456EsophagusHGINregulation of G1/S transition of mitotic cell cycle36/2587142/187231.74e-043.35e-0336
GO:00000827EsophagusHGING1/S transition of mitotic cell cycle48/2587214/187233.97e-046.07e-0348
GO:00448437EsophagusHGINcell cycle G1/S phase transition52/2587241/187236.19e-048.58e-0352
GO:19028065EsophagusHGINregulation of cell cycle G1/S phase transition39/2587168/187236.60e-049.03e-0339
GO:20001343EsophagusHGINnegative regulation of G1/S transition of mitotic cell cycle23/258784/187237.90e-041.03e-0223
GO:00459305EsophagusHGINnegative regulation of mitotic cell cycle49/2587235/187231.88e-032.01e-0249
GO:19019915EsophagusHGINnegative regulation of mitotic cell cycle phase transition39/2587179/187232.31e-032.36e-0239
GO:19028073EsophagusHGINnegative regulation of cell cycle G1/S phase transition23/258793/187233.39e-033.18e-0223
GO:19019876EsophagusHGINregulation of cell cycle phase transition72/2587390/187235.78e-034.70e-0272
GO:004477216EsophagusESCCmitotic cell cycle phase transition281/8552424/187234.63e-184.45e-16281
GO:000734615EsophagusESCCregulation of mitotic cell cycle293/8552457/187238.00e-165.64e-14293
GO:190198713EsophagusESCCregulation of cell cycle phase transition242/8552390/187233.86e-111.26e-09242
GO:190199013EsophagusESCCregulation of mitotic cell cycle phase transition191/8552299/187231.35e-103.94e-09191
GO:00457865EsophagusESCCnegative regulation of cell cycle236/8552385/187233.62e-109.93e-09236
Page: 1 2 3 4 5 6 7 8 9 

check button Enriched KEGG pathways.
Pathway IDTissueDisease StageDescriptionGene RatioBg Ratiopvaluep.adjustqvalueCount
Page: 1 

Top

Cell-cell communication analysis

check buttonIdentification of potential cell-cell interactions between two cell types and their ligand-receptor pairs for different disease states
LigandReceptorLRpairPathwayTissueDisease Stage
Page: 1 

Top

Single-cell gene regulatory network inference analysis

check buttonFind out the significant the regulons (TFs) and the target genes of each regulon across cell types for different disease states
TFCell TypeTissueDisease StageTarget GeneRSSRegulon Activity
∗The dot plots of a searched regulon are shown for all cell subpopulations in each disease state of each tissue based on the regulon specific score inferred using pySCENIC and by calculating the average expression.
Page: 1 

Top

Somatic mutation of malignant transformation related genes

check buttonAnnotation of somatic variants for genes involved in malignant transformation
Hugo SymbolVariant ClassVariant ClassificationdbSNP RSHGVScHGVSpHGVSp ShortSWISSPROTBIOTYPESIFTPolyPhenTumor Sample BarcodeTissueHistologySexAgeStageTherapy TypesDrugsOutcome
CDK2AP2SNVMissense_Mutationc.359N>Tp.Thr120Ilep.T120IO75956protein_codingdeleterious(0)possibly_damaging(0.834)TCGA-BH-A18G-01Breastbreast invasive carcinomaFemale>=65I/IIUnknownUnknownSD
CDK2AP2SNVMissense_Mutationc.275N>Gp.Tyr92Cysp.Y92CO75956protein_codingdeleterious(0)probably_damaging(0.975)TCGA-D8-A1XQ-01Breastbreast invasive carcinomaFemale>=65I/IIUnknownUnknownSD
CDK2AP2SNVMissense_Mutationnovelc.302N>Ap.Arg101Hisp.R101HO75956protein_codingdeleterious(0.02)probably_damaging(0.995)TCGA-2W-A8YY-01Cervixcervical & endocervical cancerFemale<65I/IIChemotherapycisplatinCR
CDK2AP2SNVMissense_Mutationc.377N>Tp.Thr126Metp.T126MO75956protein_codingdeleterious(0)probably_damaging(0.996)TCGA-EI-6882-01Colorectumrectum adenocarcinomaMale<65I/IIUnknownUnknownSD
CDK2AP2SNVMissense_Mutationnovelc.200C>Tp.Ala67Valp.A67VO75956protein_codingtolerated(0.1)benign(0.038)TCGA-AJ-A2QO-01Endometriumuterine corpus endometrioid carcinomaFemale>=65I/IIUnknownUnknownSD
CDK2AP2SNVMissense_Mutationnovelc.35G>Tp.Ser12Ilep.S12IO75956protein_codingtolerated_low_confidence(0.21)benign(0.007)TCGA-EO-A22U-01Endometriumuterine corpus endometrioid carcinomaFemale>=65I/IIUnknownUnknownSD
CDK2AP2insertionNonsense_Mutationnovelc.217_218insTTACTTTTAAAAACTGTTTTTAAATATACACGTAGACGAAAGTACp.Thr73delinsIleThrPheLysAsnCysPheTerIleTyrThrTerThrLysValProp.T73delinsITFKNCF*IYT*TKVPO75956protein_codingTCGA-AX-A06B-01Endometriumuterine corpus endometrioid carcinomaFemale>=65I/IIUnknownUnknownSD
CDK2AP2SNVMissense_Mutationc.221N>Gp.Tyr74Cysp.Y74CO75956protein_codingdeleterious(0)probably_damaging(0.992)TCGA-CC-A7IH-01Liverliver hepatocellular carcinomaMale<65III/IVUnknownUnknownSD
CDK2AP2SNVMissense_Mutationnovelc.125N>Tp.Ala42Valp.A42VO75956protein_codingdeleterious(0.01)benign(0.222)TCGA-22-1002-01Lunglung squamous cell carcinomaMale>=65I/IIUnknownUnknownSD
CDK2AP2SNVMissense_Mutationc.179A>Tp.Gln60Leup.Q60LO75956protein_codingdeleterious(0.04)benign(0.013)TCGA-66-2727-01Lunglung squamous cell carcinomaFemale<65I/IIUnknownUnknownSD
Page: 1 2 

Top

Related drugs of malignant transformation related genes

check buttonIdentification of chemicals and drugs interact with genes involved in malignant transfromation
(DGIdb 4.0)
Entrez IDSymbolCategoryInteraction TypesDrug Claim NameDrug NamePMIDs
Page: 1