
|
|||||
|
 | |
| |
| |
| |
| |
| |
|
Gene: CDK2AP1 |
Gene summary for CDK2AP1 |
| Gene information | Species | Human | Gene symbol | CDK2AP1 | Gene ID | 8099 |
| Gene name | cyclin dependent kinase 2 associated protein 1 | |
| Gene Alias | DOC1 | |
| Cytomap | 12q24.31 | |
| Gene Type | protein-coding | GO ID | GO:0001932 | UniProtAcc | O14519 |
Top |
Malignant transformation analysis |
| Identification of the aberrant gene expression in precancerous and cancerous lesions by comparing the gene expression of stem-like cells in diseased tissues with normal stem cells |
| Entrez ID | Symbol | Replicates | Species | Organ | Tissue | Adj P-value | Log2FC | Malignancy |
| 8099 | CDK2AP1 | CA_HPV_1 | Human | Cervix | CC | 1.34e-03 | -2.19e-01 | 0.0264 |
| 8099 | CDK2AP1 | CA_HPV_3 | Human | Cervix | CC | 7.95e-03 | 1.79e-01 | 0.0414 |
| 8099 | CDK2AP1 | CCII_1 | Human | Cervix | CC | 1.26e-09 | -4.08e-01 | 0.3249 |
| 8099 | CDK2AP1 | sample3 | Human | Cervix | CC | 1.59e-20 | 5.35e-01 | 0.1387 |
| 8099 | CDK2AP1 | T3 | Human | Cervix | CC | 4.20e-18 | 5.35e-01 | 0.1389 |
| 8099 | CDK2AP1 | AEH-subject1 | Human | Endometrium | AEH | 3.39e-09 | 3.38e-01 | -0.3059 |
| 8099 | CDK2AP1 | AEH-subject2 | Human | Endometrium | AEH | 9.22e-08 | 3.01e-01 | -0.2525 |
| 8099 | CDK2AP1 | AEH-subject3 | Human | Endometrium | AEH | 4.84e-10 | 3.73e-01 | -0.2576 |
| 8099 | CDK2AP1 | AEH-subject4 | Human | Endometrium | AEH | 1.09e-05 | 2.75e-01 | -0.2657 |
| 8099 | CDK2AP1 | AEH-subject5 | Human | Endometrium | AEH | 9.95e-08 | 2.71e-01 | -0.2953 |
| 8099 | CDK2AP1 | EEC-subject1 | Human | Endometrium | EEC | 1.70e-04 | 2.42e-01 | -0.2682 |
| 8099 | CDK2AP1 | EEC-subject4 | Human | Endometrium | EEC | 1.47e-11 | 4.10e-01 | -0.2571 |
| 8099 | CDK2AP1 | EEC-subject5 | Human | Endometrium | EEC | 2.12e-16 | 4.83e-01 | -0.249 |
| 8099 | CDK2AP1 | GSM6177620_NYU_UCEC1_lib1_lib1 | Human | Endometrium | EEC | 1.89e-21 | 7.20e-01 | -0.1869 |
| 8099 | CDK2AP1 | GSM6177620_NYU_UCEC1_lib2_lib2 | Human | Endometrium | EEC | 8.26e-17 | 7.10e-01 | -0.1875 |
| 8099 | CDK2AP1 | GSM6177620_NYU_UCEC1_lib3_lib3 | Human | Endometrium | EEC | 3.63e-25 | 8.23e-01 | -0.1883 |
| 8099 | CDK2AP1 | GSM6177621_NYU_UCEC2_lib1_lib1 | Human | Endometrium | EEC | 1.66e-23 | 6.54e-01 | -0.1934 |
| 8099 | CDK2AP1 | GSM6177622_NYU_UCEC3_lib1_lib1 | Human | Endometrium | EEC | 2.71e-18 | 6.05e-01 | -0.1917 |
| 8099 | CDK2AP1 | GSM6177622_NYU_UCEC3_lib2_lib2 | Human | Endometrium | EEC | 1.04e-14 | 5.64e-01 | -0.1916 |
| 8099 | CDK2AP1 | LZE2T | Human | Esophagus | ESCC | 1.52e-08 | 5.60e-01 | 0.082 |
| Page: 1 2 3 4 5 6 |
| Tissue | Expression Dynamics | Abbreviation |
| Cervix |  | CC: Cervix cancer |
| HSIL_HPV: HPV-infected high-grade squamous intraepithelial lesions | ||
| N_HPV: HPV-infected normal cervix | ||
| Endometrium | 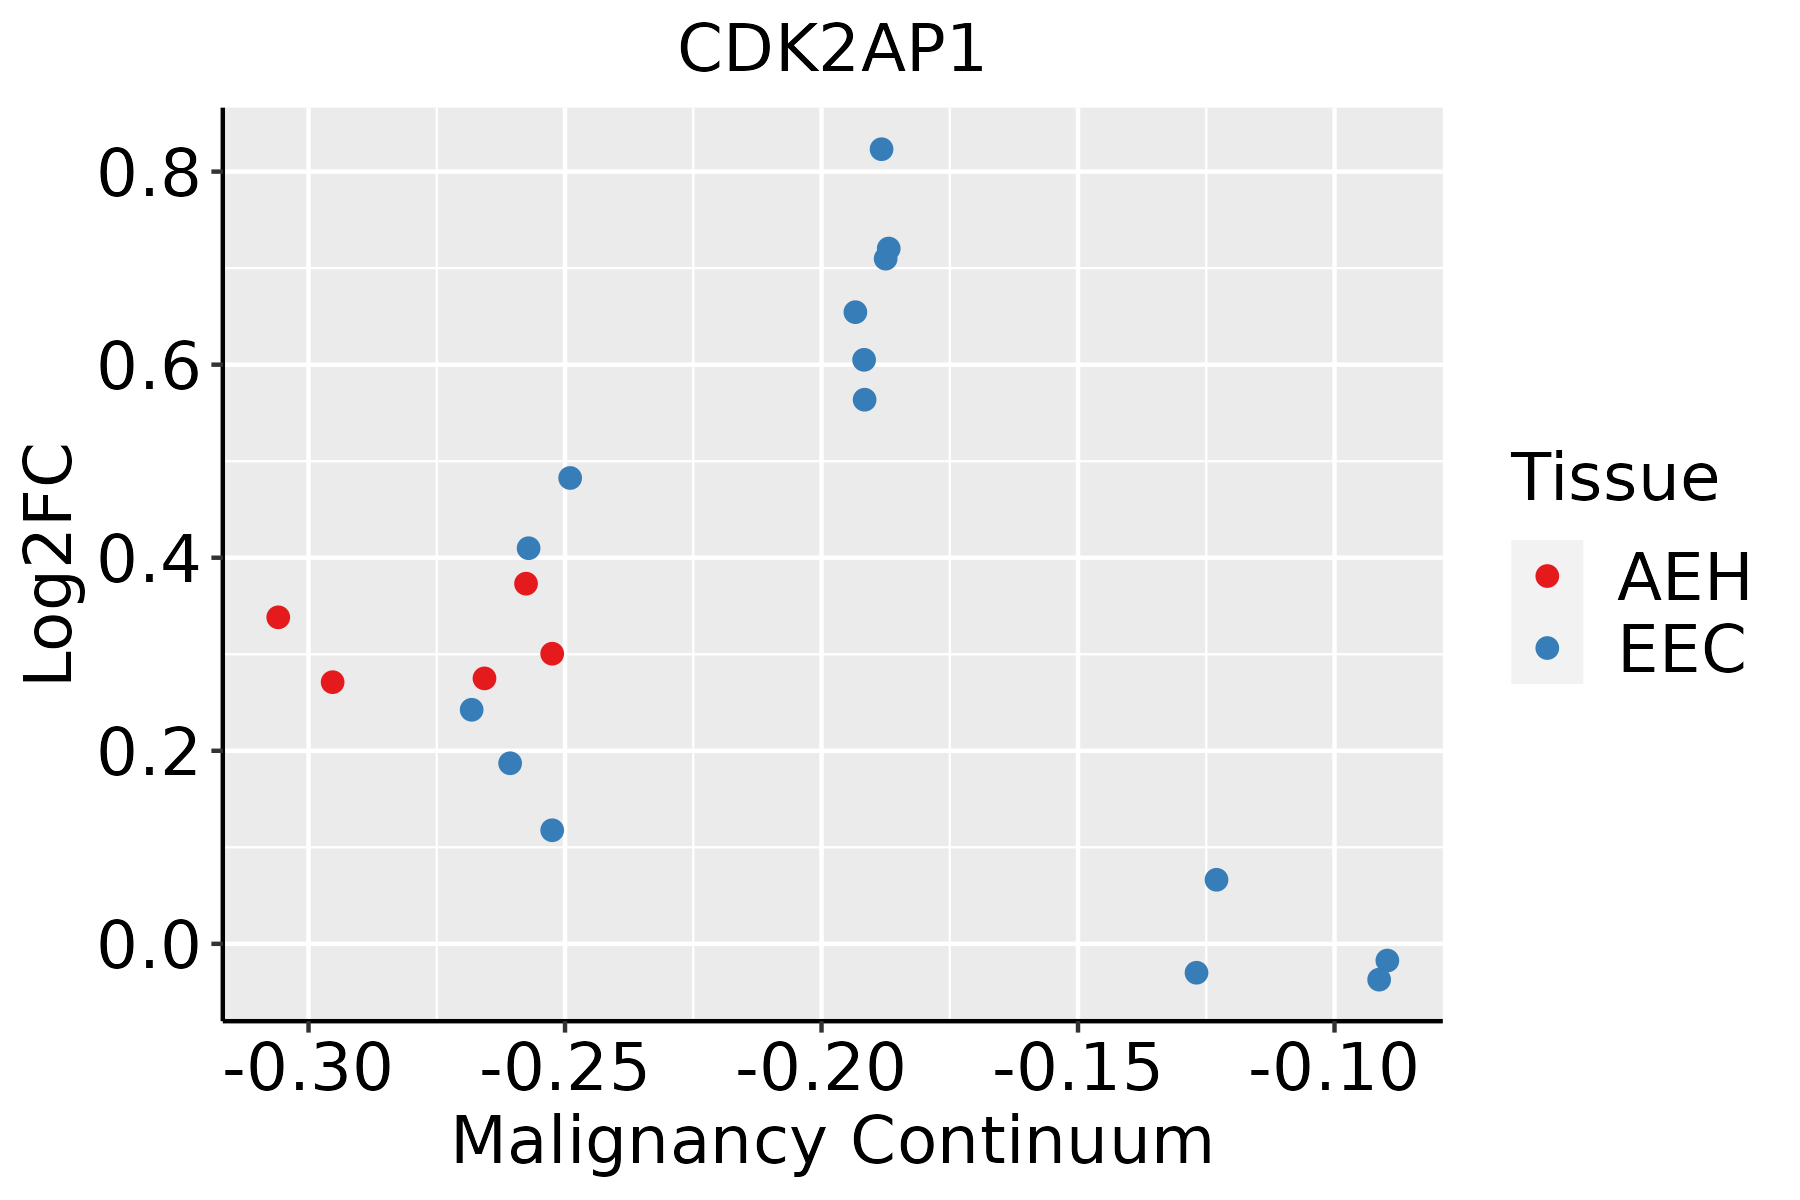 | AEH: Atypical endometrial hyperplasia |
| EEC: Endometrioid Cancer | ||
| Esophagus |  | ESCC: Esophageal squamous cell carcinoma |
| HGIN: High-grade intraepithelial neoplasias | ||
| LGIN: Low-grade intraepithelial neoplasias | ||
| Liver | 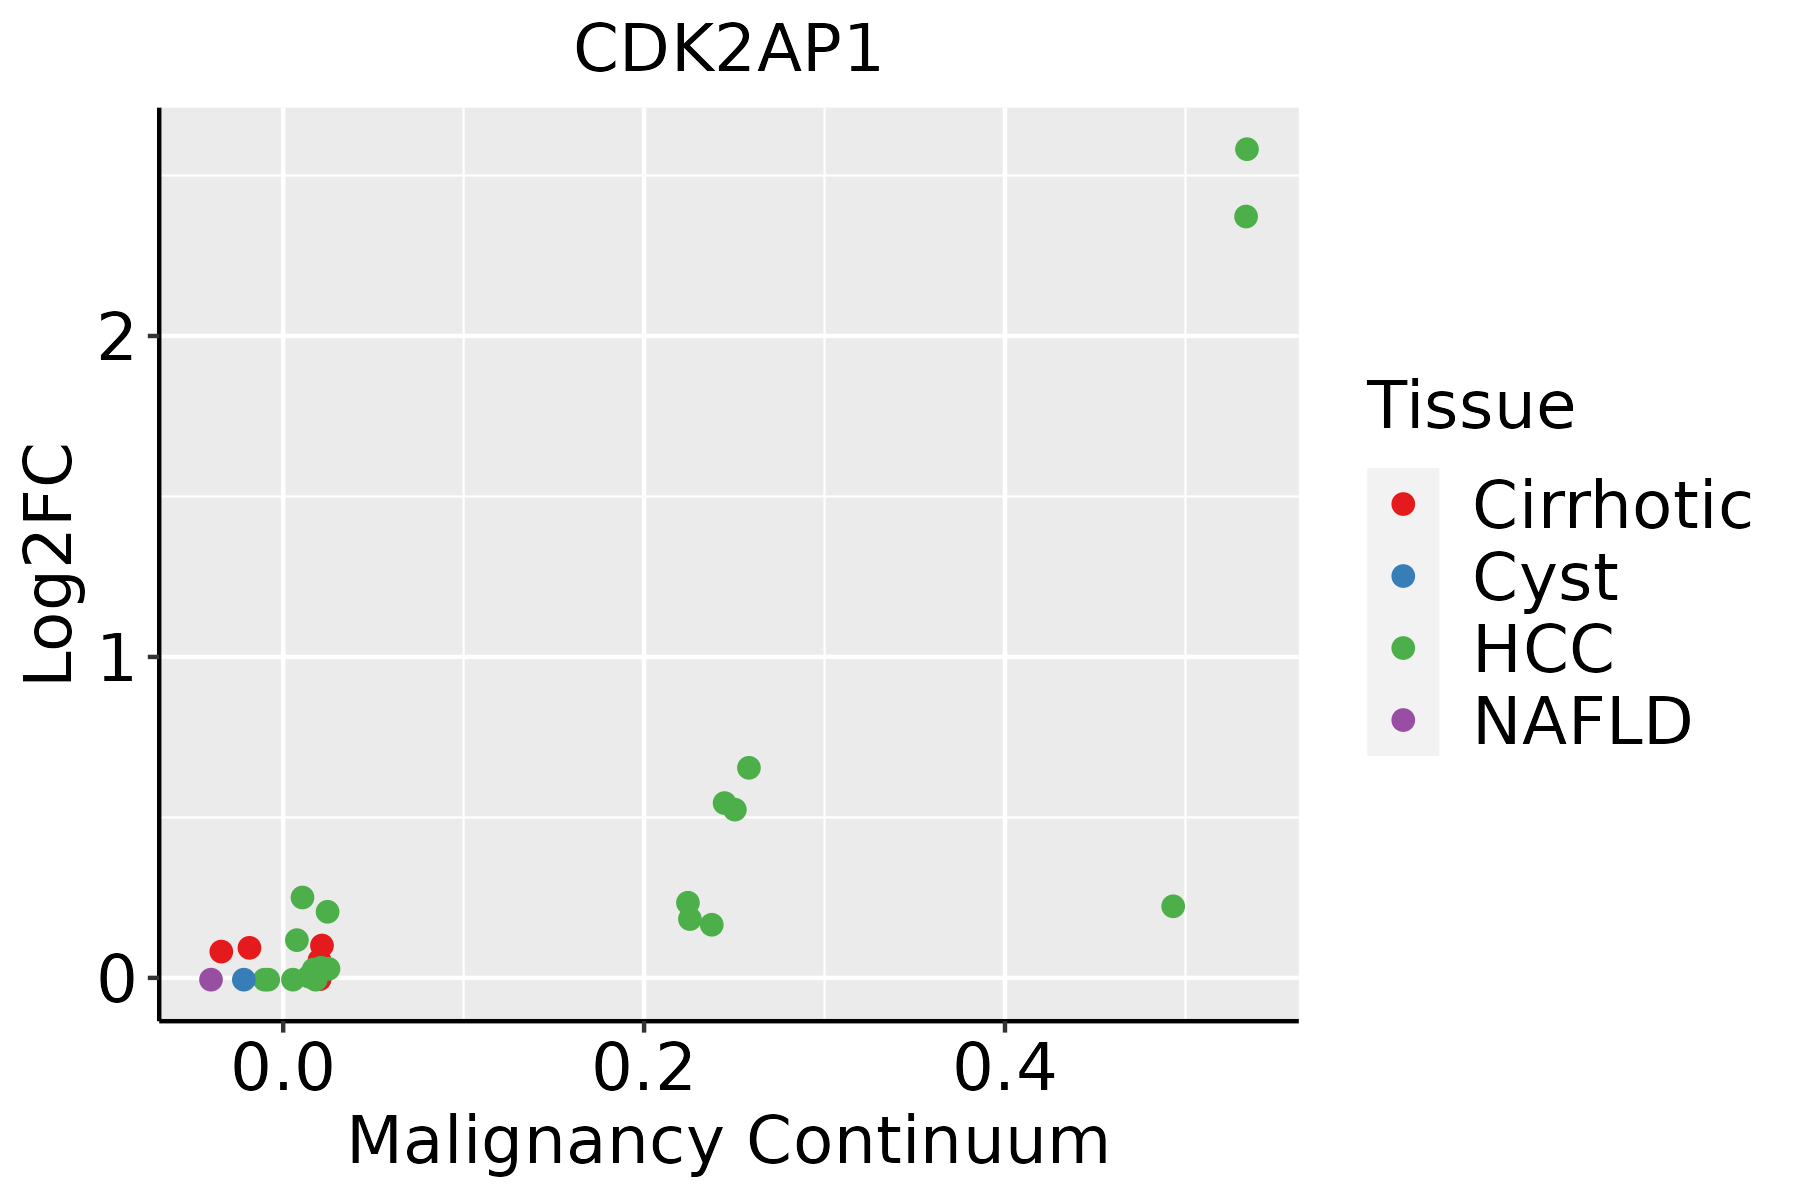 | HCC: Hepatocellular carcinoma |
| NAFLD: Non-alcoholic fatty liver disease | ||
| Oral Cavity | 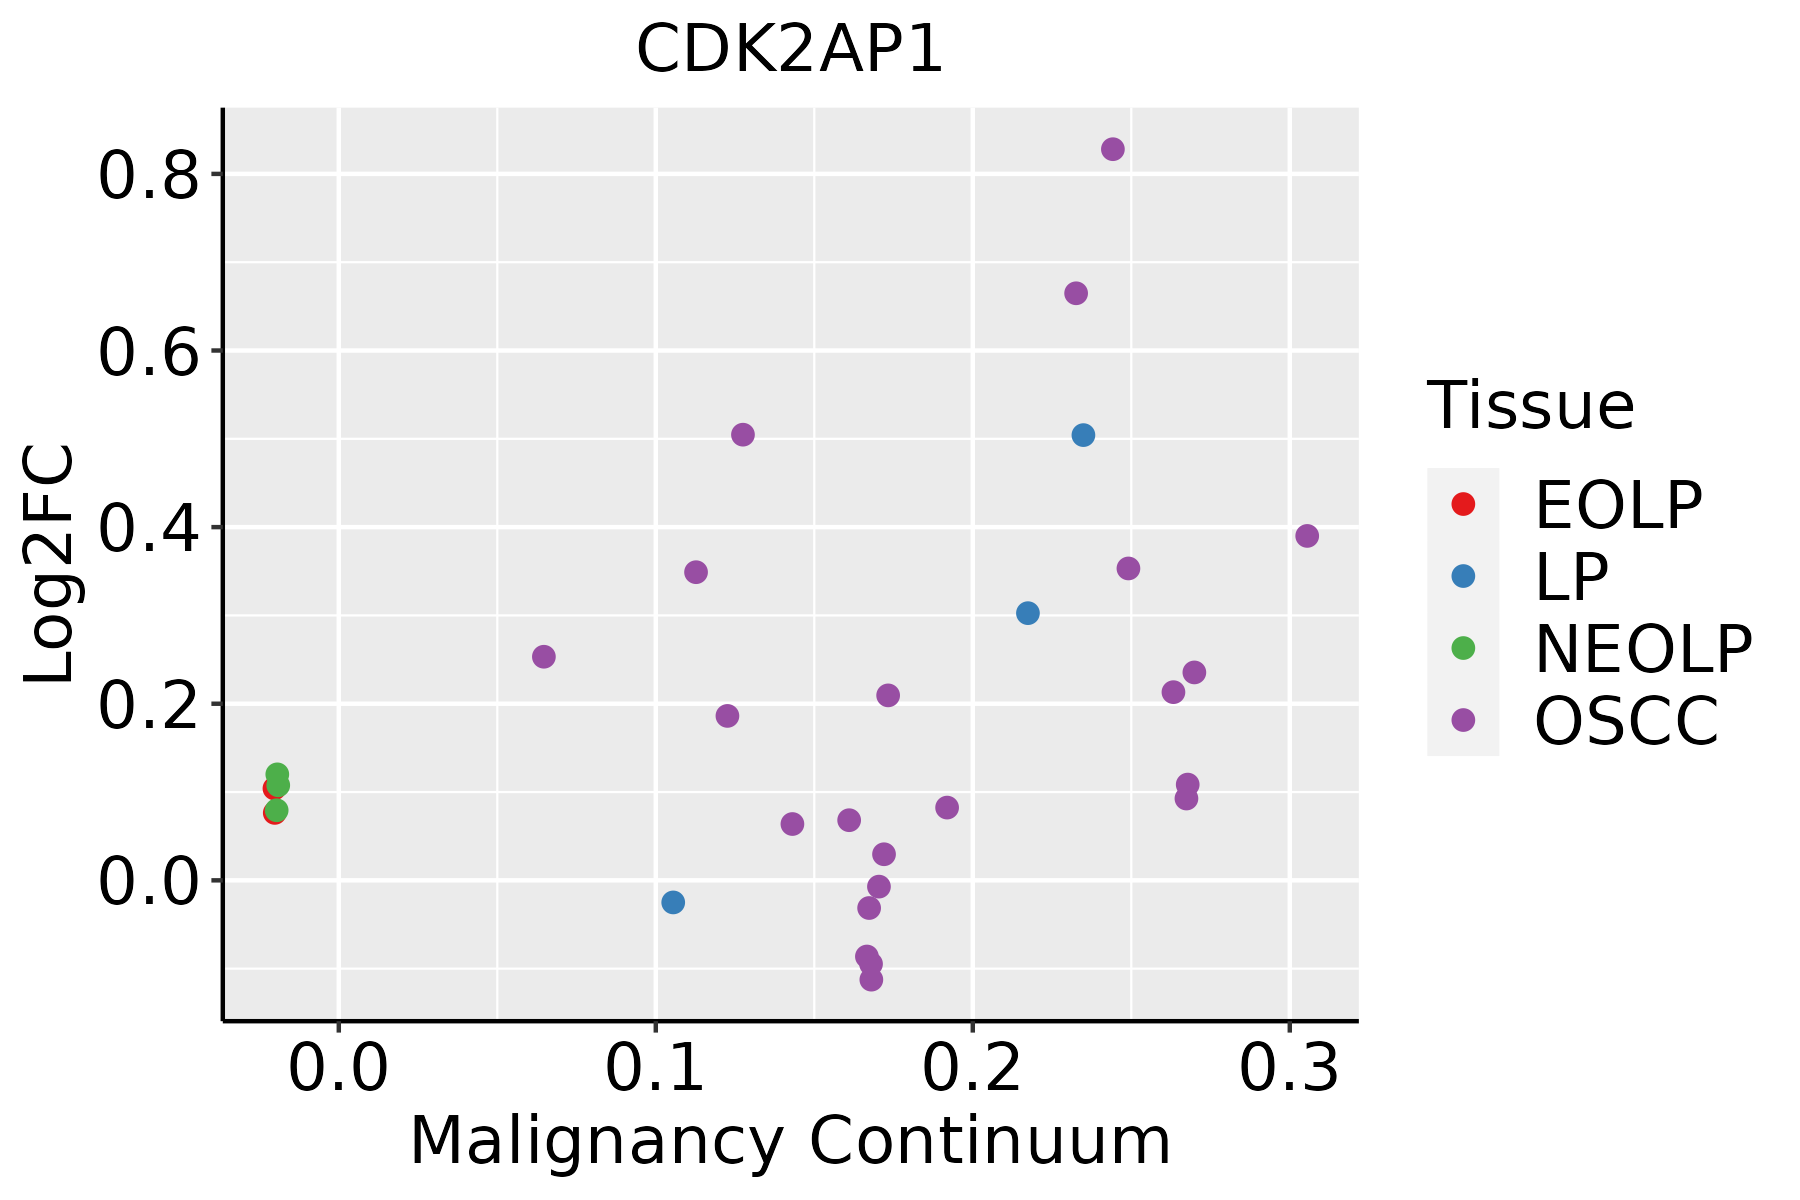 | EOLP: Erosive Oral lichen planus |
| LP: leukoplakia | ||
| NEOLP: Non-erosive oral lichen planus | ||
| OSCC: Oral squamous cell carcinoma |
| ∗log2FC in expression of this searched gene in stem-like cells from each diseased tissue sample relative to stem-like cells in normal samples in each tissue plotted against the malignancy continuum. Samples are colored based on if they are from different disease stage. |
Top |
Malignant transformation related pathway analysis |
| Find out the enriched GO biological processes and KEGG pathways involved in transition from healthy to precancer to cancer |
| Tissue | Disease Stage | Enriched GO biological Processes |
| Colorectum | AD |  |
| Colorectum | SER |  |
| Colorectum | MSS |  |
| Colorectum | MSI-H |  |
| Colorectum | FAP |  |
| ∗Top 15 enriched GO BP terms are showed in the bar plot of each disease state in each tissue. Each row represents a significant GO biological process which is colored according to the -log10(p.adjust). |
| Page: 1 2 3 4 5 6 7 8 9 |
| GO ID | Tissue | Disease Stage | Description | Gene Ratio | Bg Ratio | pvalue | p.adjust | Count |
| GO:00062602 | Cervix | CC | DNA replication | 48/2311 | 260/18723 | 2.70e-03 | 1.85e-02 | 48 |
| GO:00062604 | Esophagus | ESCC | DNA replication | 181/8552 | 260/18723 | 3.55e-15 | 2.05e-13 | 181 |
| GO:00062612 | Esophagus | ESCC | DNA-dependent DNA replication | 100/8552 | 151/18723 | 2.61e-07 | 3.94e-06 | 100 |
| GO:00062601 | Liver | HCC | DNA replication | 146/7958 | 260/18723 | 5.68e-06 | 7.02e-05 | 146 |
| GO:0006261 | Liver | HCC | DNA-dependent DNA replication | 80/7958 | 151/18723 | 5.91e-03 | 2.44e-02 | 80 |
| GO:00062603 | Oral cavity | OSCC | DNA replication | 159/7305 | 260/18723 | 3.25e-13 | 1.59e-11 | 159 |
| GO:00062611 | Oral cavity | OSCC | DNA-dependent DNA replication | 84/7305 | 151/18723 | 2.46e-05 | 2.30e-04 | 84 |
| Page: 1 |
| Pathway ID | Tissue | Disease Stage | Description | Gene Ratio | Bg Ratio | pvalue | p.adjust | qvalue | Count |
| Page: 1 |
Top |
Cell-cell communication analysis |
| Identification of potential cell-cell interactions between two cell types and their ligand-receptor pairs for different disease states |
| Ligand | Receptor | LRpair | Pathway | Tissue | Disease Stage |
| Page: 1 |
Top |
Single-cell gene regulatory network inference analysis |
| Find out the significant the regulons (TFs) and the target genes of each regulon across cell types for different disease states |
| TF | Cell Type | Tissue | Disease Stage | Target Gene | RSS | Regulon Activity |
| CDK2AP1 | PLA | Endometrium | ADJ | SOX17,NME2,CALHM6, etc. | 4.94e-02 |  |
| CDK2AP1 | TH1 | Endometrium | ADJ | SOX17,NME2,CALHM6, etc. | 1.02e-02 | |
| CDK2AP1 | M1MAC | Endometrium | AEH | SOX17,NME2,CALHM6, etc. | 3.82e-02 |  |
| CDK2AP1 | M1MAC | Endometrium | EEC | SOX17,NME2,CALHM6, etc. | 5.65e-02 |  |
| ∗The dot plots of a searched regulon are shown for all cell subpopulations in each disease state of each tissue based on the regulon specific score inferred using pySCENIC and by calculating the average expression. |
| Page: 1 |
Top |
Somatic mutation of malignant transformation related genes |
| Annotation of somatic variants for genes involved in malignant transformation |
| Hugo Symbol | Variant Class | Variant Classification | dbSNP RS | HGVSc | HGVSp | HGVSp Short | SWISSPROT | BIOTYPE | SIFT | PolyPhen | Tumor Sample Barcode | Tissue | Histology | Sex | Age | Stage | Therapy Types | Drugs | Outcome |
| CDK2AP1 | SNV | Missense_Mutation | c.134N>T | p.Pro45Leu | p.P45L | O14519 | protein_coding | deleterious(0) | possibly_damaging(0.872) | TCGA-AN-A0XV-01 | Breast | breast invasive carcinoma | Female | >=65 | III/IV | Unknown | Unknown | SD | |
| CDK2AP1 | SNV | Missense_Mutation | c.119N>A | p.Ser40Asn | p.S40N | O14519 | protein_coding | tolerated(0.6) | benign(0.011) | TCGA-AD-A5EJ-01 | Colorectum | colon adenocarcinoma | Female | >=65 | I/II | Unknown | Unknown | SD | |
| CDK2AP1 | SNV | Missense_Mutation | c.203C>T | p.Ala68Val | p.A68V | O14519 | protein_coding | deleterious(0.02) | benign(0.438) | TCGA-AM-5821-01 | Colorectum | colon adenocarcinoma | Female | >=65 | I/II | Unknown | Unknown | SD | |
| CDK2AP1 | SNV | Missense_Mutation | c.140T>C | p.Leu47Pro | p.L47P | O14519 | protein_coding | tolerated(0.05) | benign(0.146) | TCGA-AP-A054-01 | Endometrium | uterine corpus endometrioid carcinoma | Female | <65 | III/IV | Chemotherapy | carboplatin | PD | |
| CDK2AP1 | SNV | Missense_Mutation | c.134C>T | p.Pro45Leu | p.P45L | O14519 | protein_coding | deleterious(0) | possibly_damaging(0.872) | TCGA-AX-A2HA-01 | Endometrium | uterine corpus endometrioid carcinoma | Female | <65 | I/II | Unknown | Unknown | SD | |
| CDK2AP1 | SNV | Missense_Mutation | rs763372047 | c.167N>A | p.Ser56Asn | p.S56N | O14519 | protein_coding | tolerated(0.15) | benign(0.018) | TCGA-DF-A2KU-01 | Endometrium | uterine corpus endometrioid carcinoma | Female | Unknown | I/II | Unknown | Unknown | SD |
| CDK2AP1 | SNV | Missense_Mutation | novel | c.244N>A | p.Ala82Thr | p.A82T | O14519 | protein_coding | tolerated(0.14) | benign(0.103) | TCGA-EO-A3AZ-01 | Endometrium | uterine corpus endometrioid carcinoma | Female | >=65 | I/II | Unknown | Unknown | SD |
| CDK2AP1 | SNV | Missense_Mutation | c.77N>T | p.Ser26Phe | p.S26F | O14519 | protein_coding | deleterious(0.01) | possibly_damaging(0.509) | TCGA-60-2719-01 | Lung | lung squamous cell carcinoma | Female | >=65 | I/II | Unknown | Unknown | SD | |
| CDK2AP1 | SNV | Missense_Mutation | novel | c.244N>A | p.Ala82Thr | p.A82T | O14519 | protein_coding | tolerated(0.14) | benign(0.103) | TCGA-VQ-A8P2-01 | Stomach | stomach adenocarcinoma | Male | >=65 | III/IV | Unspecific | Complete Response |
| Page: 1 |
Top |
Related drugs of malignant transformation related genes |
| Identification of chemicals and drugs interact with genes involved in malignant transfromation |
| (DGIdb 4.0) |
| Entrez ID | Symbol | Category | Interaction Types | Drug Claim Name | Drug Name | PMIDs |
| Page: 1 |

Copyright 2023-Present -The University of Texas Health Science Center at Houston |