
|
|||||
|
 | |
| |
| |
| |
| |
| |
|
Gene: CDK14 |
Gene summary for CDK14 |
| Gene information | Species | Human | Gene symbol | CDK14 | Gene ID | 5218 |
| Gene name | cyclin dependent kinase 14 | |
| Gene Alias | PFTAIRE1 | |
| Cytomap | 7q21.13 | |
| Gene Type | protein-coding | GO ID | GO:0000082 | UniProtAcc | O94921 |
Top |
Malignant transformation analysis |
| Identification of the aberrant gene expression in precancerous and cancerous lesions by comparing the gene expression of stem-like cells in diseased tissues with normal stem cells |
| Entrez ID | Symbol | Replicates | Species | Organ | Tissue | Adj P-value | Log2FC | Malignancy |
| 5218 | CDK14 | NAFLD1 | Human | Liver | NAFLD | 1.31e-14 | 1.09e+00 | -0.04 |
| 5218 | CDK14 | S41 | Human | Liver | Cirrhotic | 8.34e-05 | 7.16e-01 | -0.0343 |
| 5218 | CDK14 | HCC1_Meng | Human | Liver | HCC | 2.46e-60 | -2.99e-01 | 0.0246 |
| 5218 | CDK14 | HCC2_Meng | Human | Liver | HCC | 7.93e-17 | -3.58e-01 | 0.0107 |
| 5218 | CDK14 | cirrhotic1 | Human | Liver | Cirrhotic | 3.60e-10 | -3.29e-01 | 0.0202 |
| 5218 | CDK14 | cirrhotic2 | Human | Liver | Cirrhotic | 8.60e-12 | -2.89e-01 | 0.0201 |
| 5218 | CDK14 | cirrhotic3 | Human | Liver | Cirrhotic | 4.83e-02 | -3.11e-01 | 0.0215 |
| 5218 | CDK14 | HCC2 | Human | Liver | HCC | 8.58e-08 | 3.58e+00 | 0.5341 |
| 5218 | CDK14 | Pt13.a | Human | Liver | HCC | 2.84e-08 | -3.50e-01 | 0.021 |
| 5218 | CDK14 | Pt13.b | Human | Liver | HCC | 6.70e-06 | -3.07e-01 | 0.0251 |
| 5218 | CDK14 | Pt13.c | Human | Liver | HCC | 3.88e-03 | -3.96e-01 | 0.0076 |
| 5218 | CDK14 | Pt14.d | Human | Liver | HCC | 2.65e-08 | -3.43e-01 | 0.0143 |
| 5218 | CDK14 | S016 | Human | Liver | HCC | 2.99e-03 | -3.62e-01 | 0.2243 |
| 5218 | CDK14 | S027 | Human | Liver | HCC | 8.25e-11 | 8.73e-01 | 0.2446 |
| 5218 | CDK14 | S028 | Human | Liver | HCC | 6.61e-27 | 1.27e+00 | 0.2503 |
| 5218 | CDK14 | S029 | Human | Liver | HCC | 2.49e-21 | 1.31e+00 | 0.2581 |
| 5218 | CDK14 | RNA-P17T-P17T-2 | Human | Lung | IAC | 2.43e-05 | 7.66e-01 | 0.3371 |
| 5218 | CDK14 | RNA-P17T-P17T-6 | Human | Lung | IAC | 8.23e-03 | 5.88e-01 | 0.3385 |
| 5218 | CDK14 | RNA-P17T-P17T-8 | Human | Lung | IAC | 4.29e-02 | 5.33e-01 | 0.3329 |
| 5218 | CDK14 | RNA-P25T1-P25T1-1 | Human | Lung | AIS | 2.75e-11 | 5.98e-01 | -0.2116 |
| Page: 1 2 3 |
| Tissue | Expression Dynamics | Abbreviation |
| Liver | 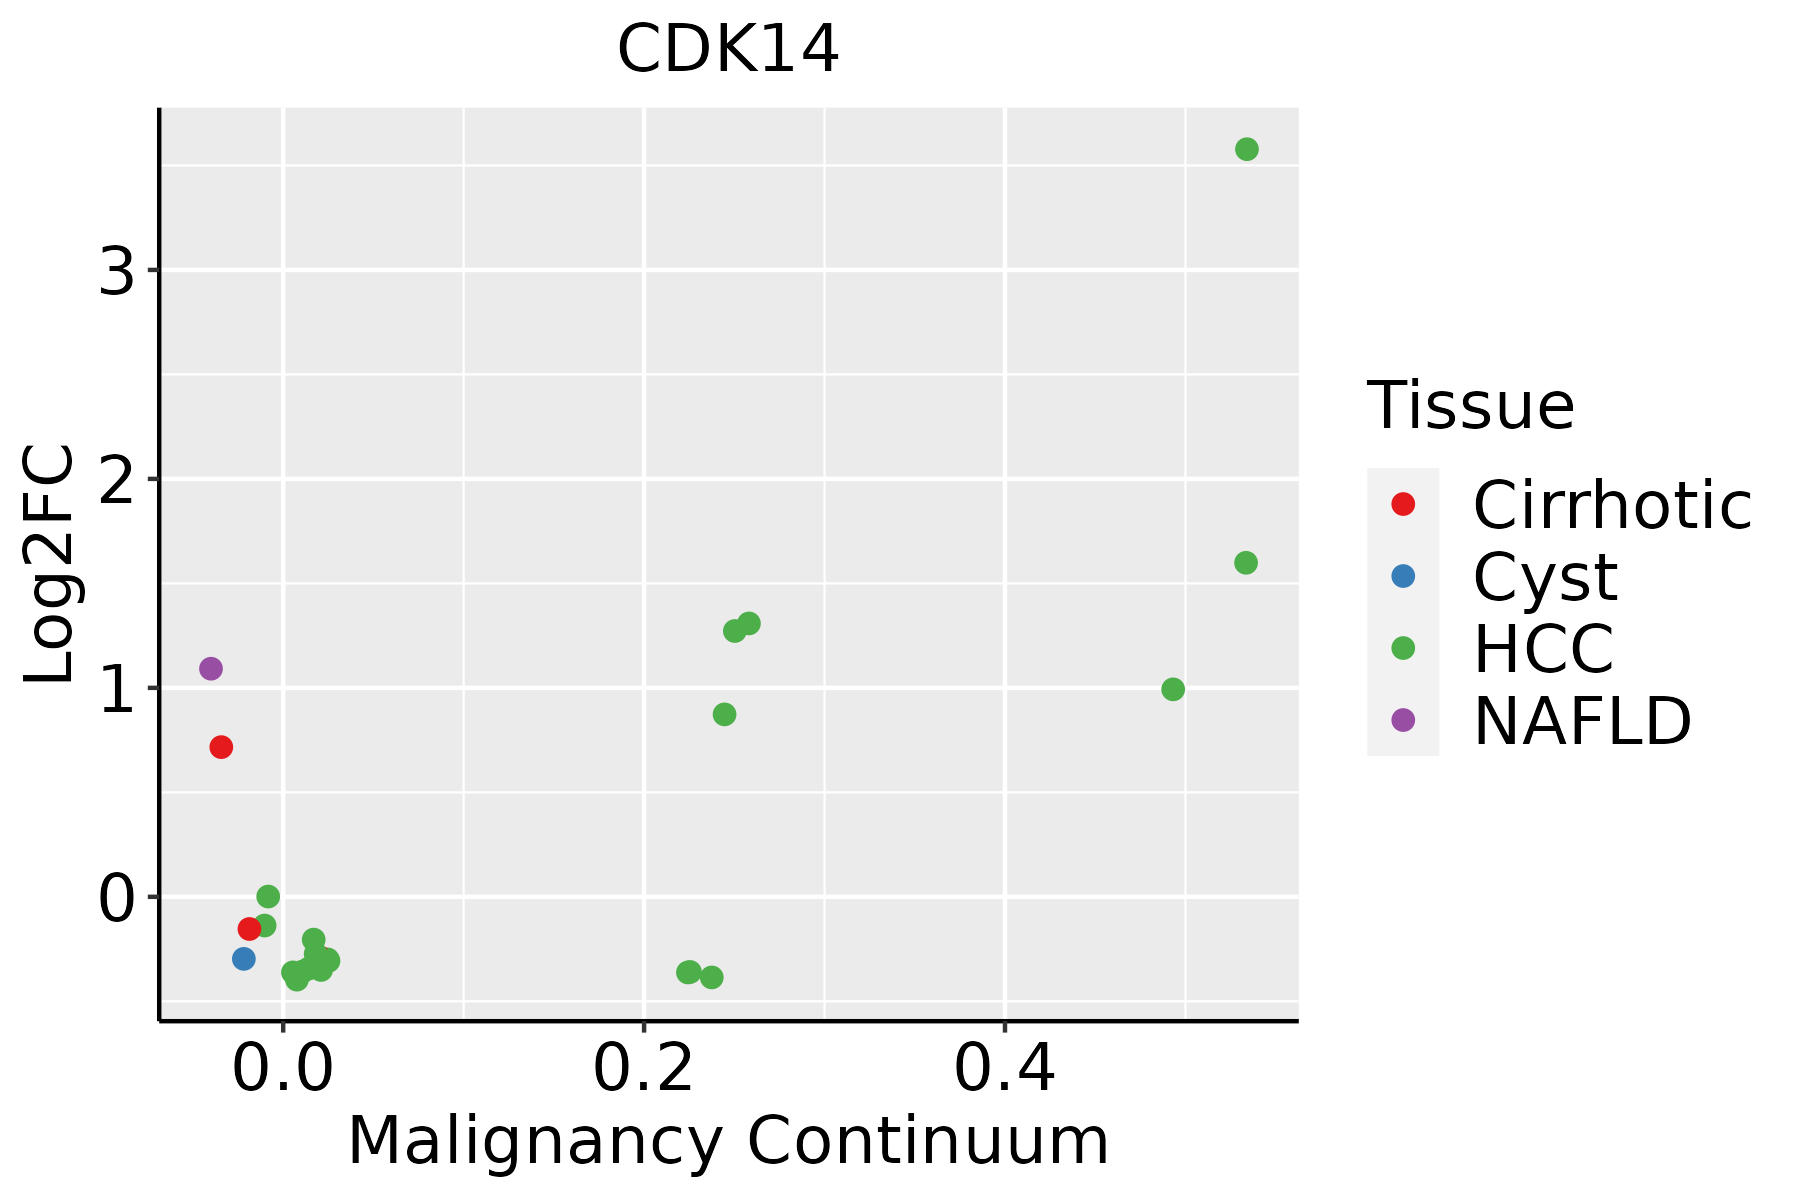 | HCC: Hepatocellular carcinoma |
| NAFLD: Non-alcoholic fatty liver disease | ||
| Lung | 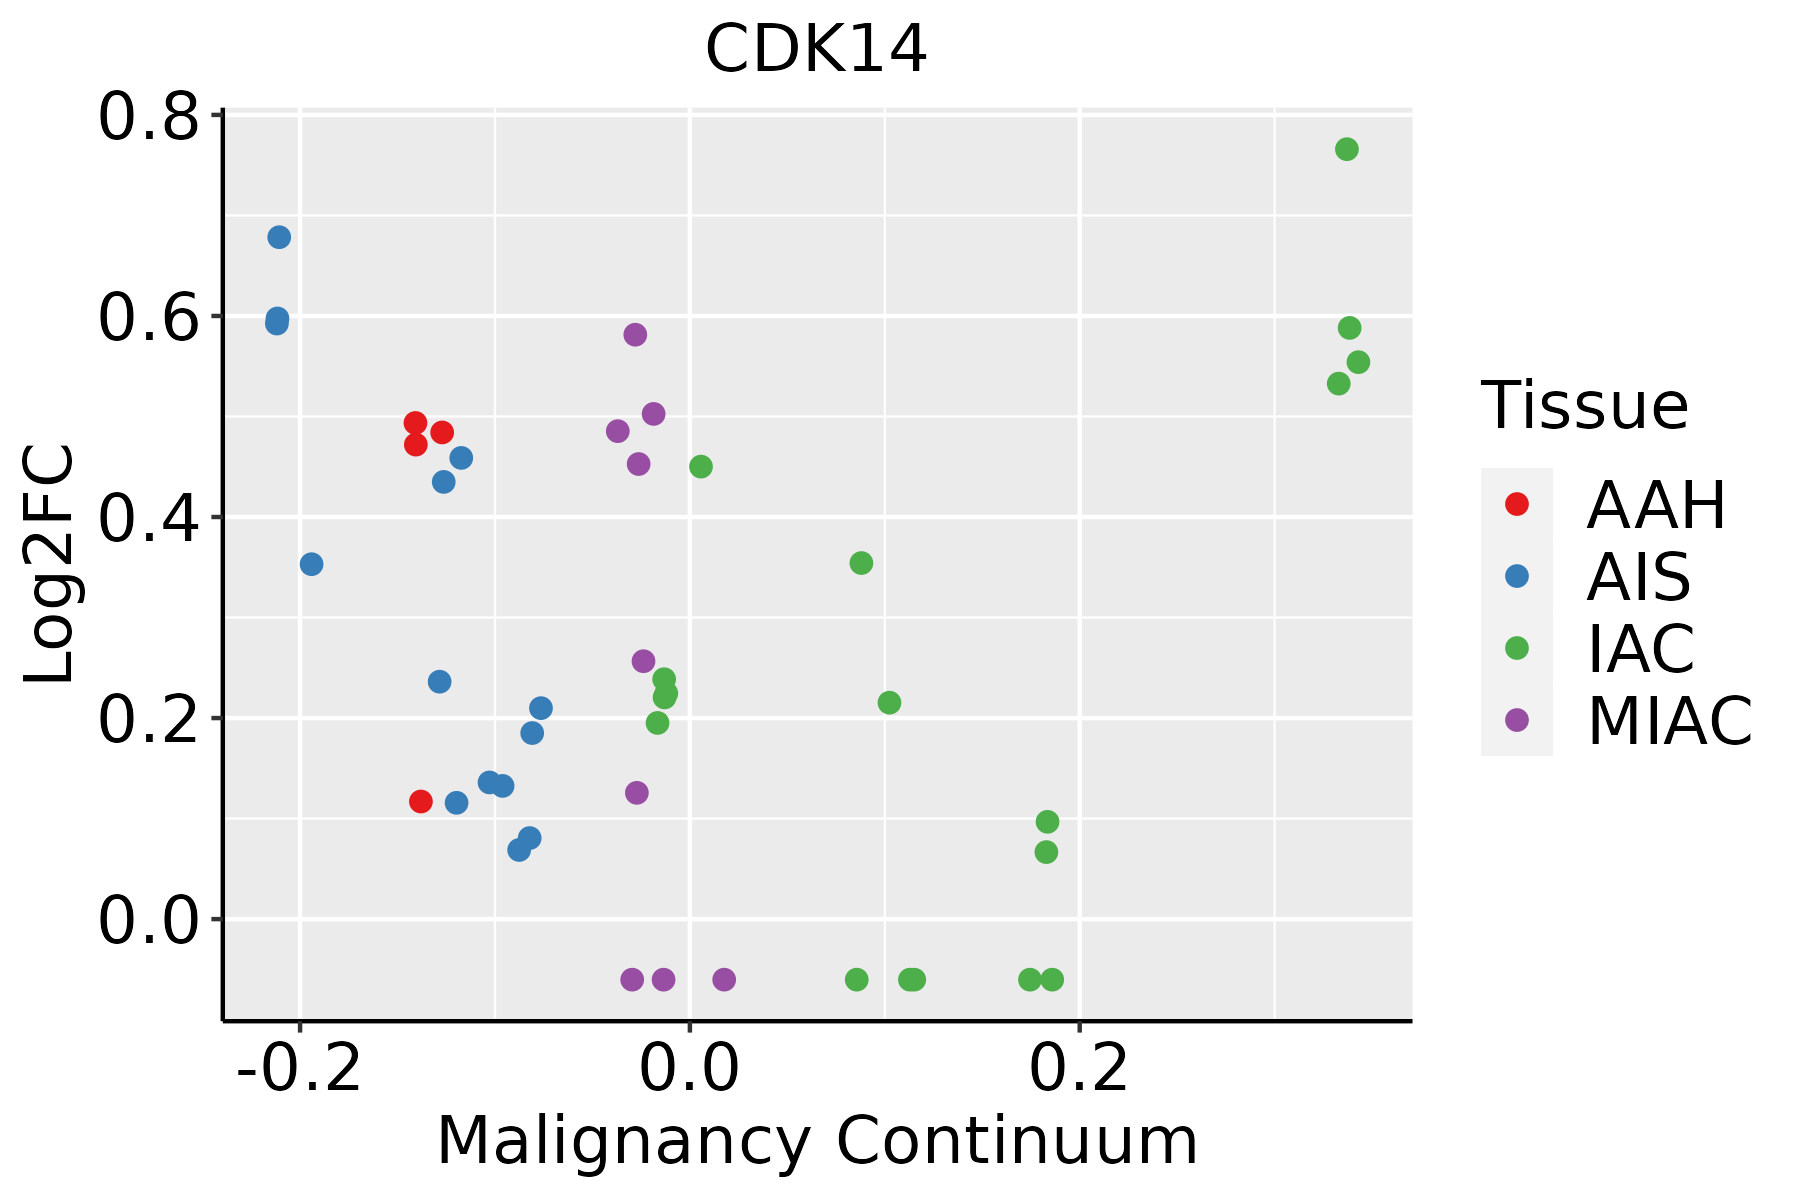 | AAH: Atypical adenomatous hyperplasia |
| AIS: Adenocarcinoma in situ | ||
| IAC: Invasive lung adenocarcinoma | ||
| MIA: Minimally invasive adenocarcinoma | ||
| Prostate |  | BPH: Benign Prostatic Hyperplasia |
| Thyroid |  | ATC: Anaplastic thyroid cancer |
| HT: Hashimoto's thyroiditis | ||
| PTC: Papillary thyroid cancer |
| ∗log2FC in expression of this searched gene in stem-like cells from each diseased tissue sample relative to stem-like cells in normal samples in each tissue plotted against the malignancy continuum. Samples are colored based on if they are from different disease stage. |
Top |
Malignant transformation related pathway analysis |
| Find out the enriched GO biological processes and KEGG pathways involved in transition from healthy to precancer to cancer |
| Tissue | Disease Stage | Enriched GO biological Processes |
| Colorectum | AD |  |
| Colorectum | SER |  |
| Colorectum | MSS |  |
| Colorectum | MSI-H |  |
| Colorectum | FAP |  |
| ∗Top 15 enriched GO BP terms are showed in the bar plot of each disease state in each tissue. Each row represents a significant GO biological process which is colored according to the -log10(p.adjust). |
| Page: 1 2 3 4 5 6 7 8 9 |
| GO ID | Tissue | Disease Stage | Description | Gene Ratio | Bg Ratio | pvalue | p.adjust | Count |
| GO:00160555 | Liver | NAFLD | Wnt signaling pathway | 74/1882 | 444/18723 | 8.98e-06 | 2.96e-04 | 74 |
| GO:01987385 | Liver | NAFLD | cell-cell signaling by wnt | 74/1882 | 446/18723 | 1.05e-05 | 3.33e-04 | 74 |
| GO:00301115 | Liver | NAFLD | regulation of Wnt signaling pathway | 57/1882 | 328/18723 | 2.79e-05 | 7.46e-04 | 57 |
| GO:0044772 | Liver | NAFLD | mitotic cell cycle phase transition | 67/1882 | 424/18723 | 1.25e-04 | 2.39e-03 | 67 |
| GO:0044843 | Liver | NAFLD | cell cycle G1/S phase transition | 43/1882 | 241/18723 | 1.40e-04 | 2.63e-03 | 43 |
| GO:0000082 | Liver | NAFLD | G1/S transition of mitotic cell cycle | 39/1882 | 214/18723 | 1.78e-04 | 3.14e-03 | 39 |
| GO:00608285 | Liver | NAFLD | regulation of canonical Wnt signaling pathway | 44/1882 | 253/18723 | 2.14e-04 | 3.68e-03 | 44 |
| GO:00600705 | Liver | NAFLD | canonical Wnt signaling pathway | 50/1882 | 303/18723 | 3.08e-04 | 4.83e-03 | 50 |
| GO:001605511 | Liver | Cirrhotic | Wnt signaling pathway | 150/4634 | 444/18723 | 9.75e-06 | 1.42e-04 | 150 |
| GO:019873811 | Liver | Cirrhotic | cell-cell signaling by wnt | 150/4634 | 446/18723 | 1.28e-05 | 1.80e-04 | 150 |
| GO:003011111 | Liver | Cirrhotic | regulation of Wnt signaling pathway | 112/4634 | 328/18723 | 7.57e-05 | 8.40e-04 | 112 |
| GO:00447721 | Liver | Cirrhotic | mitotic cell cycle phase transition | 139/4634 | 424/18723 | 1.02e-04 | 1.06e-03 | 139 |
| GO:006082811 | Liver | Cirrhotic | regulation of canonical Wnt signaling pathway | 86/4634 | 253/18723 | 5.70e-04 | 4.46e-03 | 86 |
| GO:00000821 | Liver | Cirrhotic | G1/S transition of mitotic cell cycle | 72/4634 | 214/18723 | 2.07e-03 | 1.28e-02 | 72 |
| GO:006007011 | Liver | Cirrhotic | canonical Wnt signaling pathway | 97/4634 | 303/18723 | 2.42e-03 | 1.46e-02 | 97 |
| GO:00448431 | Liver | Cirrhotic | cell cycle G1/S phase transition | 77/4634 | 241/18723 | 6.68e-03 | 3.30e-02 | 77 |
| GO:00447722 | Liver | HCC | mitotic cell cycle phase transition | 240/7958 | 424/18723 | 2.47e-09 | 6.84e-08 | 240 |
| GO:019873821 | Liver | HCC | cell-cell signaling by wnt | 247/7958 | 446/18723 | 2.11e-08 | 4.96e-07 | 247 |
| GO:001605521 | Liver | HCC | Wnt signaling pathway | 245/7958 | 444/18723 | 3.68e-08 | 8.09e-07 | 245 |
| GO:003011121 | Liver | HCC | regulation of Wnt signaling pathway | 180/7958 | 328/18723 | 3.62e-06 | 4.72e-05 | 180 |
| Page: 1 2 3 4 |
| Pathway ID | Tissue | Disease Stage | Description | Gene Ratio | Bg Ratio | pvalue | p.adjust | qvalue | Count |
| hsa052026 | Lung | IAC | Transcriptional misregulation in cancer | 40/1053 | 193/8465 | 6.90e-04 | 5.90e-03 | 3.92e-03 | 40 |
| hsa0520211 | Lung | IAC | Transcriptional misregulation in cancer | 40/1053 | 193/8465 | 6.90e-04 | 5.90e-03 | 3.92e-03 | 40 |
| hsa052022 | Lung | AIS | Transcriptional misregulation in cancer | 39/961 | 193/8465 | 2.15e-04 | 2.41e-03 | 1.54e-03 | 39 |
| hsa052023 | Lung | AIS | Transcriptional misregulation in cancer | 39/961 | 193/8465 | 2.15e-04 | 2.41e-03 | 1.54e-03 | 39 |
| hsa052027 | Prostate | BPH | Transcriptional misregulation in cancer | 53/1718 | 193/8465 | 9.56e-03 | 2.92e-02 | 1.81e-02 | 53 |
| hsa0520212 | Prostate | BPH | Transcriptional misregulation in cancer | 53/1718 | 193/8465 | 9.56e-03 | 2.92e-02 | 1.81e-02 | 53 |
| hsa0520221 | Prostate | Tumor | Transcriptional misregulation in cancer | 59/1791 | 193/8465 | 1.22e-03 | 5.26e-03 | 3.26e-03 | 59 |
| hsa0520231 | Prostate | Tumor | Transcriptional misregulation in cancer | 59/1791 | 193/8465 | 1.22e-03 | 5.26e-03 | 3.26e-03 | 59 |
| Page: 1 |
Top |
Cell-cell communication analysis |
| Identification of potential cell-cell interactions between two cell types and their ligand-receptor pairs for different disease states |
| Ligand | Receptor | LRpair | Pathway | Tissue | Disease Stage |
| Page: 1 |
Top |
Single-cell gene regulatory network inference analysis |
| Find out the significant the regulons (TFs) and the target genes of each regulon across cell types for different disease states |
| TF | Cell Type | Tissue | Disease Stage | Target Gene | RSS | Regulon Activity |
| ∗The dot plots of a searched regulon are shown for all cell subpopulations in each disease state of each tissue based on the regulon specific score inferred using pySCENIC and by calculating the average expression. |
| Page: 1 |
Top |
Somatic mutation of malignant transformation related genes |
| Annotation of somatic variants for genes involved in malignant transformation |
| Hugo Symbol | Variant Class | Variant Classification | dbSNP RS | HGVSc | HGVSp | HGVSp Short | SWISSPROT | BIOTYPE | SIFT | PolyPhen | Tumor Sample Barcode | Tissue | Histology | Sex | Age | Stage | Therapy Types | Drugs | Outcome |
| CDK14 | SNV | Missense_Mutation | c.1291G>A | p.Asp431Asn | p.D431N | O94921 | protein_coding | deleterious(0.02) | benign(0.005) | TCGA-A7-A0CE-01 | Breast | breast invasive carcinoma | Female | <65 | I/II | Chemotherapy | adriamycin | SD | |
| CDK14 | SNV | Missense_Mutation | rs776229393 | c.592N>A | p.Asp198Asn | p.D198N | O94921 | protein_coding | deleterious(0) | probably_damaging(0.972) | TCGA-A8-A06Q-01 | Breast | breast invasive carcinoma | Female | <65 | III/IV | Unknown | Unknown | SD |
| CDK14 | SNV | Missense_Mutation | c.199N>A | p.Glu67Lys | p.E67K | O94921 | protein_coding | tolerated(0.28) | benign(0.02) | TCGA-AC-A23C-01 | Breast | breast invasive carcinoma | Female | <65 | I/II | Chemotherapy | chemo | CR | |
| CDK14 | SNV | Missense_Mutation | novel | c.1014N>G | p.Ile338Met | p.I338M | O94921 | protein_coding | tolerated(0.09) | possibly_damaging(0.583) | TCGA-AR-A0U0-01 | Breast | breast invasive carcinoma | Female | >=65 | I/II | Unknown | Unknown | SD |
| CDK14 | SNV | Missense_Mutation | rs765001934 | c.847N>A | p.Val283Ile | p.V283I | O94921 | protein_coding | tolerated(0.73) | benign(0.003) | TCGA-BH-A18G-01 | Breast | breast invasive carcinoma | Female | >=65 | I/II | Unknown | Unknown | SD |
| CDK14 | insertion | Frame_Shift_Ins | novel | c.729_730insAGAATAAA | p.Leu244ArgfsTer17 | p.L244Rfs*17 | O94921 | protein_coding | TCGA-AR-A0TY-01 | Breast | breast invasive carcinoma | Female | <65 | I/II | Unspecific | Paclitaxel | PD | ||
| CDK14 | insertion | Frame_Shift_Ins | novel | c.730_731insTTTCAGTAAGTATTAGTCTCCCTTCTTTTCTTTTTAG | p.Tyr246ValfsTer33 | p.Y246Vfs*33 | O94921 | protein_coding | TCGA-AR-A0TY-01 | Breast | breast invasive carcinoma | Female | <65 | I/II | Unspecific | Paclitaxel | PD | ||
| CDK14 | insertion | In_Frame_Ins | novel | c.1016_1017insGTATTT | p.Gln339_Asp340insTyrLeu | p.Q339_D340insYL | O94921 | protein_coding | TCGA-AR-A0U0-01 | Breast | breast invasive carcinoma | Female | >=65 | I/II | Unknown | Unknown | SD | ||
| CDK14 | SNV | Missense_Mutation | novel | c.575A>G | p.Asn192Ser | p.N192S | O94921 | protein_coding | deleterious(0.02) | probably_damaging(0.953) | TCGA-2W-A8YY-01 | Cervix | cervical & endocervical cancer | Female | <65 | I/II | Chemotherapy | cisplatin | CR |
| CDK14 | SNV | Missense_Mutation | novel | c.1387A>G | p.Ser463Gly | p.S463G | O94921 | protein_coding | tolerated_low_confidence(0.2) | benign(0) | TCGA-C5-A2LZ-01 | Cervix | cervical & endocervical cancer | Female | >=65 | III/IV | Unknown | Unknown | PD |
| Page: 1 2 3 4 5 6 7 8 9 |
Top |
Related drugs of malignant transformation related genes |
| Identification of chemicals and drugs interact with genes involved in malignant transfromation |
| (DGIdb 4.0) |
| Entrez ID | Symbol | Category | Interaction Types | Drug Claim Name | Drug Name | PMIDs |
| 5218 | CDK14 | DRUGGABLE GENOME, KINASE, SERINE THREONINE KINASE, TUMOR SUPPRESSOR, ENZYME | inhibitor | CHEMBL445813 | AT-7519 | |
| 5218 | CDK14 | DRUGGABLE GENOME, KINASE, SERINE THREONINE KINASE, TUMOR SUPPRESSOR, ENZYME | inhibitor | CHEMBL3544942 | RONICICLIB | |
| 5218 | CDK14 | DRUGGABLE GENOME, KINASE, SERINE THREONINE KINASE, TUMOR SUPPRESSOR, ENZYME | inhibitor | CHEMBL1230607 | PHA-793887 | |
| 5218 | CDK14 | DRUGGABLE GENOME, KINASE, SERINE THREONINE KINASE, TUMOR SUPPRESSOR, ENZYME | inhibitor | CHEMBL488436 | AZD-5438 |
| Page: 1 |

Copyright 2023-Present -The University of Texas Health Science Center at Houston |