Schematic overview of the cellular and molecular mechanisms involved in the cancer progression, including the proposed cellular and molecular mechanisms in cancer cells trajectory. AT1: alveolar type 1 cells; AT2: alveolar type 2 cells; AAH: atypical adenomatous hyperplasia; AIS: adenocarcinoma in situ; MIA: minimally invasive adenocarcinoma; IA: invasive adenocarcinoma; EMT: epithelial-mesenchymal transition

Home

Download

Statistics

Help

Contact

Center for Computational Systems Medicine
leaf

Gene summary

leaf

Malignant transformation analysis

leaf

Malignant transformation related pathway analysis

leaf

Cell-cell communication analysis

leaf

Single-cell gene regulatory network inference analysis

leaf

Somatic mutation of malignant transformation related genes

leaf

Related drugs of malignant transformation related genes

Gene: CDK13

Gene summary for CDK13

check button Gene summary.

Gene informationSpeciesHuman
Gene symbol

CDK13

Gene ID

8621

Gene namecyclin dependent kinase 13
Gene AliasCDC2L
Cytomap7p14.1
Gene Typeprotein-coding
GO ID

GO:0000278

UniProtAcc

A0A024RA85


Top

Malignant transformation analysis

check button Identification of the aberrant gene expression in precancerous and cancerous lesions by comparing the gene expression of stem-like cells in diseased tissues with normal stem cells
check button Malignant transformation involving gene list.
Entrez IDSymbolReplicatesSpeciesOrganTissueAdj P-valueLog2FCMalignancy
8621CDK13CCI_1HumanCervixCC1.78e-028.73e-010.528
8621CDK13CCI_2HumanCervixCC9.89e-121.30e+000.5249
8621CDK13CCI_3HumanCervixCC9.73e-057.08e-010.516
8621CDK13sample3HumanCervixCC3.17e-062.67e-010.1387
8621CDK13T3HumanCervixCC1.27e-042.39e-010.1389
8621CDK13HTA11_3410_2000001011HumanColorectumAD8.77e-13-4.72e-010.0155
8621CDK13HTA11_347_2000001011HumanColorectumAD4.73e-094.95e-01-0.1954
8621CDK13HTA11_2992_2000001011HumanColorectumSER1.55e-02-4.86e-01-0.1706
8621CDK13HTA11_5216_2000001011HumanColorectumSER3.72e-03-5.75e-01-0.1462
8621CDK13HTA11_7696_3000711011HumanColorectumAD1.48e-03-2.78e-010.0674
8621CDK13HTA11_99999970781_79442HumanColorectumMSS8.35e-03-2.76e-010.294
8621CDK13HTA11_99999965062_69753HumanColorectumMSI-H5.07e-035.19e-010.3487
8621CDK13HTA11_99999974143_84620HumanColorectumMSS1.61e-11-4.52e-010.3005
8621CDK13A015-C-203HumanColorectumFAP9.02e-40-4.78e-01-0.1294
8621CDK13A015-C-204HumanColorectumFAP1.03e-07-4.07e-01-0.0228
8621CDK13A014-C-040HumanColorectumFAP2.08e-08-6.86e-01-0.1184
8621CDK13A002-C-201HumanColorectumFAP3.06e-18-4.38e-010.0324
8621CDK13A002-C-203HumanColorectumFAP1.03e-03-4.38e-040.2786
8621CDK13A001-C-119HumanColorectumFAP1.22e-09-4.29e-01-0.1557
8621CDK13A001-C-108HumanColorectumFAP1.33e-20-2.93e-01-0.0272
Page: 1 2 3 4 5 6 7 8 9 10 

check button Transcriptomic changes along malignancy continuum.
TissueExpression DynamicsAbbreviation
CervixThe image shows the transcriptomic changes along malignancy continuum.log2FC in expression of this searched gene in stem-like cells from each diseased tissue sample relative to stem-like cells in normal samples in each tissue plotted against the malignancy continuum. Samples are colored based on if they are from different disease stage.CC: Cervix cancer
HSIL_HPV: HPV-infected high-grade squamous intraepithelial lesions
N_HPV: HPV-infected normal cervix
Colorectum (GSE201348)The image shows the transcriptomic changes along malignancy continuum.log2FC in expression of this searched gene in stem-like cells from each diseased tissue sample relative to stem-like cells in normal samples in each tissue plotted against the malignancy continuum. Samples are colored based on if they are from different disease stage.FAP: Familial adenomatous polyposis
CRC: Colorectal cancer
Colorectum (HTA11)The image shows the transcriptomic changes along malignancy continuum.log2FC in expression of this searched gene in stem-like cells from each diseased tissue sample relative to stem-like cells in normal samples in each tissue plotted against the malignancy continuum. Samples are colored based on if they are from different disease stage.AD: Adenomas
SER: Sessile serrated lesions
MSI-H: Microsatellite-high colorectal cancer
MSS: Microsatellite stable colorectal cancer
EndometriumThe image shows the transcriptomic changes along malignancy continuum.log2FC in expression of this searched gene in stem-like cells from each diseased tissue sample relative to stem-like cells in normal samples in each tissue plotted against the malignancy continuum. Samples are colored based on if they are from different disease stage.
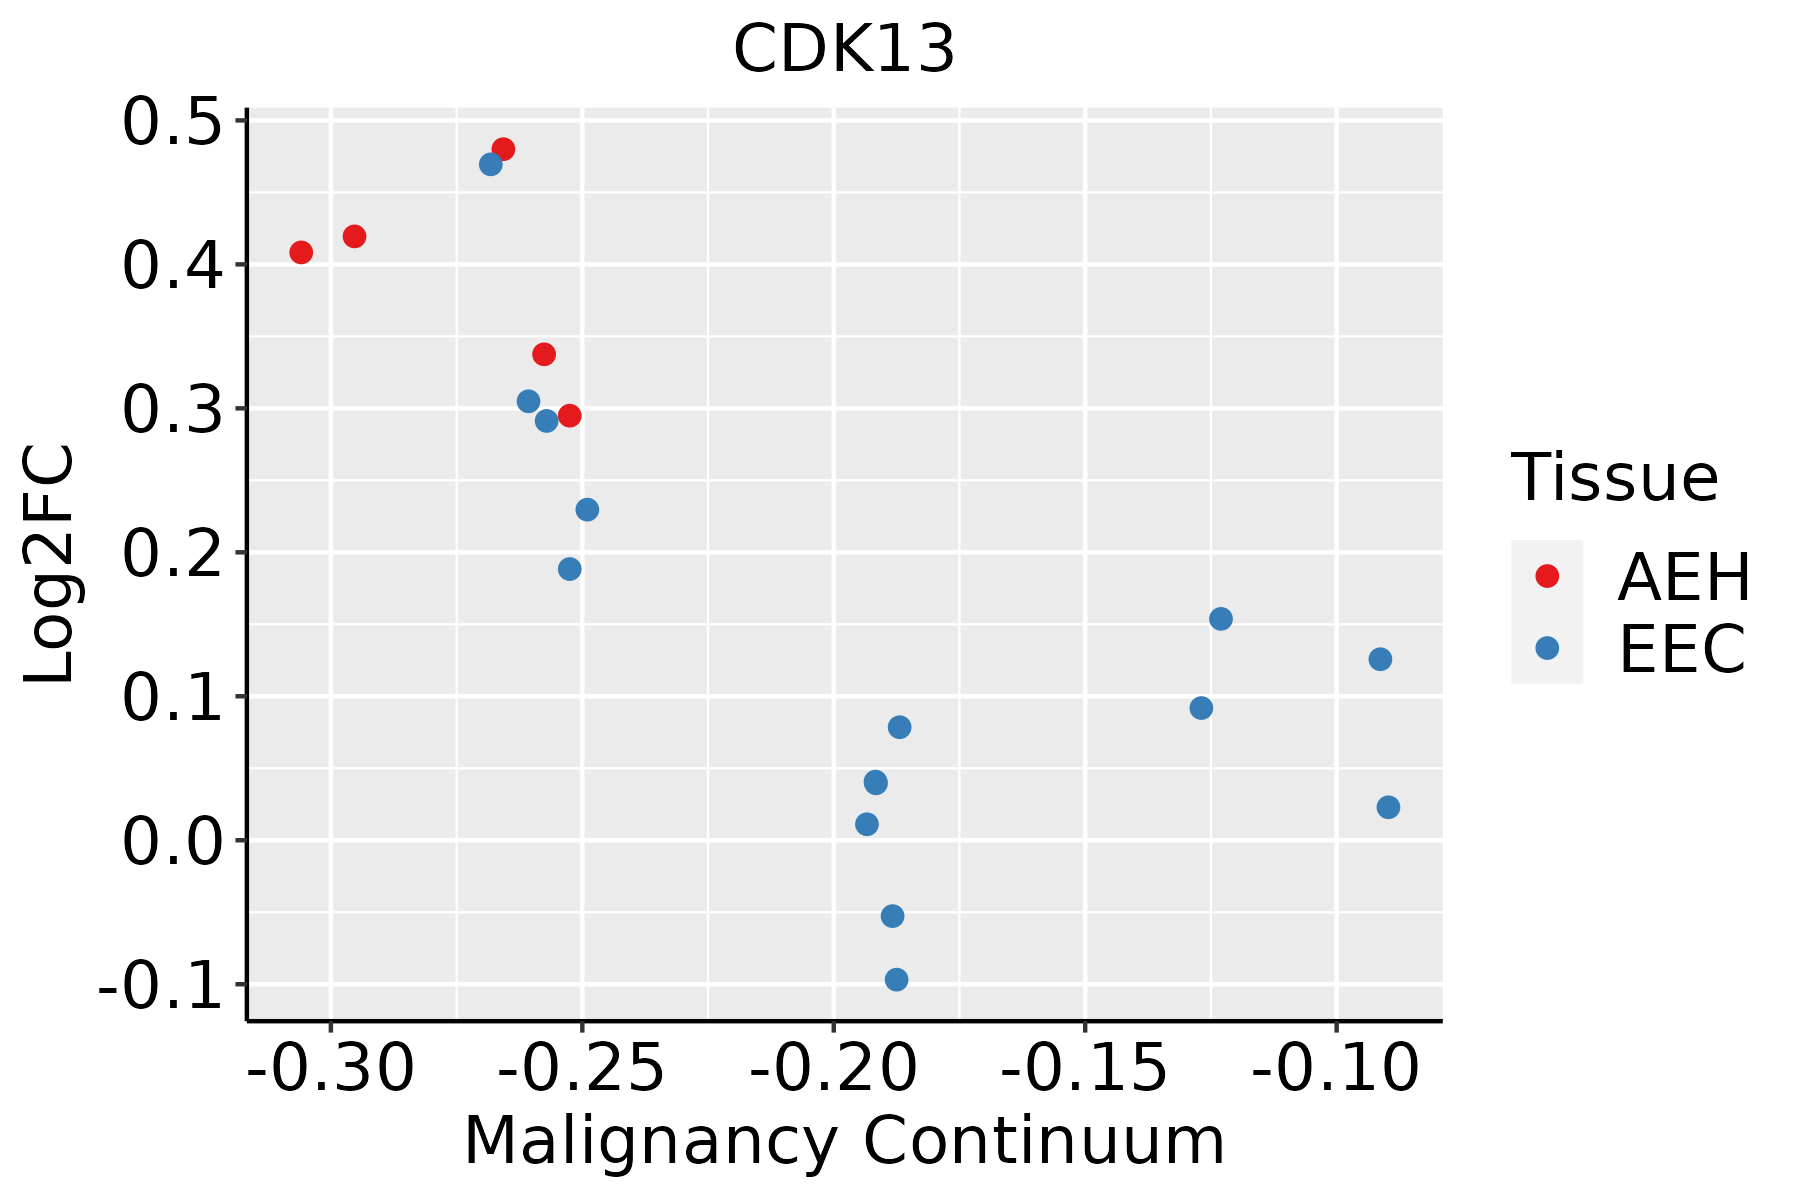
AEH: Atypical endometrial hyperplasia
EEC: Endometrioid Cancer
EsophagusThe image shows the transcriptomic changes along malignancy continuum.log2FC in expression of this searched gene in stem-like cells from each diseased tissue sample relative to stem-like cells in normal samples in each tissue plotted against the malignancy continuum. Samples are colored based on if they are from different disease stage.
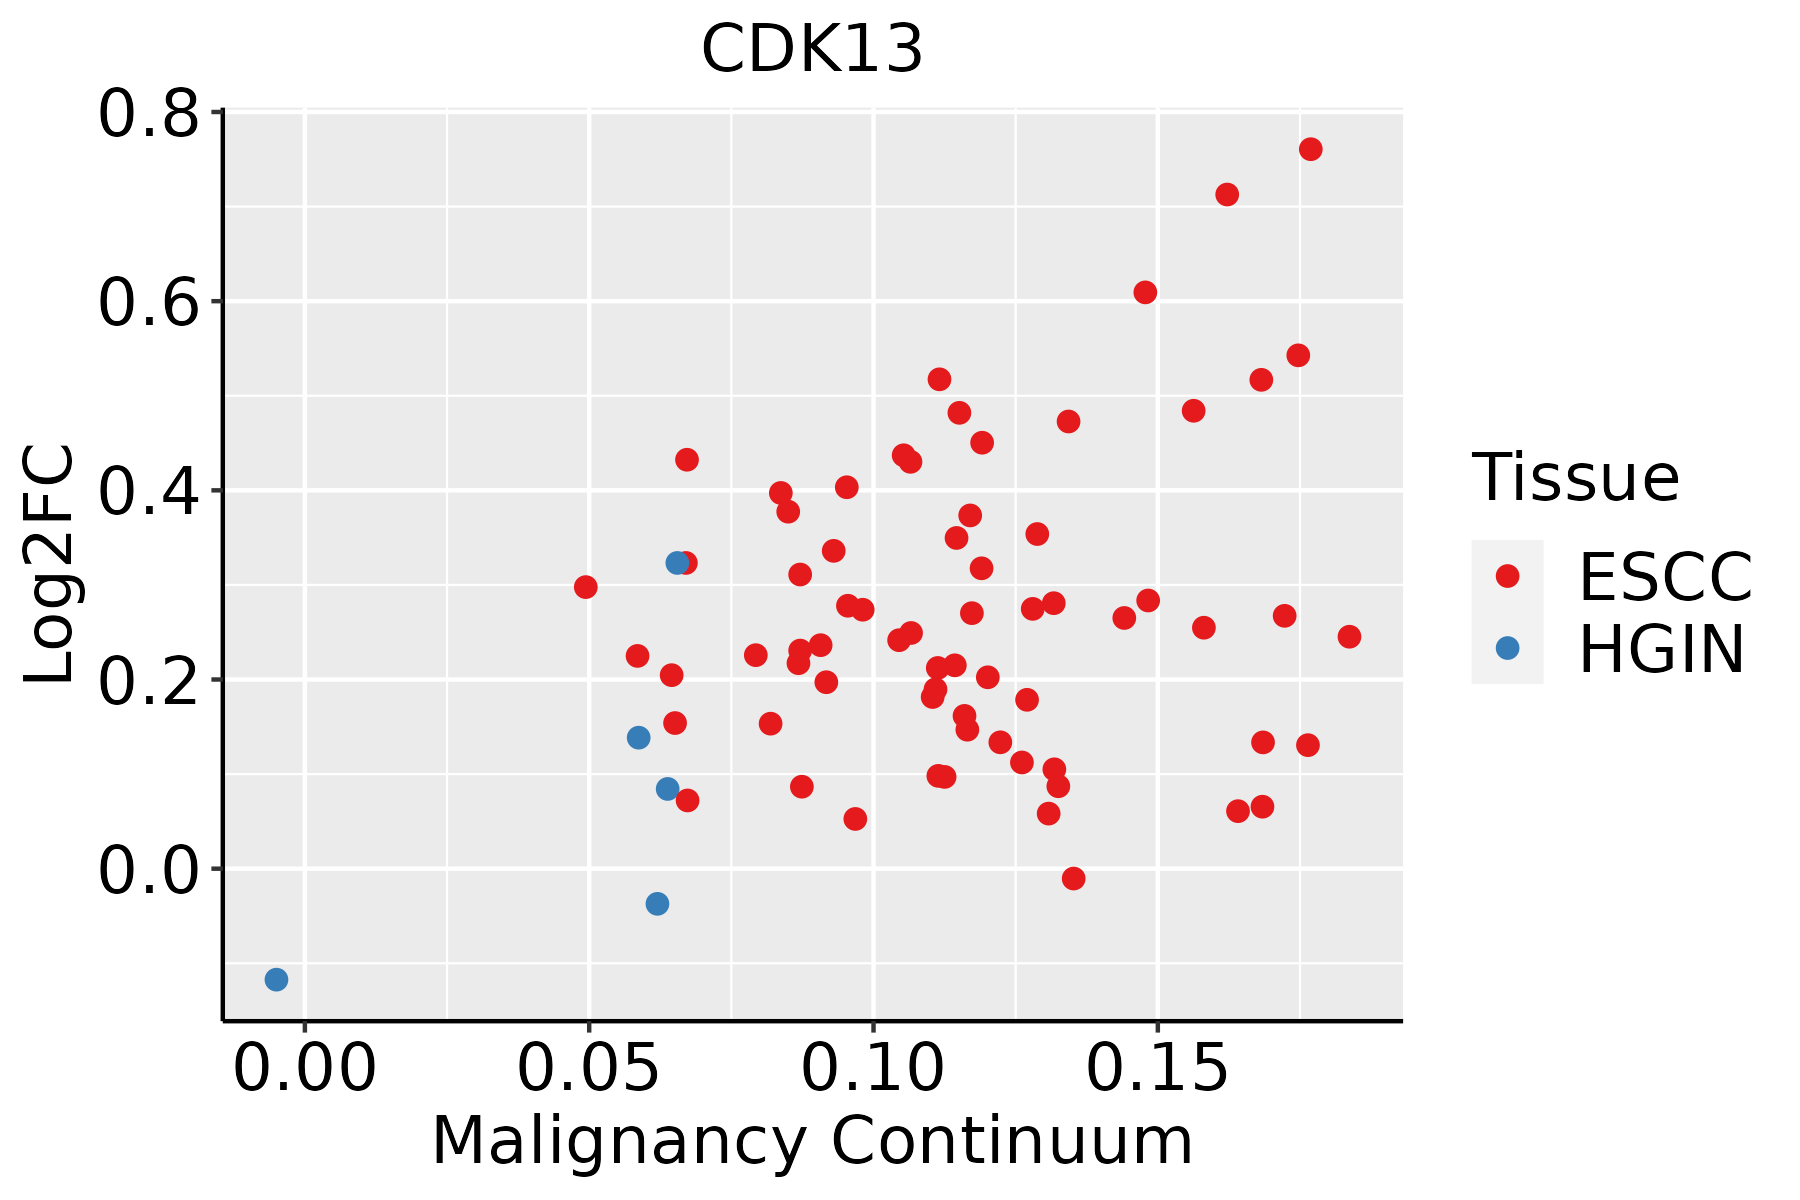
ESCC: Esophageal squamous cell carcinoma
HGIN: High-grade intraepithelial neoplasias
LGIN: Low-grade intraepithelial neoplasias
LiverThe image shows the transcriptomic changes along malignancy continuum.log2FC in expression of this searched gene in stem-like cells from each diseased tissue sample relative to stem-like cells in normal samples in each tissue plotted against the malignancy continuum. Samples are colored based on if they are from different disease stage.HCC: Hepatocellular carcinoma
NAFLD: Non-alcoholic fatty liver disease
LungThe image shows the transcriptomic changes along malignancy continuum.log2FC in expression of this searched gene in stem-like cells from each diseased tissue sample relative to stem-like cells in normal samples in each tissue plotted against the malignancy continuum. Samples are colored based on if they are from different disease stage.
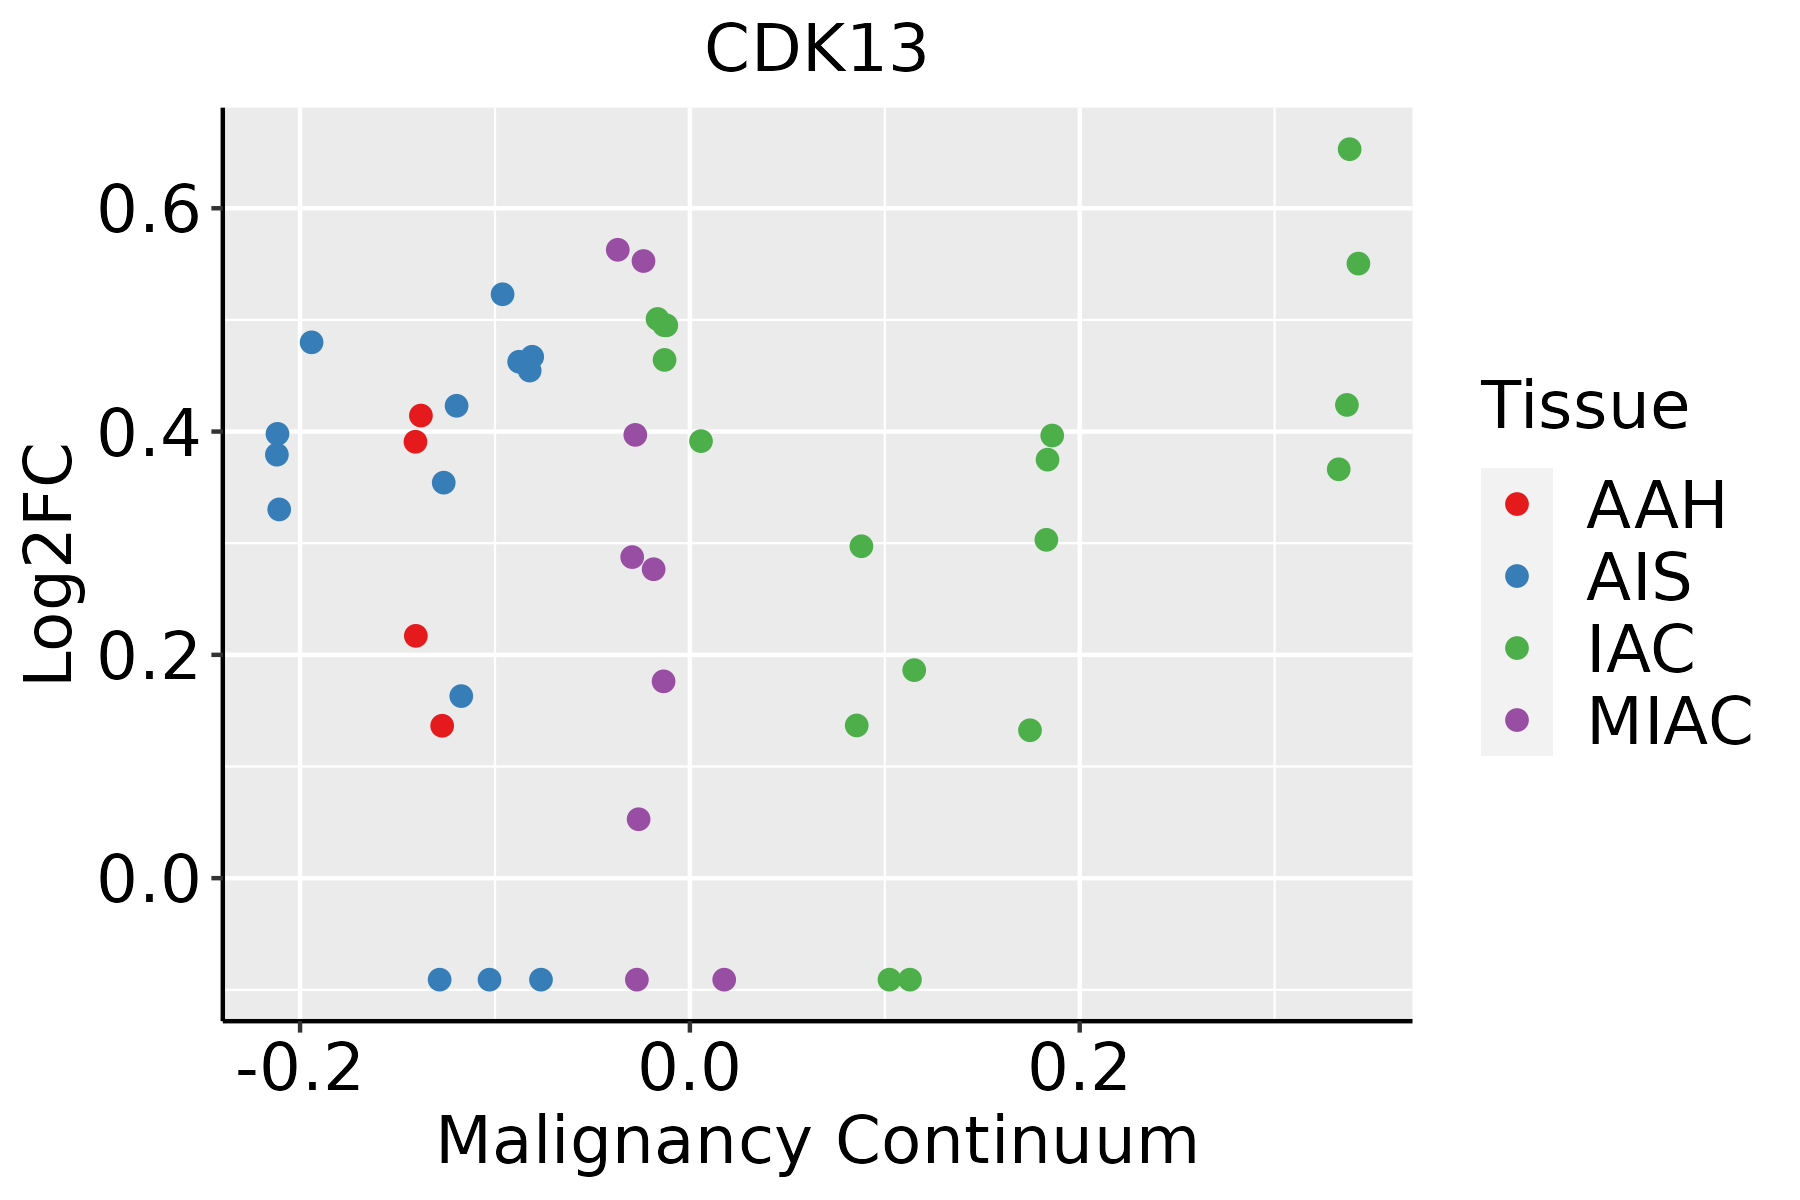
AAH: Atypical adenomatous hyperplasia
AIS: Adenocarcinoma in situ
IAC: Invasive lung adenocarcinoma
MIA: Minimally invasive adenocarcinoma
ProstateThe image shows the transcriptomic changes along malignancy continuum.log2FC in expression of this searched gene in stem-like cells from each diseased tissue sample relative to stem-like cells in normal samples in each tissue plotted against the malignancy continuum. Samples are colored based on if they are from different disease stage.
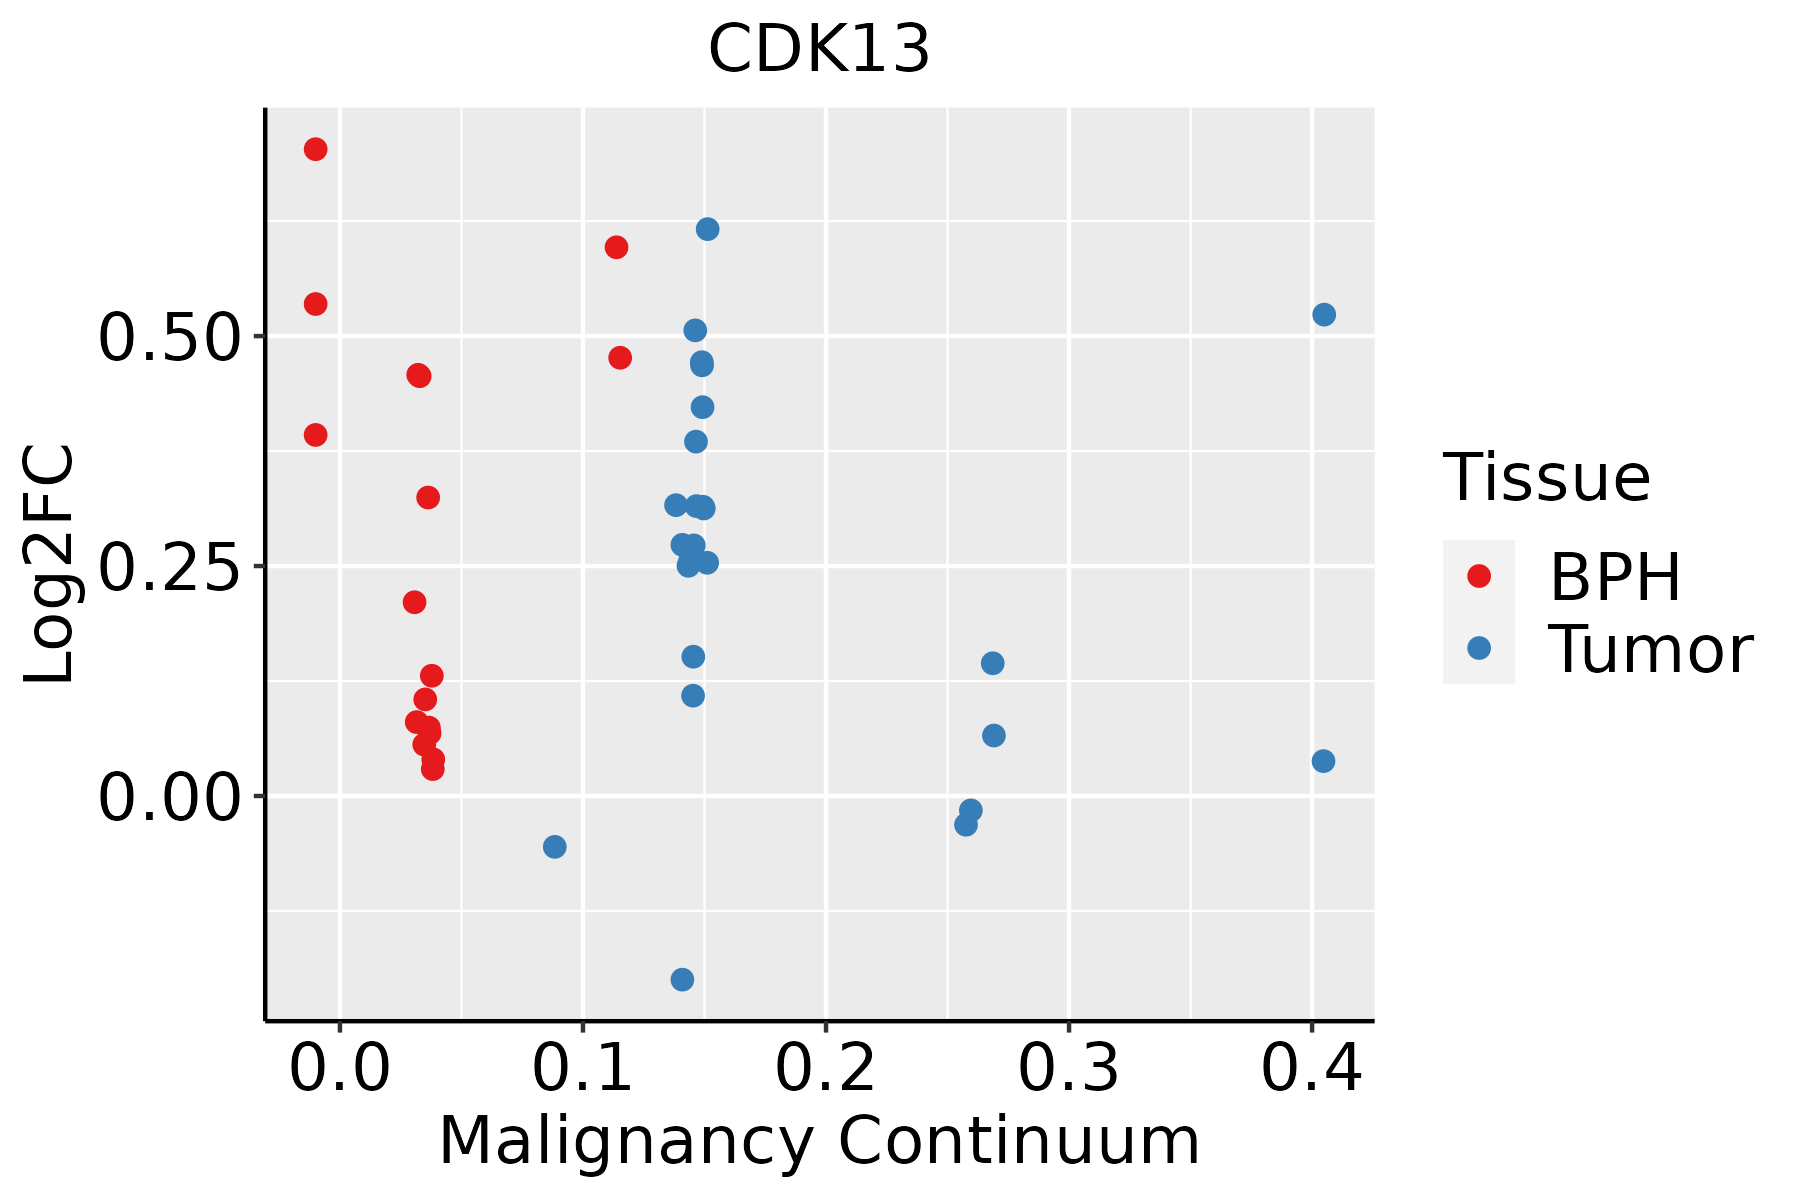
BPH: Benign Prostatic Hyperplasia
SkinThe image shows the transcriptomic changes along malignancy continuum.log2FC in expression of this searched gene in stem-like cells from each diseased tissue sample relative to stem-like cells in normal samples in each tissue plotted against the malignancy continuum. Samples are colored based on if they are from different disease stage.
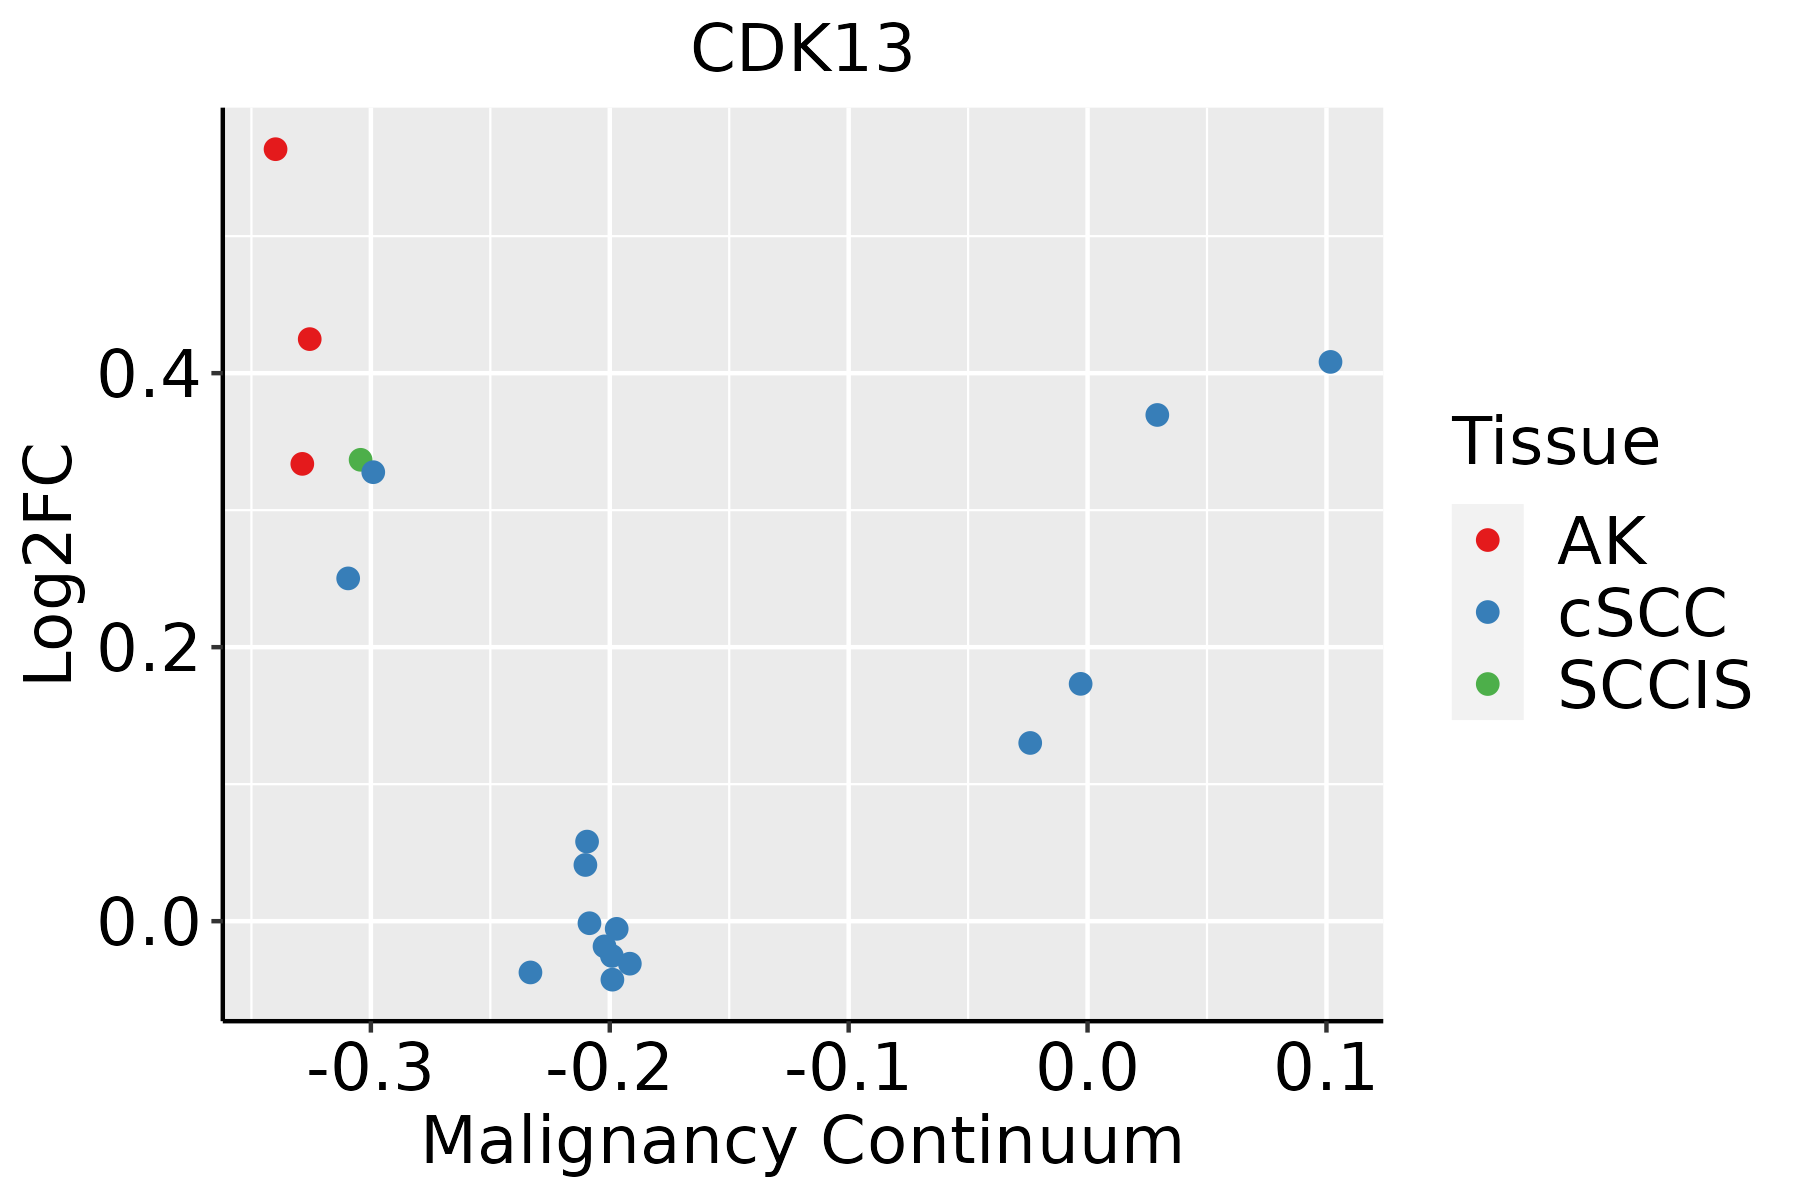
AK: Actinic keratosis
cSCC: Cutaneous squamous cell carcinoma
SCCIS:squamous cell carcinoma in situ
ThyroidThe image shows the transcriptomic changes along malignancy continuum.log2FC in expression of this searched gene in stem-like cells from each diseased tissue sample relative to stem-like cells in normal samples in each tissue plotted against the malignancy continuum. Samples are colored based on if they are from different disease stage.
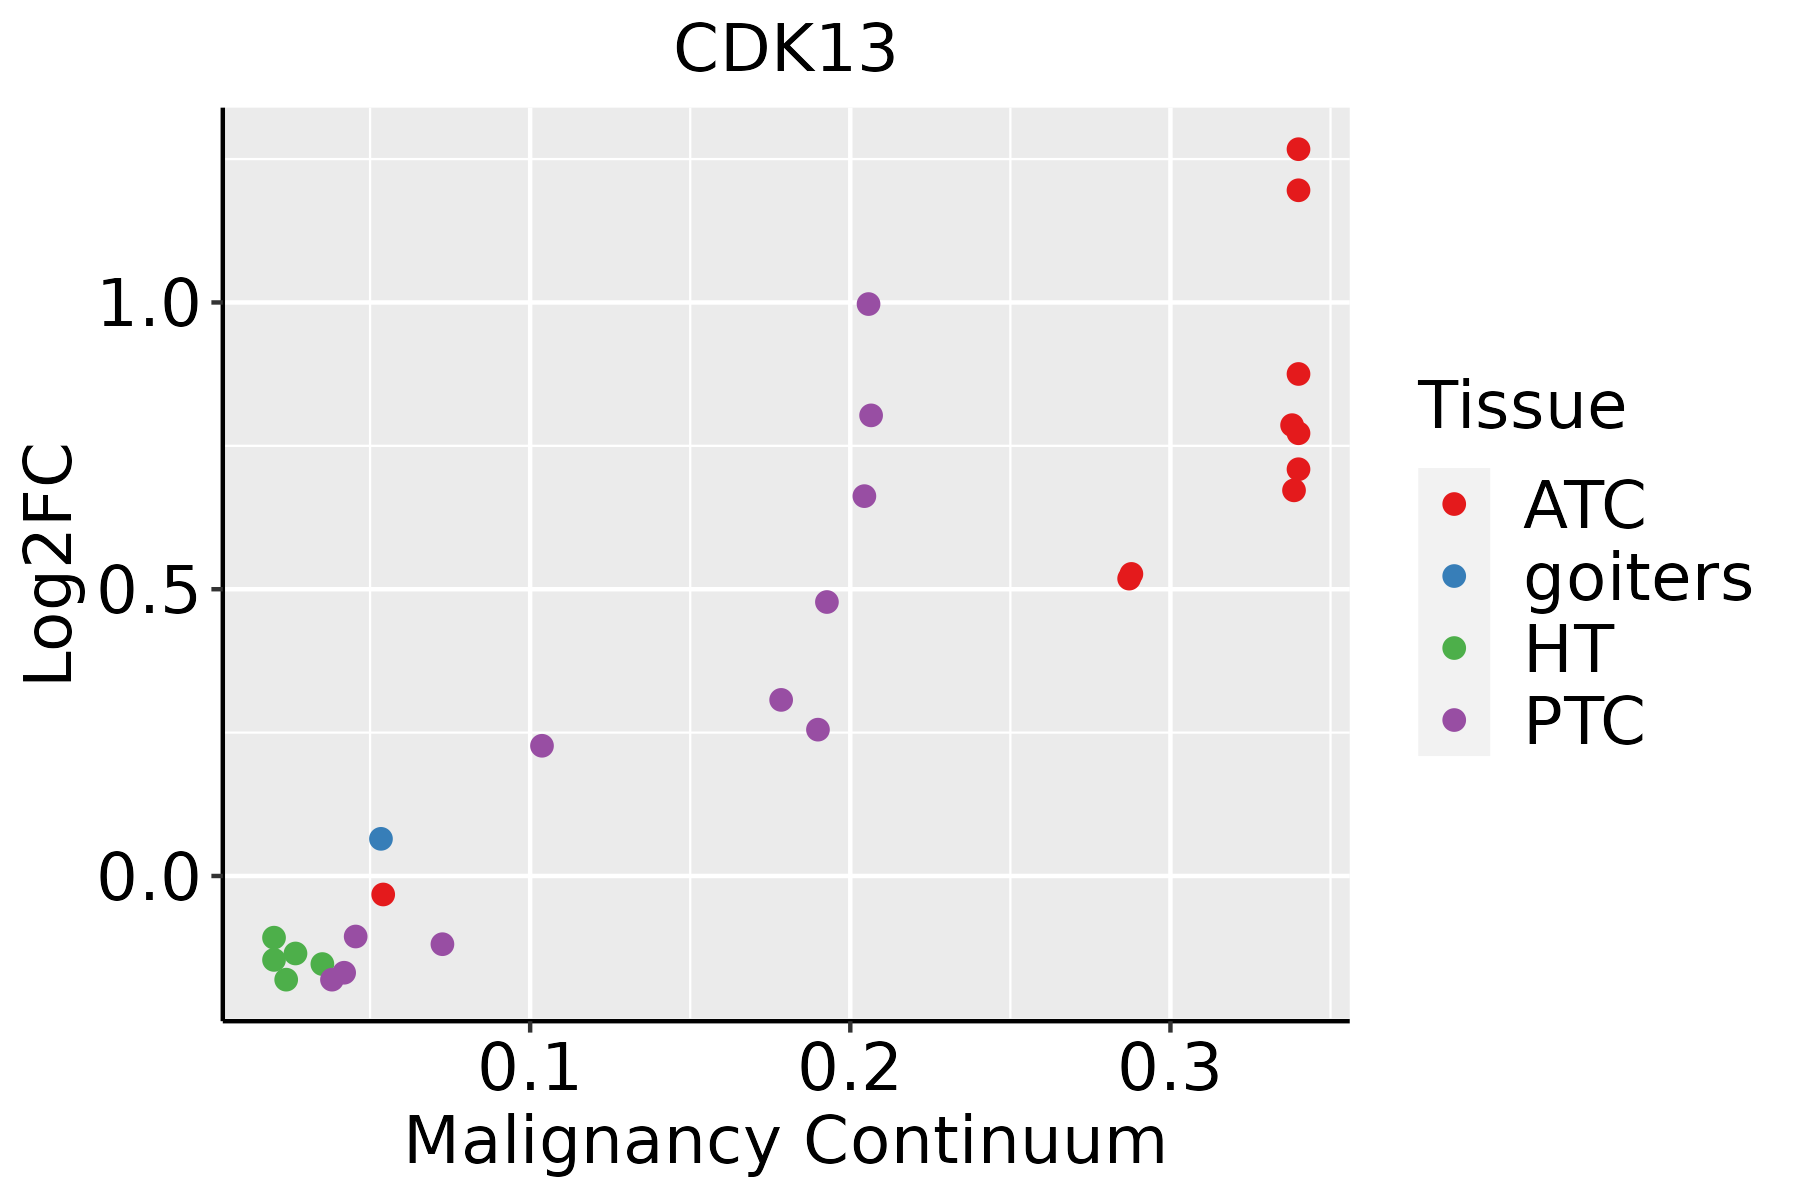
ATC: Anaplastic thyroid cancer
HT: Hashimoto's thyroiditis
PTC: Papillary thyroid cancer
∗log2FC in expression of this searched gene in stem-like cells from each diseased tissue sample relative to stem-like cells in normal samples in each tissue plotted against the malignancy continuum. Samples are colored based on if they are from different disease stage.

Top

Malignant transformation related pathway analysis

check buttonFind out the enriched GO biological processes and KEGG pathways involved in transition from healthy to precancer to cancer
check button Figure of enriched GO biological processes.
TissueDisease StageEnriched GO biological Processes
ColorectumADGO analysis - Figure of enriched GO biological processes: Top 15 enriched GO BP terms are showed in the bar plot of each disease state in each tissue. Each row represents a significant GO biological process which is colored according to the -log10(p.adjust).
ColorectumSERGO analysis - Figure of enriched GO biological processes: Top 15 enriched GO BP terms are showed in the bar plot of each disease state in each tissue. Each row represents a significant GO biological process which is colored according to the -log10(p.adjust).
ColorectumMSSGO analysis - Figure of enriched GO biological processes: Top 15 enriched GO BP terms are showed in the bar plot of each disease state in each tissue. Each row represents a significant GO biological process which is colored according to the -log10(p.adjust).
ColorectumMSI-HGO analysis - Figure of enriched GO biological processes: Top 15 enriched GO BP terms are showed in the bar plot of each disease state in each tissue. Each row represents a significant GO biological process which is colored according to the -log10(p.adjust).
ColorectumFAPGO analysis - Figure of enriched GO biological processes: Top 15 enriched GO BP terms are showed in the bar plot of each disease state in each tissue. Each row represents a significant GO biological process which is colored according to the -log10(p.adjust).
∗Top 15 enriched GO BP terms are showed in the bar plot of each disease state in each tissue. Each row represents a significant GO biological process which is colored according to the -log10(p.adjust).
Page: 1 2 3 4 5 6 7 8 9 

check button Enriched GO biological processes.
GO IDTissueDisease StageDescriptionGene RatioBg Ratiopvaluep.adjustCount
GO:00073466CervixCCregulation of mitotic cell cycle88/2311457/187231.26e-052.60e-0488
GO:20007362CervixCCregulation of stem cell differentiation19/231158/187234.01e-056.21e-0419
GO:00488634CervixCCstem cell differentiation46/2311206/187234.11e-056.36e-0446
GO:20007372CervixCCnegative regulation of stem cell differentiation10/231123/187232.00e-042.29e-0310
GO:000838010CervixCCRNA splicing76/2311434/187239.79e-048.19e-0376
GO:00063684CervixCCtranscription elongation from RNA polymerase II promoter17/231169/187233.65e-032.33e-0217
GO:000037710CervixCCRNA splicing, via transesterification reactions with bulged adenosine as nucleophile55/2311320/187236.71e-033.70e-0255
GO:000039810CervixCCmRNA splicing, via spliceosome55/2311320/187236.71e-033.70e-0255
GO:00063545CervixCCDNA-templated transcription, elongation20/231191/187236.88e-033.74e-0220
GO:01400143CervixCCmitotic nuclear division50/2311287/187237.27e-033.91e-0250
GO:000037510CervixCCRNA splicing, via transesterification reactions55/2311324/187238.61e-034.44e-0255
GO:00482851CervixCCorganelle fission78/2311488/187239.70e-034.79e-0278
GO:0008380ColorectumADRNA splicing169/3918434/187233.59e-182.04e-15169
GO:0000377ColorectumADRNA splicing, via transesterification reactions with bulged adenosine as nucleophile130/3918320/187235.88e-162.16e-13130
GO:0000398ColorectumADmRNA splicing, via spliceosome130/3918320/187235.88e-162.16e-13130
GO:0000375ColorectumADRNA splicing, via transesterification reactions131/3918324/187237.11e-162.22e-13131
GO:0000380ColorectumADalternative mRNA splicing, via spliceosome33/391877/187231.13e-052.55e-0433
GO:0032786ColorectumADpositive regulation of DNA-templated transcription, elongation13/391827/187231.47e-031.25e-0213
GO:0006354ColorectumADDNA-templated transcription, elongation31/391891/187232.46e-031.90e-0231
GO:0007346ColorectumADregulation of mitotic cell cycle119/3918457/187234.60e-033.14e-02119
Page: 1 2 3 4 5 6 7 8 9 10 11 12 13 14 

check button Enriched KEGG pathways.
Pathway IDTissueDisease StageDescriptionGene RatioBg Ratiopvaluep.adjustqvalueCount
Page: 1 

Top

Cell-cell communication analysis

check buttonIdentification of potential cell-cell interactions between two cell types and their ligand-receptor pairs for different disease states
LigandReceptorLRpairPathwayTissueDisease Stage
Page: 1 

Top

Single-cell gene regulatory network inference analysis

check buttonFind out the significant the regulons (TFs) and the target genes of each regulon across cell types for different disease states
TFCell TypeTissueDisease StageTarget GeneRSSRegulon Activity
∗The dot plots of a searched regulon are shown for all cell subpopulations in each disease state of each tissue based on the regulon specific score inferred using pySCENIC and by calculating the average expression.
Page: 1 

Top

Somatic mutation of malignant transformation related genes

check buttonAnnotation of somatic variants for genes involved in malignant transformation
Hugo SymbolVariant ClassVariant ClassificationdbSNP RSHGVScHGVSpHGVSp ShortSWISSPROTBIOTYPESIFTPolyPhenTumor Sample BarcodeTissueHistologySexAgeStageTherapy TypesDrugsOutcome
CDK13SNVMissense_Mutationc.1738N>Gp.Leu580Valp.L580VQ14004protein_codingtolerated(0.95)benign(0)TCGA-AC-A23H-01Breastbreast invasive carcinomaFemale>=65I/IIUnknownUnknownPD
CDK13SNVMissense_Mutationc.2522N>Tp.Ser841Phep.S841FQ14004protein_codingdeleterious(0)probably_damaging(0.999)TCGA-AC-A23H-01Breastbreast invasive carcinomaFemale>=65I/IIUnknownUnknownPD
CDK13SNVMissense_Mutationc.2045N>Ap.Ile682Lysp.I682KQ14004protein_codingdeleterious(0.01)probably_damaging(0.96)TCGA-AN-A0FW-01Breastbreast invasive carcinomaFemale>=65III/IVUnknownUnknownSD
CDK13SNVMissense_Mutationc.2866N>Cp.Tyr956Hisp.Y956HQ14004protein_codingtolerated(0.1)possibly_damaging(0.673)TCGA-BH-A18G-01Breastbreast invasive carcinomaFemale>=65I/IIUnknownUnknownSD
CDK13SNVMissense_Mutationc.1865N>Tp.Ala622Valp.A622VQ14004protein_codingtolerated(0.42)benign(0.025)TCGA-D8-A1XC-01Breastbreast invasive carcinomaFemale>=65III/IVUnknownUnknownPD
CDK13SNVMissense_Mutationnovelc.3716N>Gp.Asp1239Glyp.D1239GQ14004protein_codingdeleterious_low_confidence(0.02)benign(0.154)TCGA-GM-A3XL-01Breastbreast invasive carcinomaFemale<65I/IIChemotherapyfluorouracilCR
CDK13SNVMissense_Mutationnovelc.3806C>Tp.Pro1269Leup.P1269LQ14004protein_codingdeleterious_low_confidence(0.04)probably_damaging(0.923)TCGA-LD-A74U-01Breastbreast invasive carcinomaFemale>=65III/IVChemotherapytaxotereSD
CDK13SNVMissense_Mutationnovelc.2159N>Gp.Tyr720Cysp.Y720CQ14004protein_codingdeleterious(0)probably_damaging(0.999)TCGA-LL-A73Y-01Breastbreast invasive carcinomaFemale>=65I/IIChemotherapytaxotereSD
CDK13insertionIn_Frame_Insnovelc.1809_1810insGTCTGGAAAp.Val603_Thr604insValTrpLysp.V603_T604insVWKQ14004protein_codingTCGA-A7-A0CJ-01Breastbreast invasive carcinomaFemale<65I/IIChemotherapycytoxanSD
CDK13insertionFrame_Shift_Insnovelc.3817_3818insTAAATGTCTCCATp.Glu1273ValfsTer25p.E1273Vfs*25Q14004protein_codingTCGA-AO-A128-01Breastbreast invasive carcinomaFemale<65I/IIChemotherapydoxorubicinSD
Page: 1 2 3 4 5 6 7 8 9 10 11 12 13 14 

Top

Related drugs of malignant transformation related genes

check buttonIdentification of chemicals and drugs interact with genes involved in malignant transfromation
(DGIdb 4.0)
Entrez IDSymbolCategoryInteraction TypesDrug Claim NameDrug NamePMIDs
8621CDK13ENZYME, KINASE, DRUGGABLE GENOME, SERINE THREONINE KINASEinhibitor375973251
8621CDK13ENZYME, KINASE, DRUGGABLE GENOME, SERINE THREONINE KINASEinhibitorCHEMBL3544942RONICICLIB
8621CDK13ENZYME, KINASE, DRUGGABLE GENOME, SERINE THREONINE KINASEinhibitorCHEMBL488436AZD-5438
8621CDK13ENZYME, KINASE, DRUGGABLE GENOME, SERINE THREONINE KINASEinhibitorCHEMBL445813AT-7519
8621CDK13ENZYME, KINASE, DRUGGABLE GENOME, SERINE THREONINE KINASEinhibitorCHEMBL1230607PHA-793887
Page: 1