| Tissue | Expression Dynamics | Abbreviation |
| Breast |  | IDC: Invasive ductal carcinoma |
| DCIS: Ductal carcinoma in situ |
| Precancer(BRCA1-mut): Precancerous lesion from BRCA1 mutation carriers |
| Esophagus | 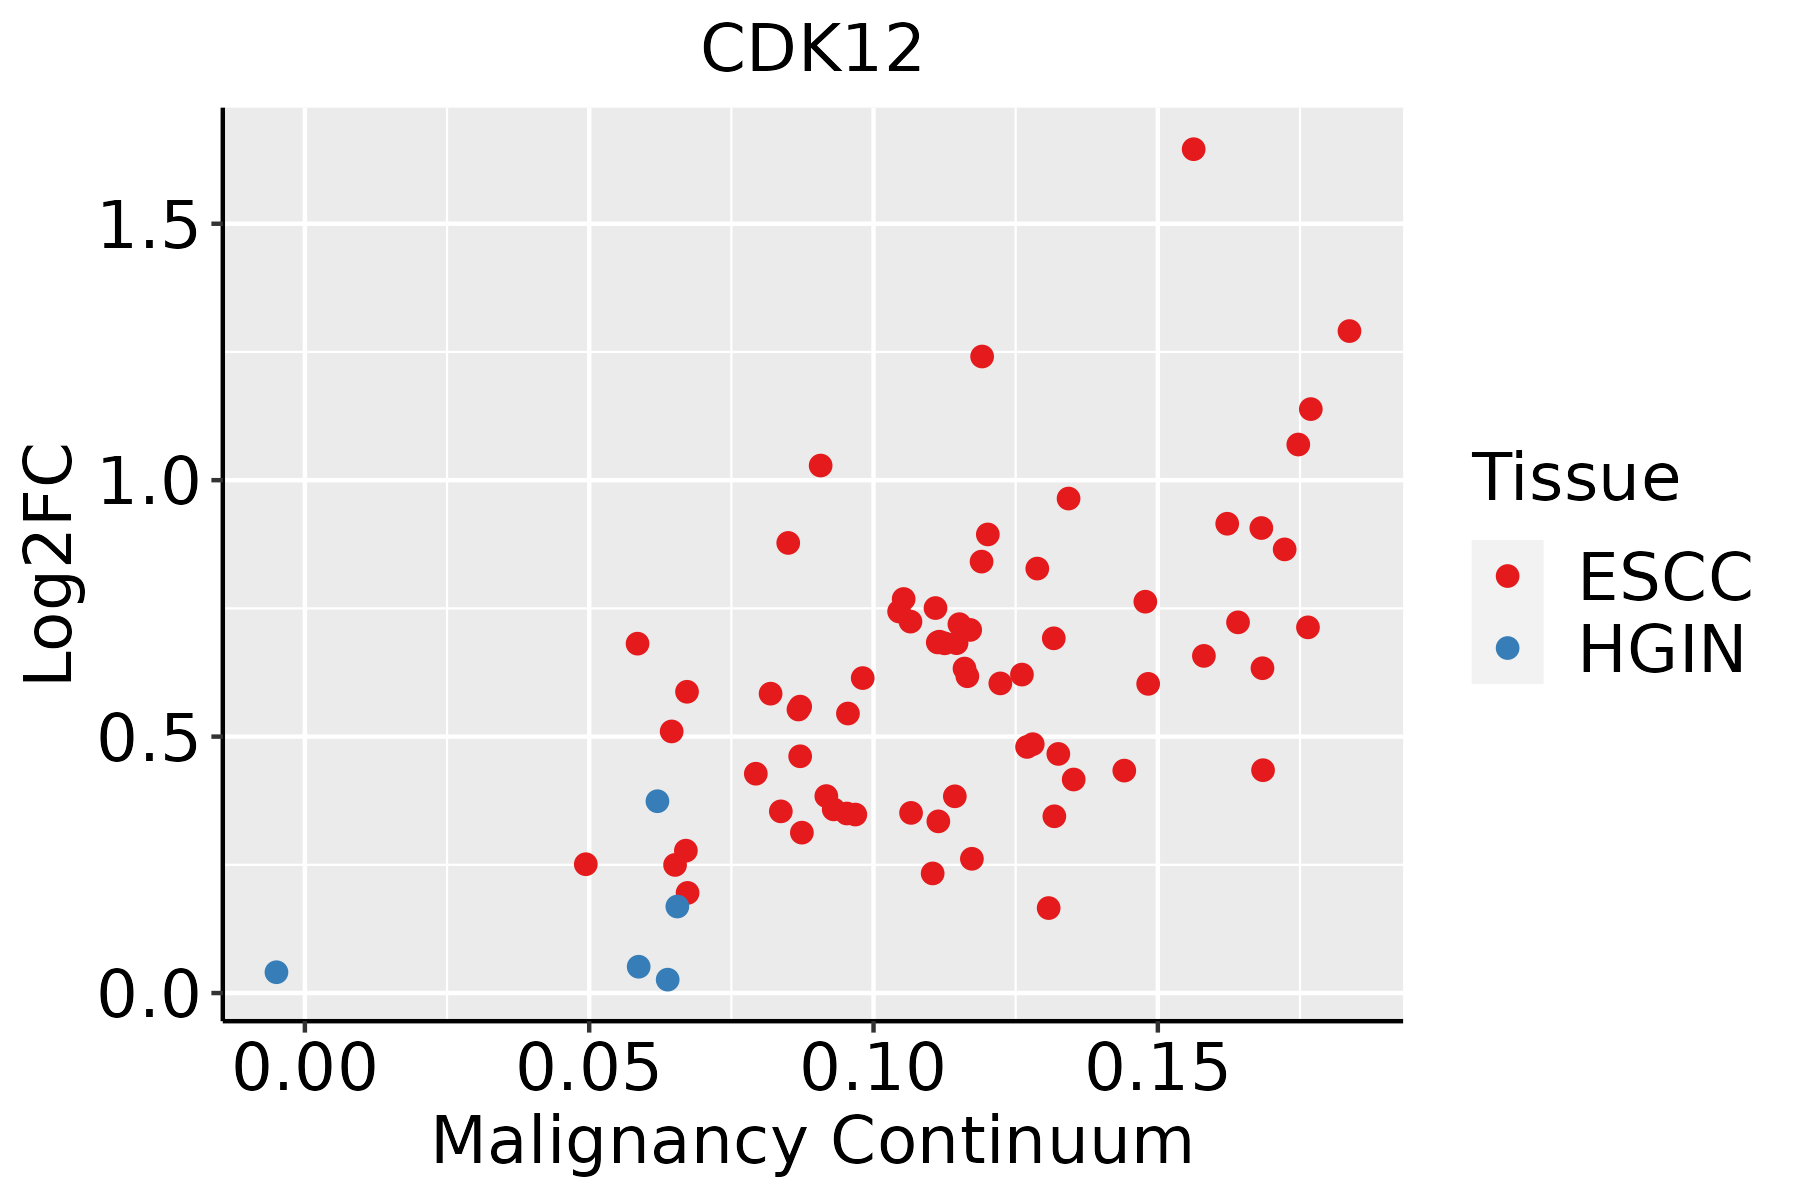 | ESCC: Esophageal squamous cell carcinoma |
| HGIN: High-grade intraepithelial neoplasias |
| LGIN: Low-grade intraepithelial neoplasias |
| Liver | 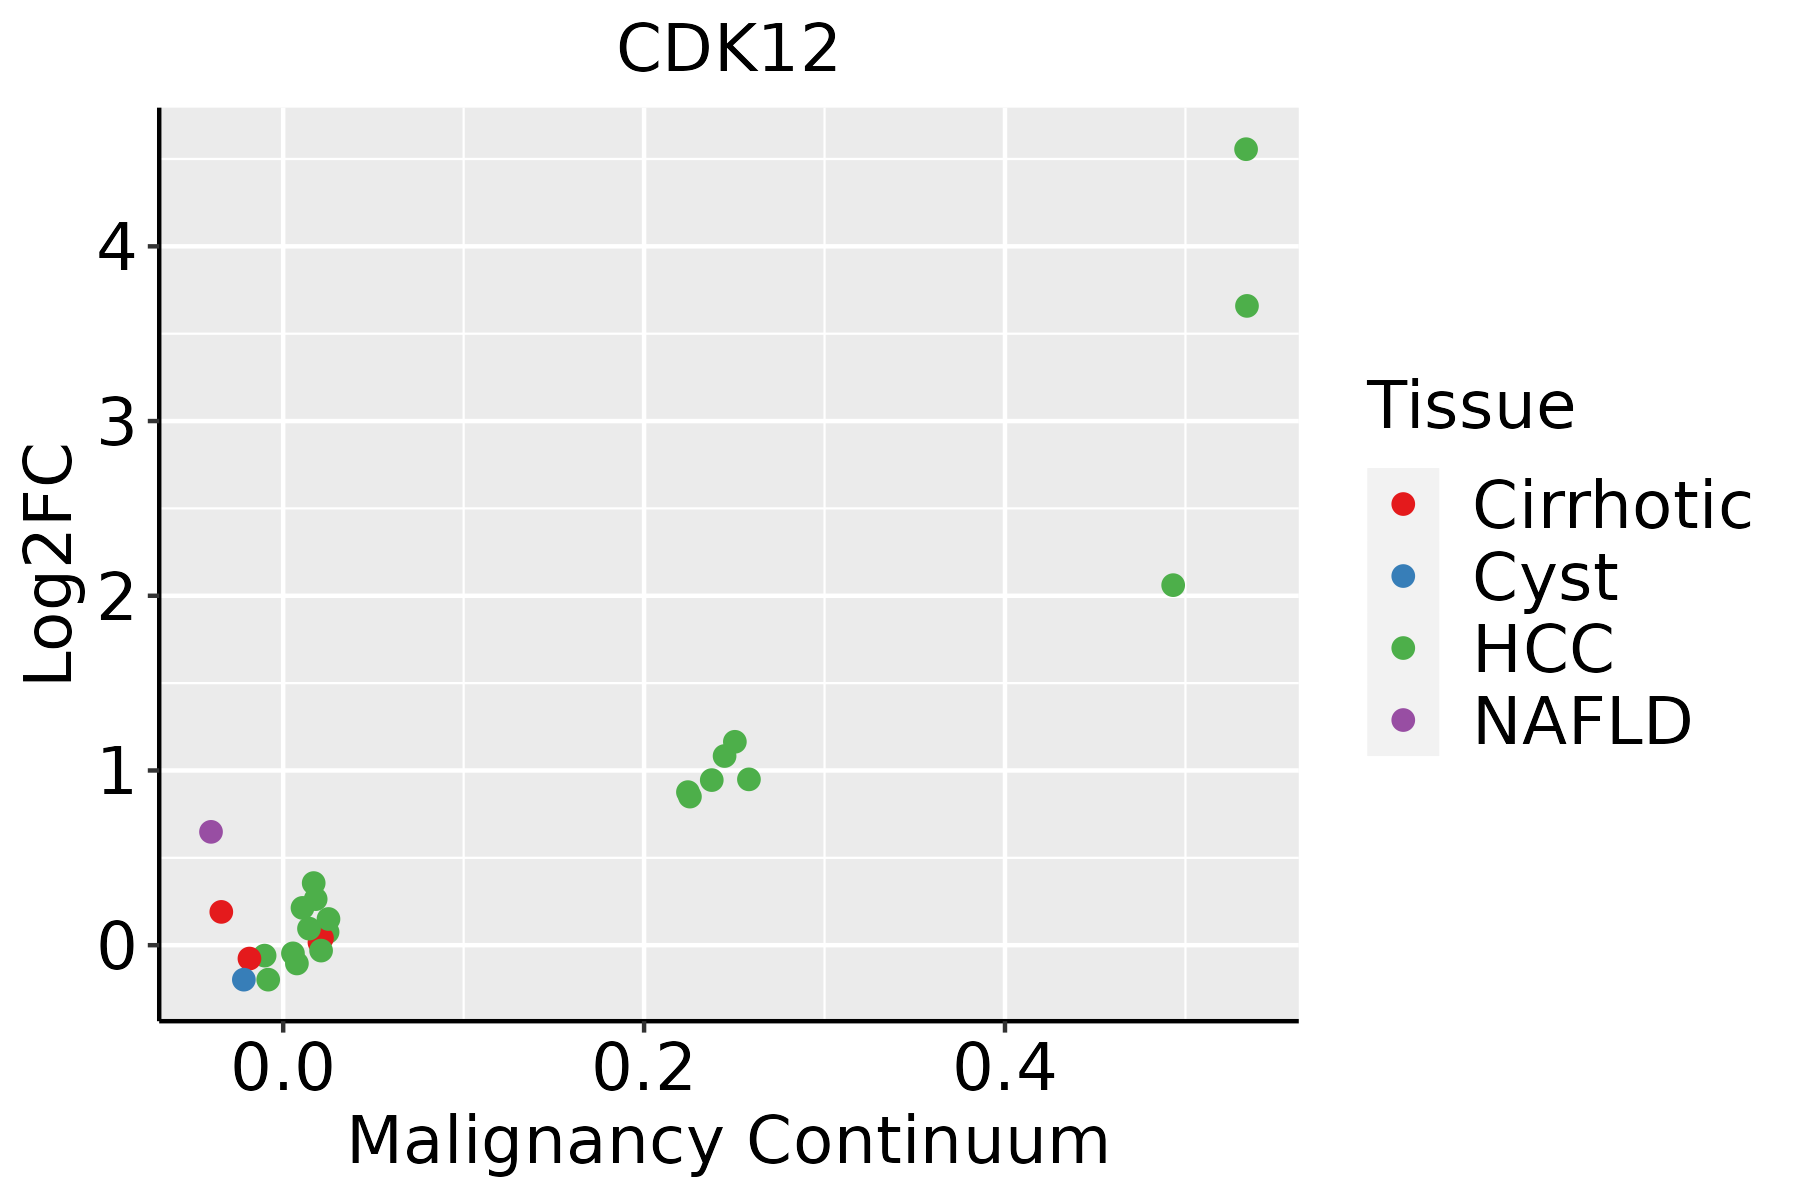 | HCC: Hepatocellular carcinoma |
| NAFLD: Non-alcoholic fatty liver disease |
| Lung | 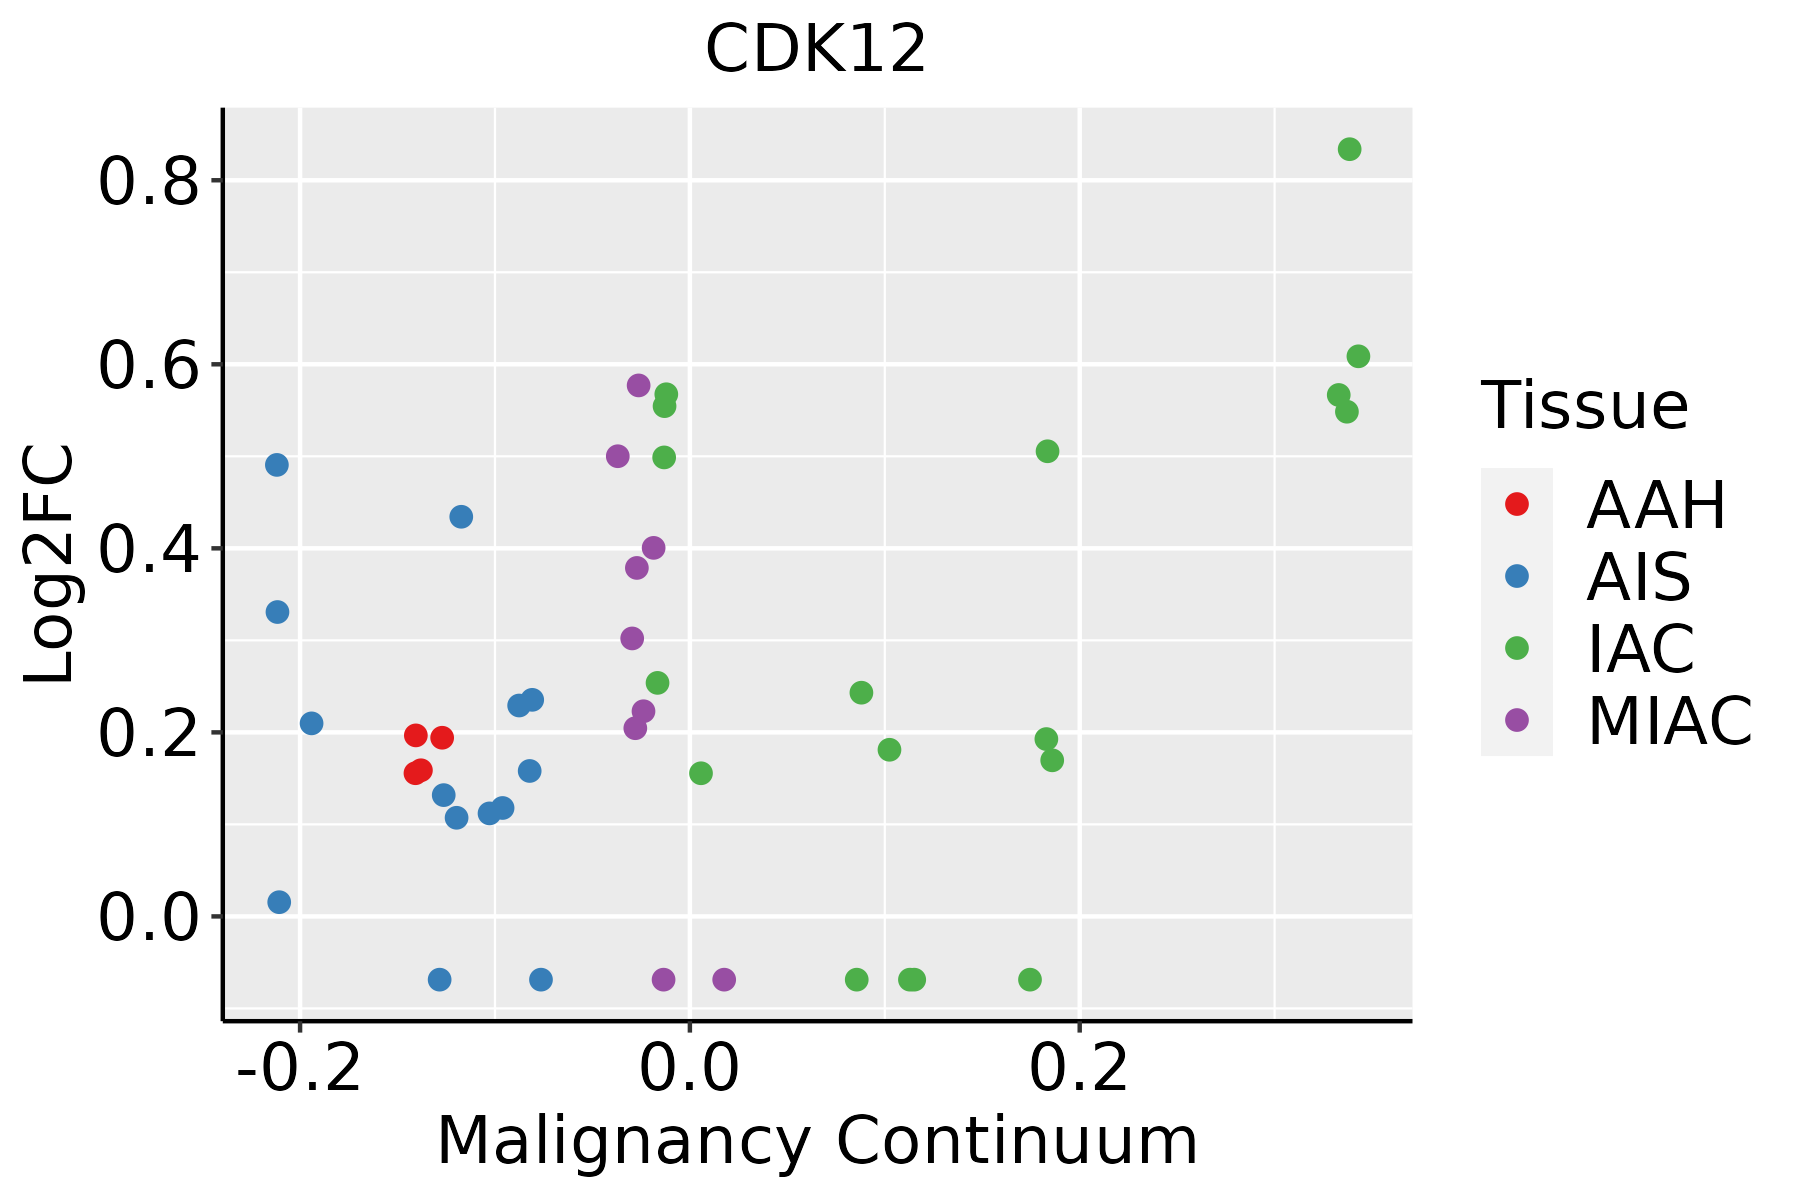 | AAH: Atypical adenomatous hyperplasia |
| AIS: Adenocarcinoma in situ |
| IAC: Invasive lung adenocarcinoma |
| MIA: Minimally invasive adenocarcinoma |
| Oral Cavity |  | EOLP: Erosive Oral lichen planus |
| LP: leukoplakia |
| NEOLP: Non-erosive oral lichen planus |
| OSCC: Oral squamous cell carcinoma |
| Skin | 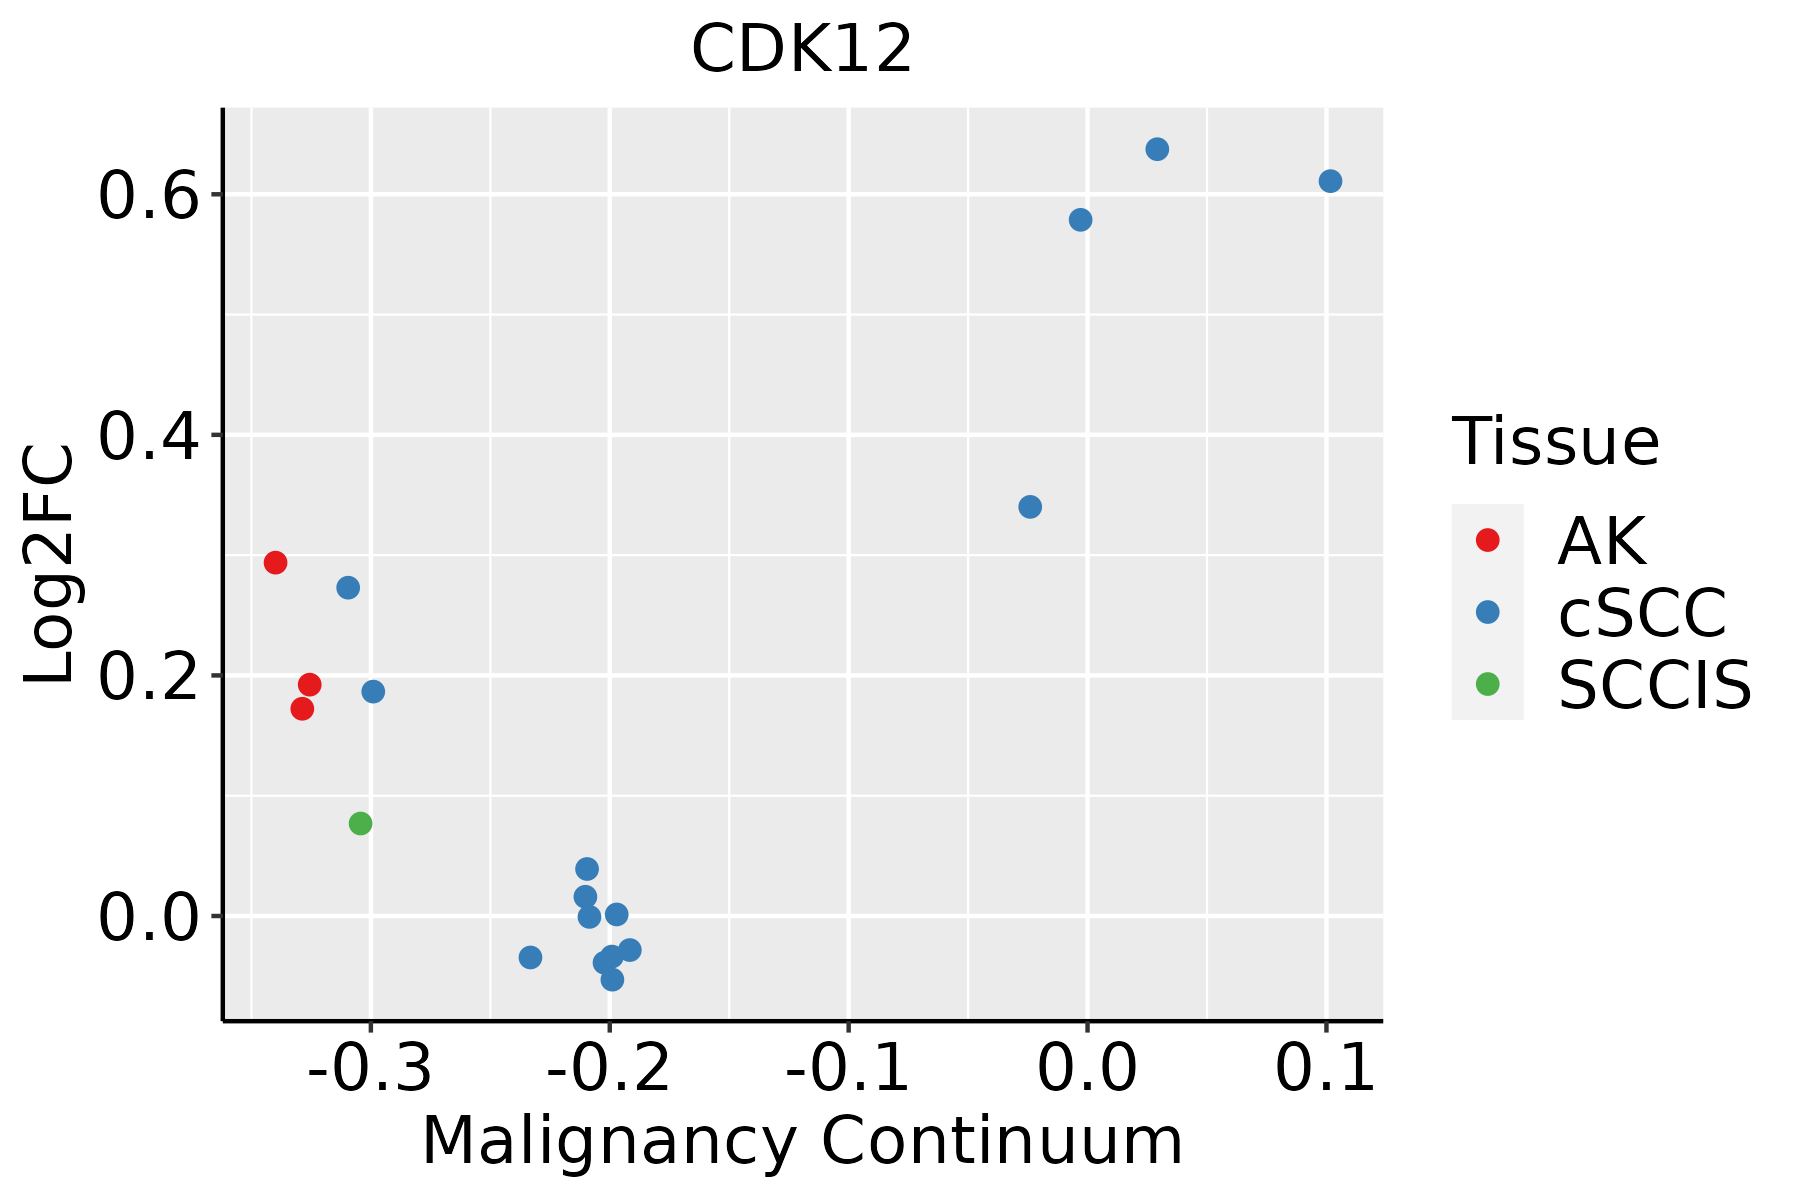 | AK: Actinic keratosis |
| cSCC: Cutaneous squamous cell carcinoma |
| SCCIS:squamous cell carcinoma in situ |
| Thyroid |  | ATC: Anaplastic thyroid cancer |
| HT: Hashimoto's thyroiditis |
| PTC: Papillary thyroid cancer |
| GO ID | Tissue | Disease Stage | Description | Gene Ratio | Bg Ratio | pvalue | p.adjust | Count |
| GO:000838014 | Breast | IDC | RNA splicing | 73/1434 | 434/18723 | 1.27e-10 | 1.57e-08 | 73 |
| GO:004348414 | Breast | IDC | regulation of RNA splicing | 36/1434 | 148/18723 | 3.32e-10 | 3.77e-08 | 36 |
| GO:000838024 | Breast | DCIS | RNA splicing | 73/1390 | 434/18723 | 3.05e-11 | 5.08e-09 | 73 |
| GO:004348424 | Breast | DCIS | regulation of RNA splicing | 36/1390 | 148/18723 | 1.40e-10 | 1.69e-08 | 36 |
| GO:000838026 | Esophagus | HGIN | RNA splicing | 160/2587 | 434/18723 | 3.74e-34 | 1.12e-30 | 160 |
| GO:004348427 | Esophagus | HGIN | regulation of RNA splicing | 59/2587 | 148/18723 | 3.61e-15 | 7.22e-13 | 59 |
| GO:00063687 | Esophagus | HGIN | transcription elongation from RNA polymerase II promoter | 24/2587 | 69/18723 | 8.93e-06 | 2.64e-04 | 24 |
| GO:20007375 | Esophagus | HGIN | negative regulation of stem cell differentiation | 12/2587 | 23/18723 | 1.45e-05 | 4.02e-04 | 12 |
| GO:20007365 | Esophagus | HGIN | regulation of stem cell differentiation | 20/2587 | 58/18723 | 5.65e-05 | 1.33e-03 | 20 |
| GO:00063548 | Esophagus | HGIN | DNA-templated transcription, elongation | 27/2587 | 91/18723 | 6.62e-05 | 1.52e-03 | 27 |
| GO:00342435 | Esophagus | HGIN | regulation of transcription elongation from RNA polymerase II promoter | 13/2587 | 32/18723 | 1.72e-04 | 3.32e-03 | 13 |
| GO:00327866 | Esophagus | HGIN | positive regulation of DNA-templated transcription, elongation | 11/2587 | 27/18723 | 5.28e-04 | 7.56e-03 | 11 |
| GO:00329685 | Esophagus | HGIN | positive regulation of transcription elongation from RNA polymerase II promoter | 7/2587 | 13/18723 | 7.61e-04 | 1.00e-02 | 7 |
| GO:00327844 | Esophagus | HGIN | regulation of DNA-templated transcription, elongation | 16/2587 | 53/18723 | 1.58e-03 | 1.79e-02 | 16 |
| GO:00708162 | Esophagus | HGIN | phosphorylation of RNA polymerase II C-terminal domain | 6/2587 | 12/18723 | 3.03e-03 | 2.88e-02 | 6 |
| GO:0008380111 | Esophagus | ESCC | RNA splicing | 336/8552 | 434/18723 | 1.74e-42 | 3.67e-39 | 336 |
| GO:0043484111 | Esophagus | ESCC | regulation of RNA splicing | 116/8552 | 148/18723 | 3.18e-16 | 2.38e-14 | 116 |
| GO:000635414 | Esophagus | ESCC | DNA-templated transcription, elongation | 76/8552 | 91/18723 | 8.35e-14 | 4.11e-12 | 76 |
| GO:007190016 | Esophagus | ESCC | regulation of protein serine/threonine kinase activity | 227/8552 | 359/18723 | 1.12e-11 | 4.10e-10 | 227 |
| GO:000636814 | Esophagus | ESCC | transcription elongation from RNA polymerase II promoter | 56/8552 | 69/18723 | 1.40e-09 | 3.30e-08 | 56 |
| Hugo Symbol | Variant Class | Variant Classification | dbSNP RS | HGVSc | HGVSp | HGVSp Short | SWISSPROT | BIOTYPE | SIFT | PolyPhen | Tumor Sample Barcode | Tissue | Histology | Sex | Age | Stage | Therapy Types | Drugs | Outcome |
| CDK12 | SNV | Missense_Mutation | | c.3280N>T | p.Val1094Leu | p.V1094L | Q9NYV4 | protein_coding | tolerated(0.3) | benign(0.01) | TCGA-A2-A0CW-01 | Breast | breast invasive carcinoma | Female | >=65 | I/II | Hormone Therapy | anastrozole | SD |
| CDK12 | SNV | Missense_Mutation | | c.530N>T | p.Ser177Phe | p.S177F | Q9NYV4 | protein_coding | deleterious_low_confidence(0) | probably_damaging(0.966) | TCGA-A8-A07R-01 | Breast | breast invasive carcinoma | Female | >=65 | III/IV | Ancillary | zoledronic | SD |
| CDK12 | SNV | Missense_Mutation | | c.3436N>C | p.Met1146Leu | p.M1146L | Q9NYV4 | protein_coding | deleterious(0.01) | benign(0) | TCGA-AC-A23H-01 | Breast | breast invasive carcinoma | Female | >=65 | I/II | Unknown | Unknown | PD |
| CDK12 | SNV | Missense_Mutation | rs778399102 | c.4136N>G | p.Ser1379Cys | p.S1379C | Q9NYV4 | protein_coding | deleterious_low_confidence(0) | probably_damaging(0.926) | TCGA-AC-A23H-01 | Breast | breast invasive carcinoma | Female | >=65 | I/II | Unknown | Unknown | PD |
| CDK12 | SNV | Missense_Mutation | novel | c.2776N>A | p.Leu926Ile | p.L926I | Q9NYV4 | protein_coding | deleterious(0.01) | probably_damaging(0.998) | TCGA-AN-A046-01 | Breast | breast invasive carcinoma | Female | >=65 | I/II | Unknown | Unknown | SD |
| CDK12 | SNV | Missense_Mutation | | c.122N>C | p.Lys41Thr | p.K41T | Q9NYV4 | protein_coding | deleterious_low_confidence(0.02) | probably_damaging(0.968) | TCGA-AN-A0AK-01 | Breast | breast invasive carcinoma | Female | >=65 | I/II | Unknown | Unknown | SD |
| CDK12 | SNV | Missense_Mutation | | c.256N>A | p.Asp86Asn | p.D86N | Q9NYV4 | protein_coding | deleterious_low_confidence(0.02) | probably_damaging(0.98) | TCGA-BH-A1FJ-01 | Breast | breast invasive carcinoma | Female | >=65 | III/IV | Unknown | Unknown | SD |
| CDK12 | SNV | Missense_Mutation | | c.3430N>T | p.Pro1144Ser | p.P1144S | Q9NYV4 | protein_coding | tolerated(0.1) | possibly_damaging(0.877) | TCGA-C8-A12W-01 | Breast | breast invasive carcinoma | Female | <65 | III/IV | Unknown | Unknown | SD |
| CDK12 | SNV | Missense_Mutation | | c.2705N>C | p.Arg902Pro | p.R902P | Q9NYV4 | protein_coding | deleterious(0) | probably_damaging(0.999) | TCGA-E2-A1LG-01 | Breast | breast invasive carcinoma | Female | <65 | I/II | Chemotherapy | doxorubicin | SD |
| CDK12 | SNV | Missense_Mutation | rs773007495 | c.2816A>G | p.Asn939Ser | p.N939S | Q9NYV4 | protein_coding | deleterious(0.03) | benign(0.185) | TCGA-E9-A1NH-01 | Breast | breast invasive carcinoma | Female | >=65 | I/II | Hormone Therapy | tamoxiphen | SD |
| Entrez ID | Symbol | Category | Interaction Types | Drug Claim Name | Drug Name | PMIDs |
| 51755 | CDK12 | KINASE, CLINICALLY ACTIONABLE, DRUGGABLE GENOME, ENZYME, TUMOR SUPPRESSOR, SERINE THREONINE KINASE | inhibitor | 375973251 | | |
| 51755 | CDK12 | KINASE, CLINICALLY ACTIONABLE, DRUGGABLE GENOME, ENZYME, TUMOR SUPPRESSOR, SERINE THREONINE KINASE | | Cemiplimab | CEMIPLIMAB | |
| 51755 | CDK12 | KINASE, CLINICALLY ACTIONABLE, DRUGGABLE GENOME, ENZYME, TUMOR SUPPRESSOR, SERINE THREONINE KINASE | inhibitor | CHEMBL445813 | AT-7519 | |
| 51755 | CDK12 | KINASE, CLINICALLY ACTIONABLE, DRUGGABLE GENOME, ENZYME, TUMOR SUPPRESSOR, SERINE THREONINE KINASE | | Nivolumab | NIVOLUMAB | |
| 51755 | CDK12 | KINASE, CLINICALLY ACTIONABLE, DRUGGABLE GENOME, ENZYME, TUMOR SUPPRESSOR, SERINE THREONINE KINASE | | OLAPARIB | OLAPARIB | 24240700 |
| 51755 | CDK12 | KINASE, CLINICALLY ACTIONABLE, DRUGGABLE GENOME, ENZYME, TUMOR SUPPRESSOR, SERINE THREONINE KINASE | | Pembrolizumab | PEMBROLIZUMAB | |
| 51755 | CDK12 | KINASE, CLINICALLY ACTIONABLE, DRUGGABLE GENOME, ENZYME, TUMOR SUPPRESSOR, SERINE THREONINE KINASE | inhibitor | CHEMBL3544942 | RONICICLIB | |
| 51755 | CDK12 | KINASE, CLINICALLY ACTIONABLE, DRUGGABLE GENOME, ENZYME, TUMOR SUPPRESSOR, SERINE THREONINE KINASE | inhibitor | CHEMBL488436 | AZD-5438 | |
| 51755 | CDK12 | KINASE, CLINICALLY ACTIONABLE, DRUGGABLE GENOME, ENZYME, TUMOR SUPPRESSOR, SERINE THREONINE KINASE | inhibitor | CHEMBL1230607 | PHA-793887 | |


