
|
|||||
|
 | |
| |
| |
| |
| |
| |
|
Gene: CDK11A |
Gene summary for CDK11A |
| Gene information | Species | Human | Gene symbol | CDK11A | Gene ID | 728642 |
| Gene name | cyclin dependent kinase 11A | |
| Gene Alias | CDC2L2 | |
| Cytomap | 1p36.33 | |
| Gene Type | protein-coding | GO ID | GO:0000278 | UniProtAcc | Q9UQ88 |
Top |
Malignant transformation analysis |
| Identification of the aberrant gene expression in precancerous and cancerous lesions by comparing the gene expression of stem-like cells in diseased tissues with normal stem cells |
| Entrez ID | Symbol | Replicates | Species | Organ | Tissue | Adj P-value | Log2FC | Malignancy |
| 728642 | CDK11A | HTA11_3410_2000001011 | Human | Colorectum | AD | 6.84e-07 | -2.36e-01 | 0.0155 |
| 728642 | CDK11A | HTA11_2487_2000001011 | Human | Colorectum | SER | 4.39e-03 | -2.36e-01 | -0.1808 |
| 728642 | CDK11A | HTA11_78_2000001011 | Human | Colorectum | AD | 4.57e-04 | -2.36e-01 | -0.1088 |
| 728642 | CDK11A | HTA11_347_2000001011 | Human | Colorectum | AD | 1.40e-07 | -2.36e-01 | -0.1954 |
| 728642 | CDK11A | HTA11_696_2000001011 | Human | Colorectum | AD | 2.35e-08 | -2.32e-01 | -0.1464 |
| 728642 | CDK11A | HTA11_866_2000001011 | Human | Colorectum | AD | 9.93e-07 | -2.27e-01 | -0.1001 |
| 728642 | CDK11A | HTA11_1391_2000001011 | Human | Colorectum | AD | 4.02e-05 | -2.36e-01 | -0.059 |
| 728642 | CDK11A | HTA11_866_3004761011 | Human | Colorectum | AD | 8.49e-06 | -2.36e-01 | 0.096 |
| 728642 | CDK11A | HTA11_10711_2000001011 | Human | Colorectum | AD | 1.06e-02 | -2.36e-01 | 0.0338 |
| 728642 | CDK11A | HTA11_7696_3000711011 | Human | Colorectum | AD | 9.94e-07 | -2.32e-01 | 0.0674 |
| 728642 | CDK11A | HTA11_99999970781_79442 | Human | Colorectum | MSS | 8.94e-11 | -2.36e-01 | 0.294 |
| 728642 | CDK11A | HTA11_99999971662_82457 | Human | Colorectum | MSS | 1.04e-07 | -2.33e-01 | 0.3859 |
| 728642 | CDK11A | HTA11_99999974143_84620 | Human | Colorectum | MSS | 2.03e-09 | -2.36e-01 | 0.3005 |
| 728642 | CDK11A | A001-C-119 | Human | Colorectum | FAP | 2.43e-04 | 5.55e-01 | -0.1557 |
| 728642 | CDK11A | A002-C-205 | Human | Colorectum | FAP | 9.63e-06 | 3.91e-01 | -0.1236 |
| 728642 | CDK11A | A001-C-104 | Human | Colorectum | FAP | 4.92e-04 | 4.50e-01 | 0.0184 |
| 728642 | CDK11A | A015-C-104 | Human | Colorectum | FAP | 1.44e-02 | 8.22e-02 | -0.1899 |
| 728642 | CDK11A | A002-C-016 | Human | Colorectum | FAP | 3.29e-04 | 3.06e-01 | 0.0521 |
| 728642 | CDK11A | A002-C-116 | Human | Colorectum | FAP | 9.84e-03 | -1.07e-01 | -0.0452 |
| 728642 | CDK11A | A014-C-008 | Human | Colorectum | FAP | 4.90e-07 | 5.60e-01 | -0.191 |
| Page: 1 2 3 4 5 6 |
| Tissue | Expression Dynamics | Abbreviation |
| Colorectum (GSE201348) |  | FAP: Familial adenomatous polyposis |
| CRC: Colorectal cancer | ||
| Colorectum (HTA11) |  | AD: Adenomas |
| SER: Sessile serrated lesions | ||
| MSI-H: Microsatellite-high colorectal cancer | ||
| MSS: Microsatellite stable colorectal cancer | ||
| Esophagus |  | ESCC: Esophageal squamous cell carcinoma |
| HGIN: High-grade intraepithelial neoplasias | ||
| LGIN: Low-grade intraepithelial neoplasias | ||
| Liver | 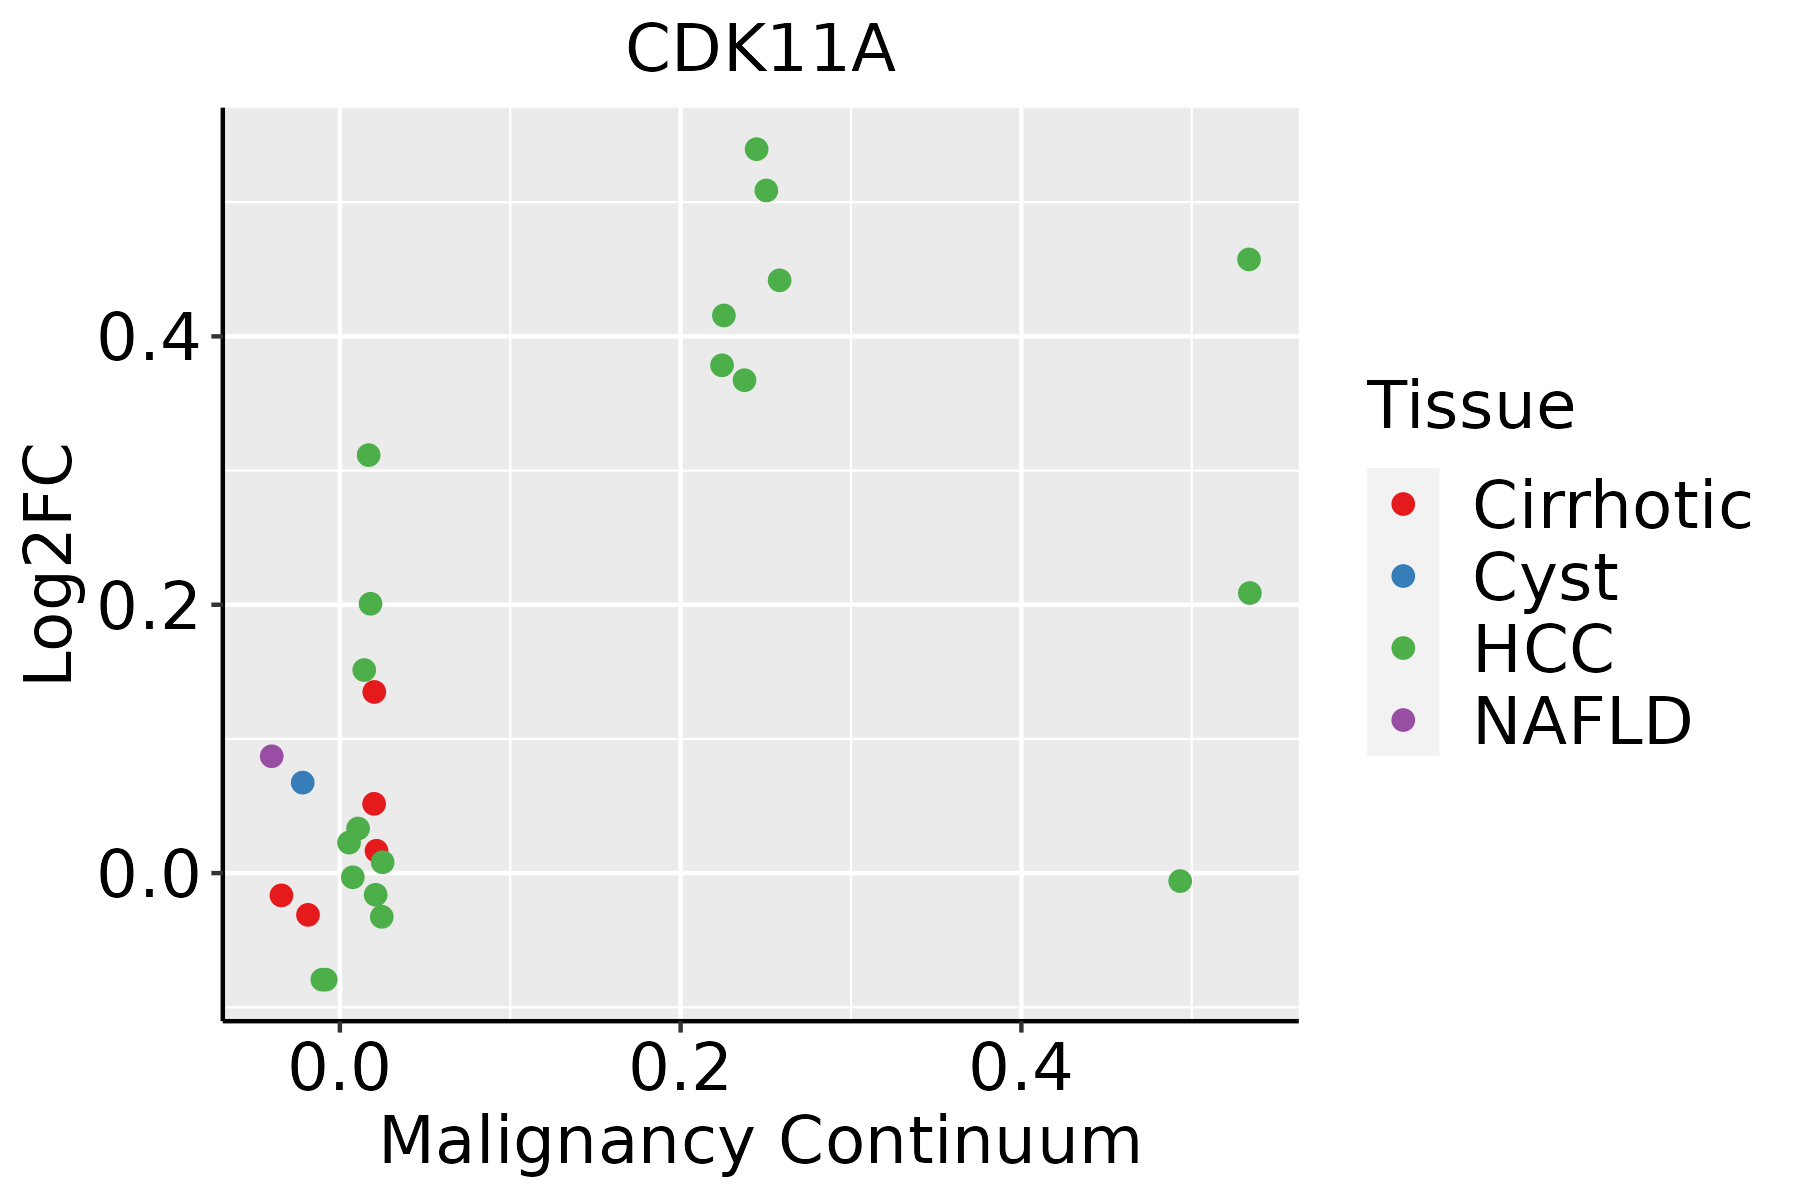 | HCC: Hepatocellular carcinoma |
| NAFLD: Non-alcoholic fatty liver disease | ||
| Oral Cavity | 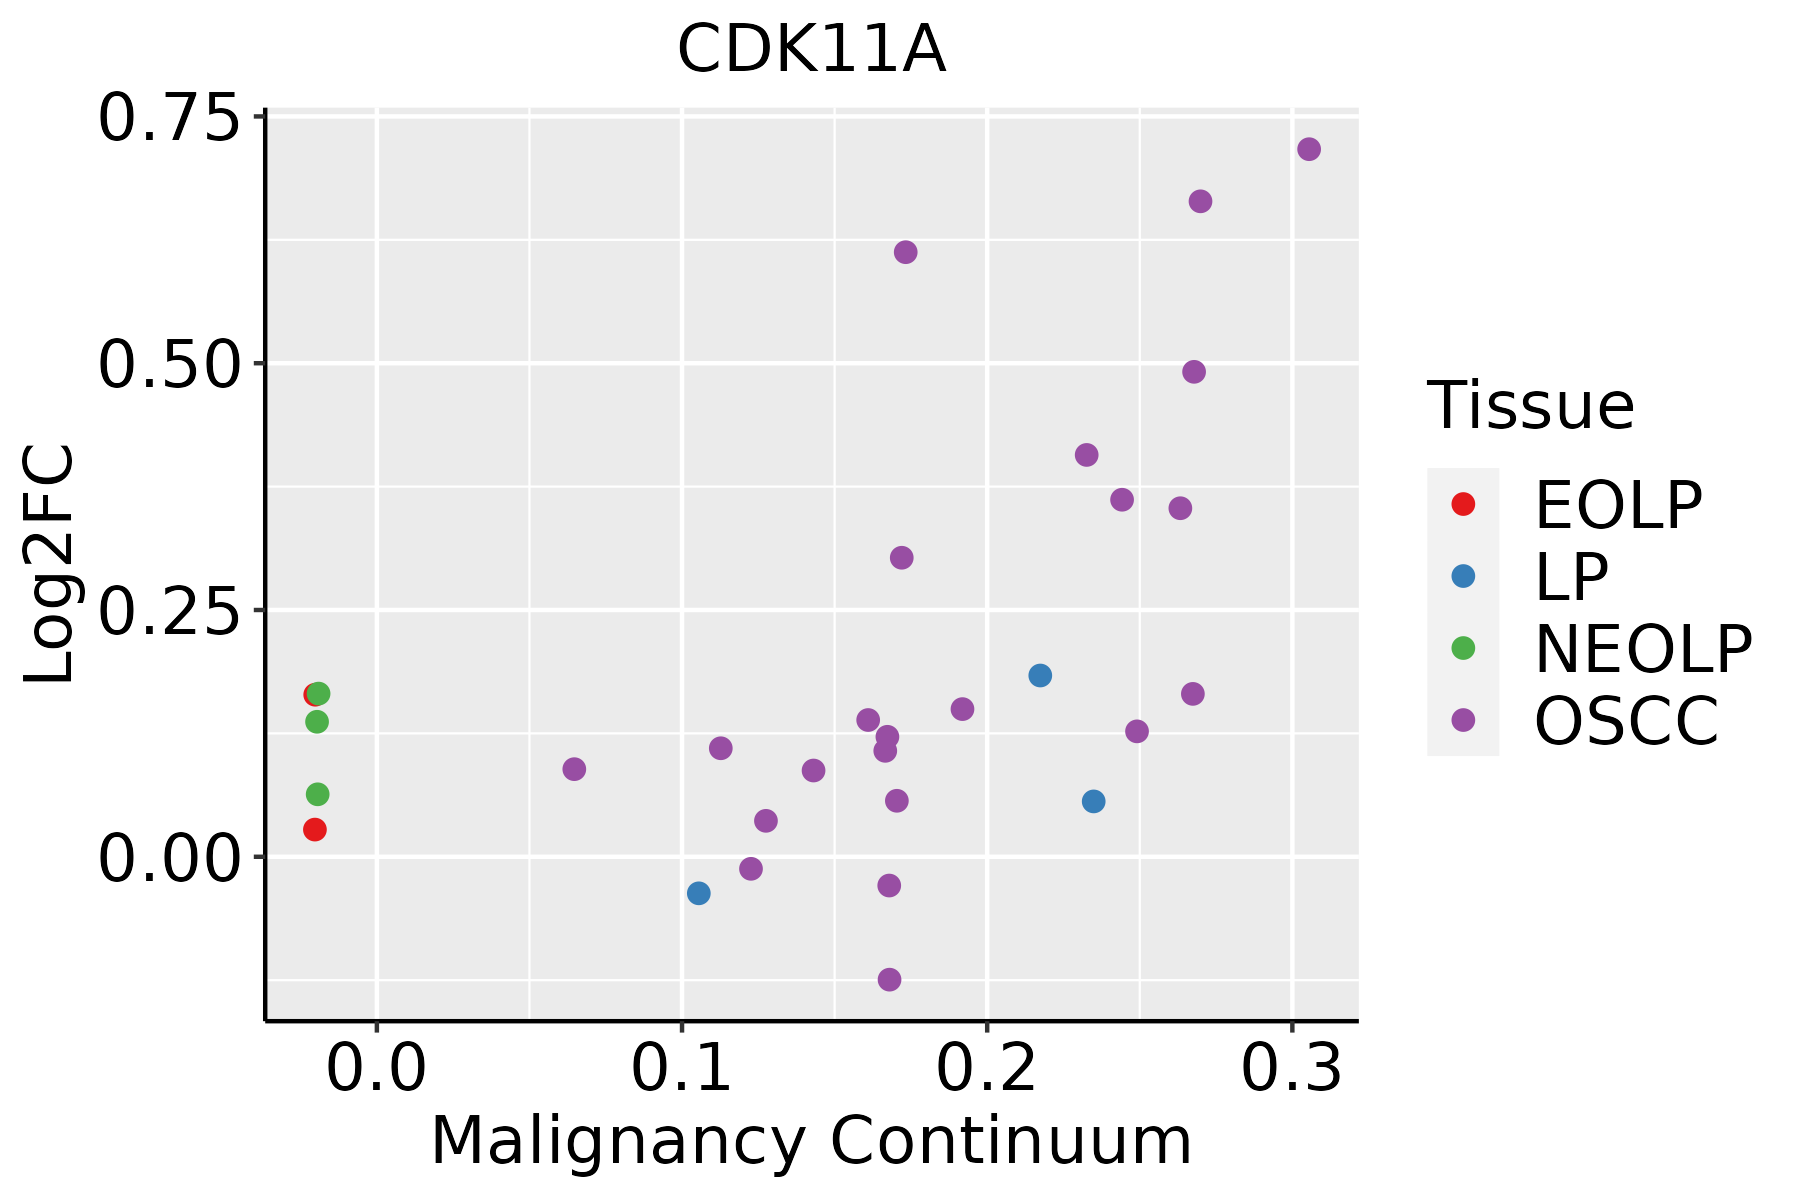 | EOLP: Erosive Oral lichen planus |
| LP: leukoplakia | ||
| NEOLP: Non-erosive oral lichen planus | ||
| OSCC: Oral squamous cell carcinoma | ||
| Skin | 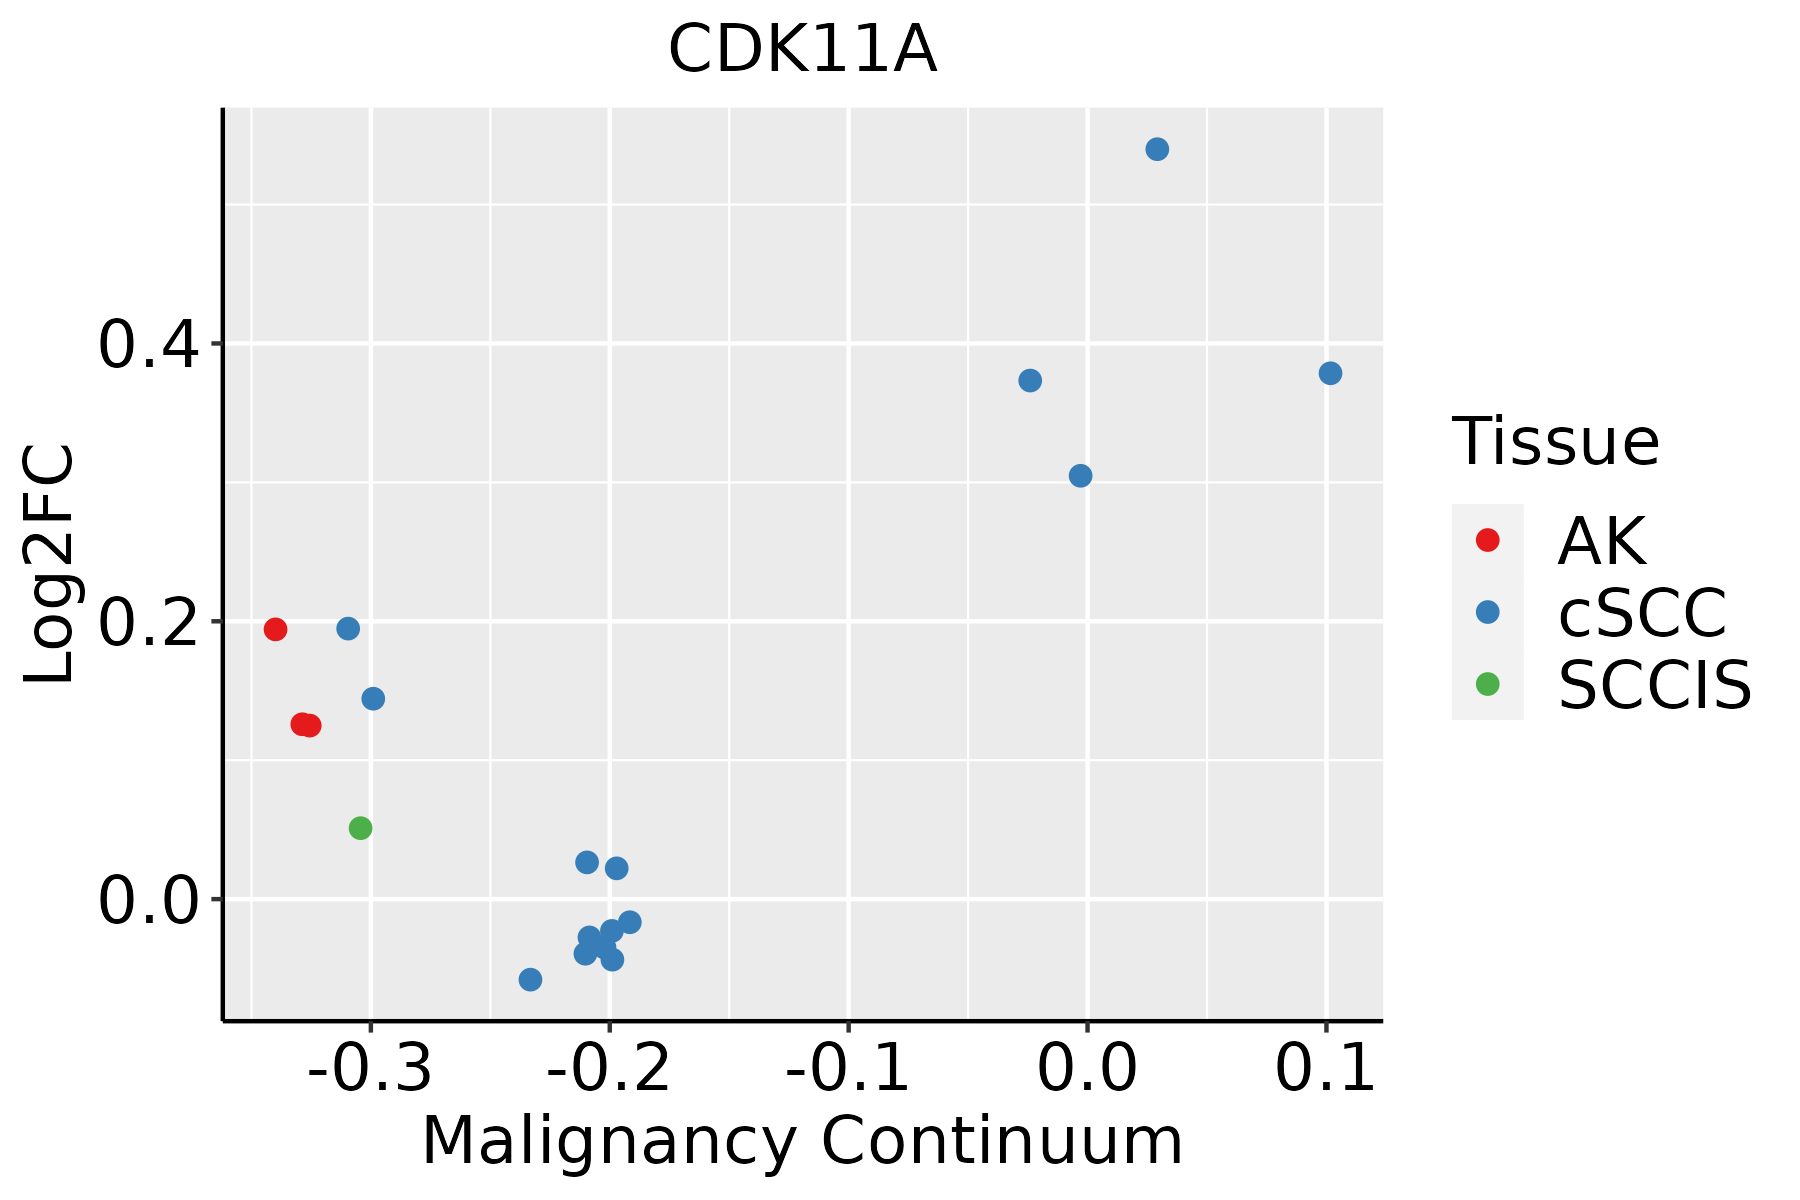 | AK: Actinic keratosis |
| cSCC: Cutaneous squamous cell carcinoma | ||
| SCCIS:squamous cell carcinoma in situ | ||
| Thyroid | 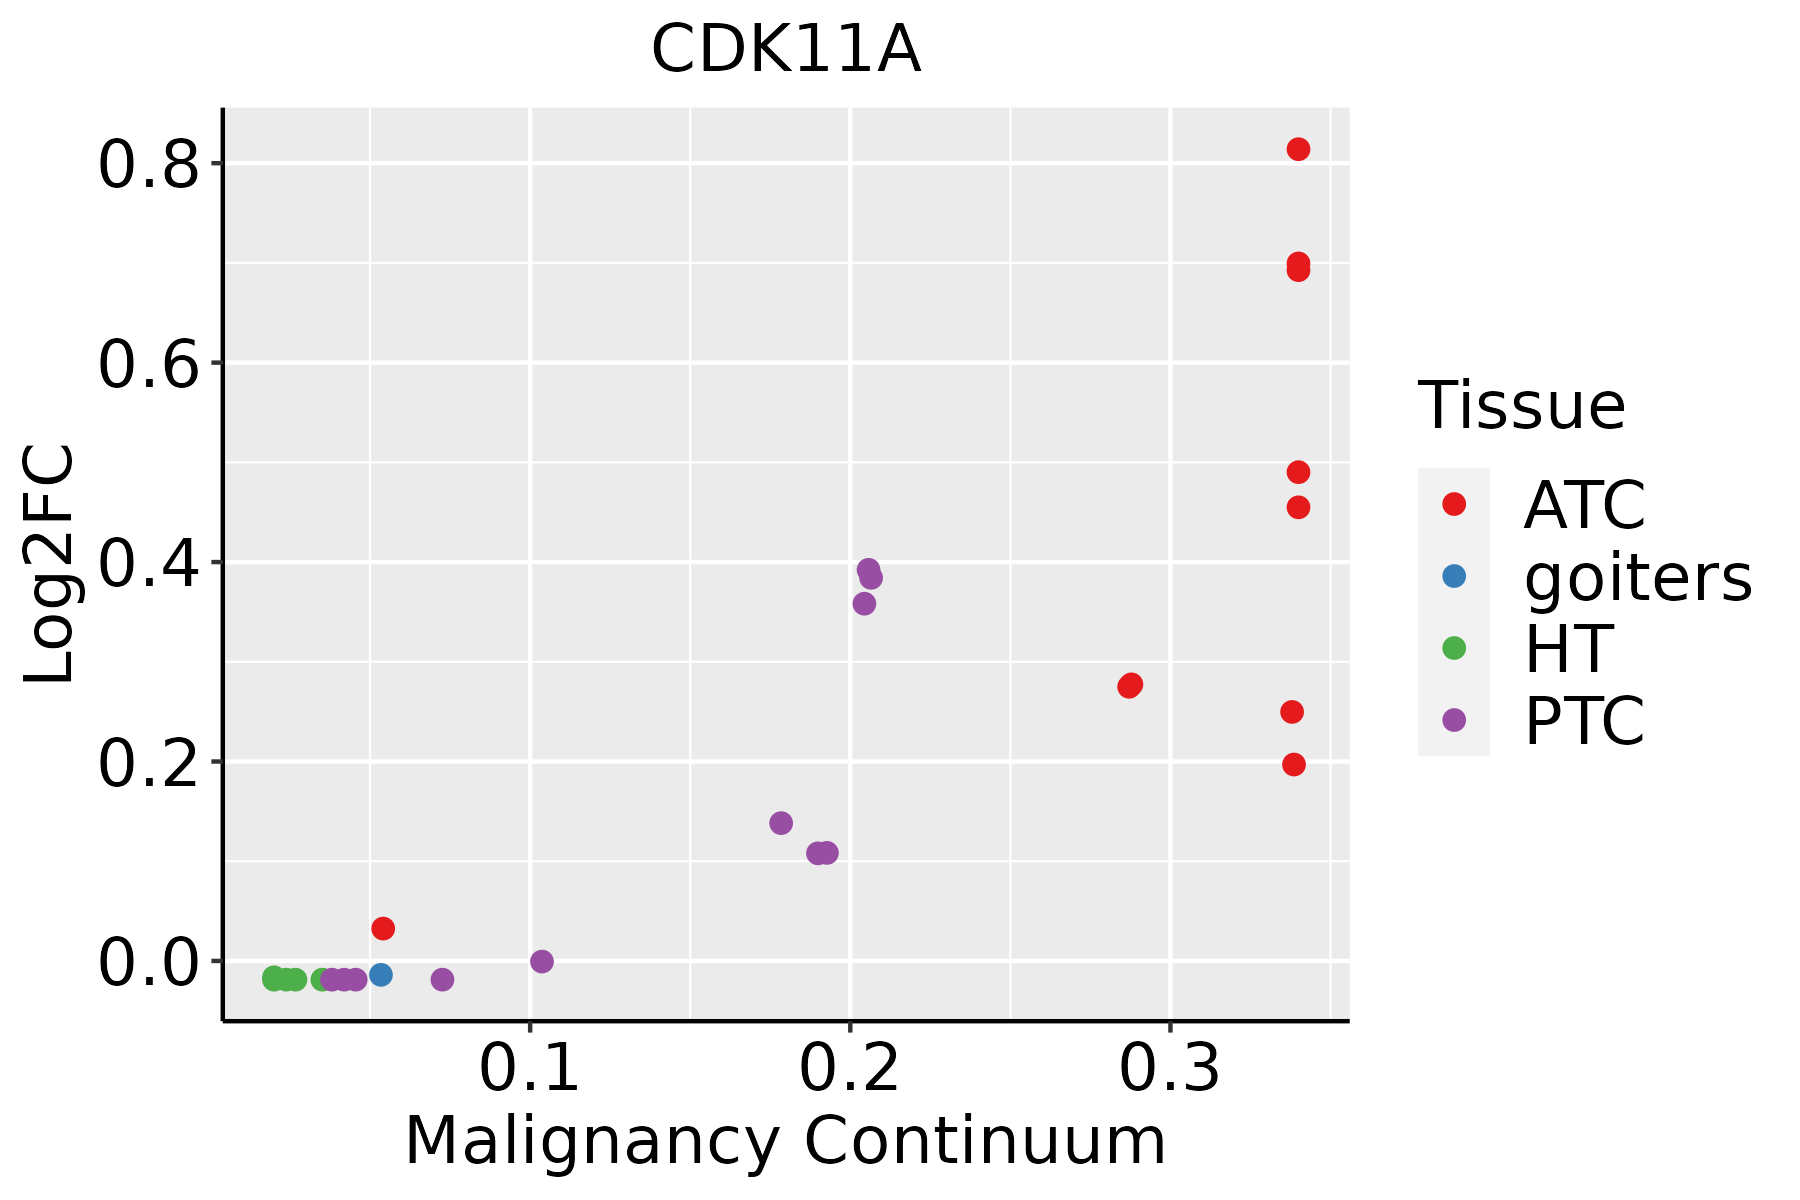 | ATC: Anaplastic thyroid cancer |
| HT: Hashimoto's thyroiditis | ||
| PTC: Papillary thyroid cancer |
| ∗log2FC in expression of this searched gene in stem-like cells from each diseased tissue sample relative to stem-like cells in normal samples in each tissue plotted against the malignancy continuum. Samples are colored based on if they are from different disease stage. |
Top |
Malignant transformation related pathway analysis |
| Find out the enriched GO biological processes and KEGG pathways involved in transition from healthy to precancer to cancer |
| Tissue | Disease Stage | Enriched GO biological Processes |
| Colorectum | AD |  |
| Colorectum | SER |  |
| Colorectum | MSS |  |
| Colorectum | MSI-H |  |
| Colorectum | FAP |  |
| ∗Top 15 enriched GO BP terms are showed in the bar plot of each disease state in each tissue. Each row represents a significant GO biological process which is colored according to the -log10(p.adjust). |
| Page: 1 2 3 4 5 6 7 8 9 |
| GO ID | Tissue | Disease Stage | Description | Gene Ratio | Bg Ratio | pvalue | p.adjust | Count |
| GO:1903311 | Colorectum | AD | regulation of mRNA metabolic process | 117/3918 | 288/18723 | 1.69e-14 | 4.23e-12 | 117 |
| GO:0050684 | Colorectum | AD | regulation of mRNA processing | 61/3918 | 137/18723 | 4.23e-10 | 3.58e-08 | 61 |
| GO:0016049 | Colorectum | AD | cell growth | 143/3918 | 482/18723 | 2.83e-06 | 8.09e-05 | 143 |
| GO:0001558 | Colorectum | AD | regulation of cell growth | 124/3918 | 414/18723 | 7.67e-06 | 1.86e-04 | 124 |
| GO:0007346 | Colorectum | AD | regulation of mitotic cell cycle | 119/3918 | 457/18723 | 4.60e-03 | 3.14e-02 | 119 |
| GO:19033111 | Colorectum | SER | regulation of mRNA metabolic process | 78/2897 | 288/18723 | 2.61e-07 | 1.43e-05 | 78 |
| GO:00506841 | Colorectum | SER | regulation of mRNA processing | 42/2897 | 137/18723 | 5.57e-06 | 2.01e-04 | 42 |
| GO:00015581 | Colorectum | SER | regulation of cell growth | 90/2897 | 414/18723 | 4.00e-04 | 6.02e-03 | 90 |
| GO:00160491 | Colorectum | SER | cell growth | 100/2897 | 482/18723 | 1.07e-03 | 1.24e-02 | 100 |
| GO:19033112 | Colorectum | MSS | regulation of mRNA metabolic process | 115/3467 | 288/18723 | 1.23e-17 | 6.41e-15 | 115 |
| GO:00506842 | Colorectum | MSS | regulation of mRNA processing | 57/3467 | 137/18723 | 2.88e-10 | 2.68e-08 | 57 |
| GO:00160492 | Colorectum | MSS | cell growth | 123/3467 | 482/18723 | 7.15e-05 | 1.21e-03 | 123 |
| GO:00015582 | Colorectum | MSS | regulation of cell growth | 105/3467 | 414/18723 | 2.97e-04 | 3.90e-03 | 105 |
| GO:00073461 | Colorectum | MSS | regulation of mitotic cell cycle | 108/3467 | 457/18723 | 3.30e-03 | 2.50e-02 | 108 |
| GO:19033114 | Colorectum | FAP | regulation of mRNA metabolic process | 97/2622 | 288/18723 | 1.35e-17 | 4.13e-14 | 97 |
| GO:00506844 | Colorectum | FAP | regulation of mRNA processing | 51/2622 | 137/18723 | 9.70e-12 | 4.96e-09 | 51 |
| GO:00160493 | Colorectum | FAP | cell growth | 112/2622 | 482/18723 | 2.40e-08 | 2.30e-06 | 112 |
| GO:00015583 | Colorectum | FAP | regulation of cell growth | 95/2622 | 414/18723 | 5.02e-07 | 2.61e-05 | 95 |
| GO:00073462 | Colorectum | FAP | regulation of mitotic cell cycle | 85/2622 | 457/18723 | 3.41e-03 | 2.48e-02 | 85 |
| GO:19033115 | Colorectum | CRC | regulation of mRNA metabolic process | 80/2078 | 288/18723 | 3.21e-15 | 6.40e-12 | 80 |
| Page: 1 2 3 4 |
| Pathway ID | Tissue | Disease Stage | Description | Gene Ratio | Bg Ratio | pvalue | p.adjust | qvalue | Count |
| Page: 1 |
Top |
Cell-cell communication analysis |
| Identification of potential cell-cell interactions between two cell types and their ligand-receptor pairs for different disease states |
| Ligand | Receptor | LRpair | Pathway | Tissue | Disease Stage |
| Page: 1 |
Top |
Single-cell gene regulatory network inference analysis |
| Find out the significant the regulons (TFs) and the target genes of each regulon across cell types for different disease states |
| TF | Cell Type | Tissue | Disease Stage | Target Gene | RSS | Regulon Activity |
| ∗The dot plots of a searched regulon are shown for all cell subpopulations in each disease state of each tissue based on the regulon specific score inferred using pySCENIC and by calculating the average expression. |
| Page: 1 |
Top |
Somatic mutation of malignant transformation related genes |
| Annotation of somatic variants for genes involved in malignant transformation |
| Hugo Symbol | Variant Class | Variant Classification | dbSNP RS | HGVSc | HGVSp | HGVSp Short | SWISSPROT | BIOTYPE | SIFT | PolyPhen | Tumor Sample Barcode | Tissue | Histology | Sex | Age | Stage | Therapy Types | Drugs | Outcome |
| CDK11A | SNV | Missense_Mutation | c.222N>T | p.Glu74Asp | p.E74D | Q9UQ88 | protein_coding | deleterious_low_confidence(0.05) | probably_damaging(0.99) | TCGA-BH-A0W4-01 | Breast | breast invasive carcinoma | Female | <65 | I/II | Unknown | Unknown | SD | |
| CDK11A | SNV | Missense_Mutation | rs745508835 | c.452N>A | p.Arg151Lys | p.R151K | Q9UQ88 | protein_coding | deleterious_low_confidence(0.01) | possibly_damaging(0.907) | TCGA-BH-A18P-01 | Breast | breast invasive carcinoma | Female | <65 | I/II | Unknown | Unknown | PD |
| CDK11A | SNV | Missense_Mutation | c.1829G>T | p.Trp610Leu | p.W610L | Q9UQ88 | protein_coding | deleterious(0) | benign(0.085) | TCGA-C8-A1HK-01 | Breast | breast invasive carcinoma | Female | <65 | I/II | Unknown | Unknown | SD | |
| CDK11A | SNV | Missense_Mutation | rs753016535 | c.1897G>A | p.Asp633Asn | p.D633N | Q9UQ88 | protein_coding | deleterious(0.03) | possibly_damaging(0.611) | TCGA-C8-A3M7-01 | Breast | breast invasive carcinoma | Female | <65 | III/IV | Unknown | Unknown | PD |
| CDK11A | SNV | Missense_Mutation | c.1244C>T | p.Pro415Leu | p.P415L | Q9UQ88 | protein_coding | deleterious(0) | probably_damaging(0.988) | TCGA-D8-A1JE-01 | Breast | breast invasive carcinoma | Female | <65 | I/II | Chemotherapy | adriamicin | SD | |
| CDK11A | SNV | Missense_Mutation | novel | c.327N>T | p.Trp109Cys | p.W109C | Q9UQ88 | protein_coding | tolerated_low_confidence(0.06) | benign(0.006) | TCGA-EW-A6SD-01 | Breast | breast invasive carcinoma | Female | <65 | I/II | Chemotherapy | tch | SD |
| CDK11A | SNV | Missense_Mutation | novel | c.1386N>C | p.Glu462Asp | p.E462D | Q9UQ88 | protein_coding | deleterious(0.02) | probably_damaging(0.987) | TCGA-HM-A4S6-01 | Cervix | cervical & endocervical cancer | Female | <65 | III/IV | Chemotherapy | cisplatin | CR |
| CDK11A | SNV | Missense_Mutation | novel | c.358G>A | p.Glu120Lys | p.E120K | Q9UQ88 | protein_coding | deleterious_low_confidence(0.04) | probably_damaging(0.941) | TCGA-AA-A00N-01 | Colorectum | colon adenocarcinoma | Male | >=65 | I/II | Unknown | Unknown | PD |
| CDK11A | SNV | Missense_Mutation | rs768015274 | c.1687A>G | p.Ile563Val | p.I563V | Q9UQ88 | protein_coding | tolerated(0.13) | benign(0.005) | TCGA-AA-A022-01 | Colorectum | colon adenocarcinoma | Female | >=65 | I/II | Unknown | Unknown | SD |
| CDK11A | SNV | Missense_Mutation | c.320N>G | p.Glu107Gly | p.E107G | Q9UQ88 | protein_coding | deleterious_low_confidence(0) | probably_damaging(0.954) | TCGA-CA-6718-01 | Colorectum | colon adenocarcinoma | Male | <65 | I/II | Unknown | Unknown | PD |
| Page: 1 2 3 4 |
Top |
Related drugs of malignant transformation related genes |
| Identification of chemicals and drugs interact with genes involved in malignant transfromation |
| (DGIdb 4.0) |
| Entrez ID | Symbol | Category | Interaction Types | Drug Claim Name | Drug Name | PMIDs |
| Page: 1 |

Copyright 2023-Present -The University of Texas Health Science Center at Houston |