| Tissue | Expression Dynamics | Abbreviation |
| Esophagus | 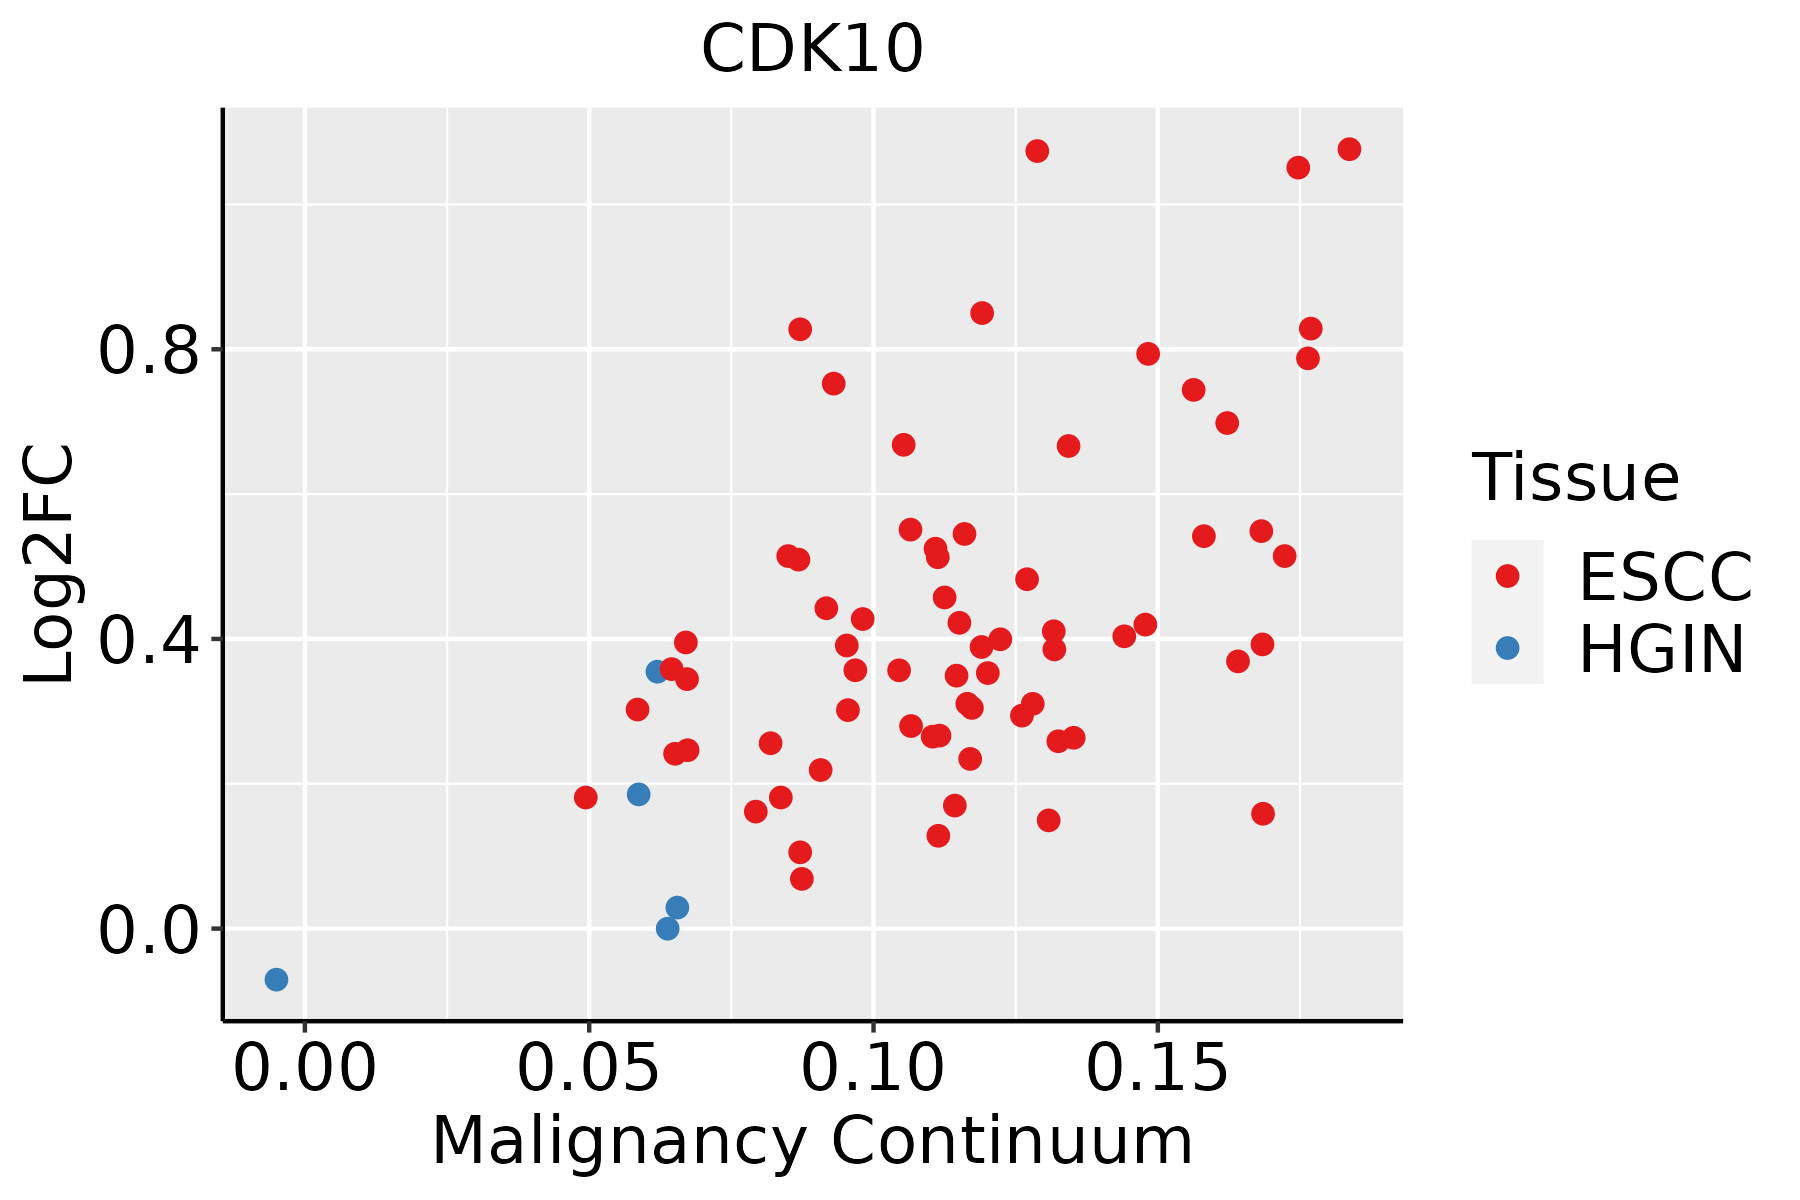 | ESCC: Esophageal squamous cell carcinoma |
| HGIN: High-grade intraepithelial neoplasias |
| LGIN: Low-grade intraepithelial neoplasias |
| Liver | 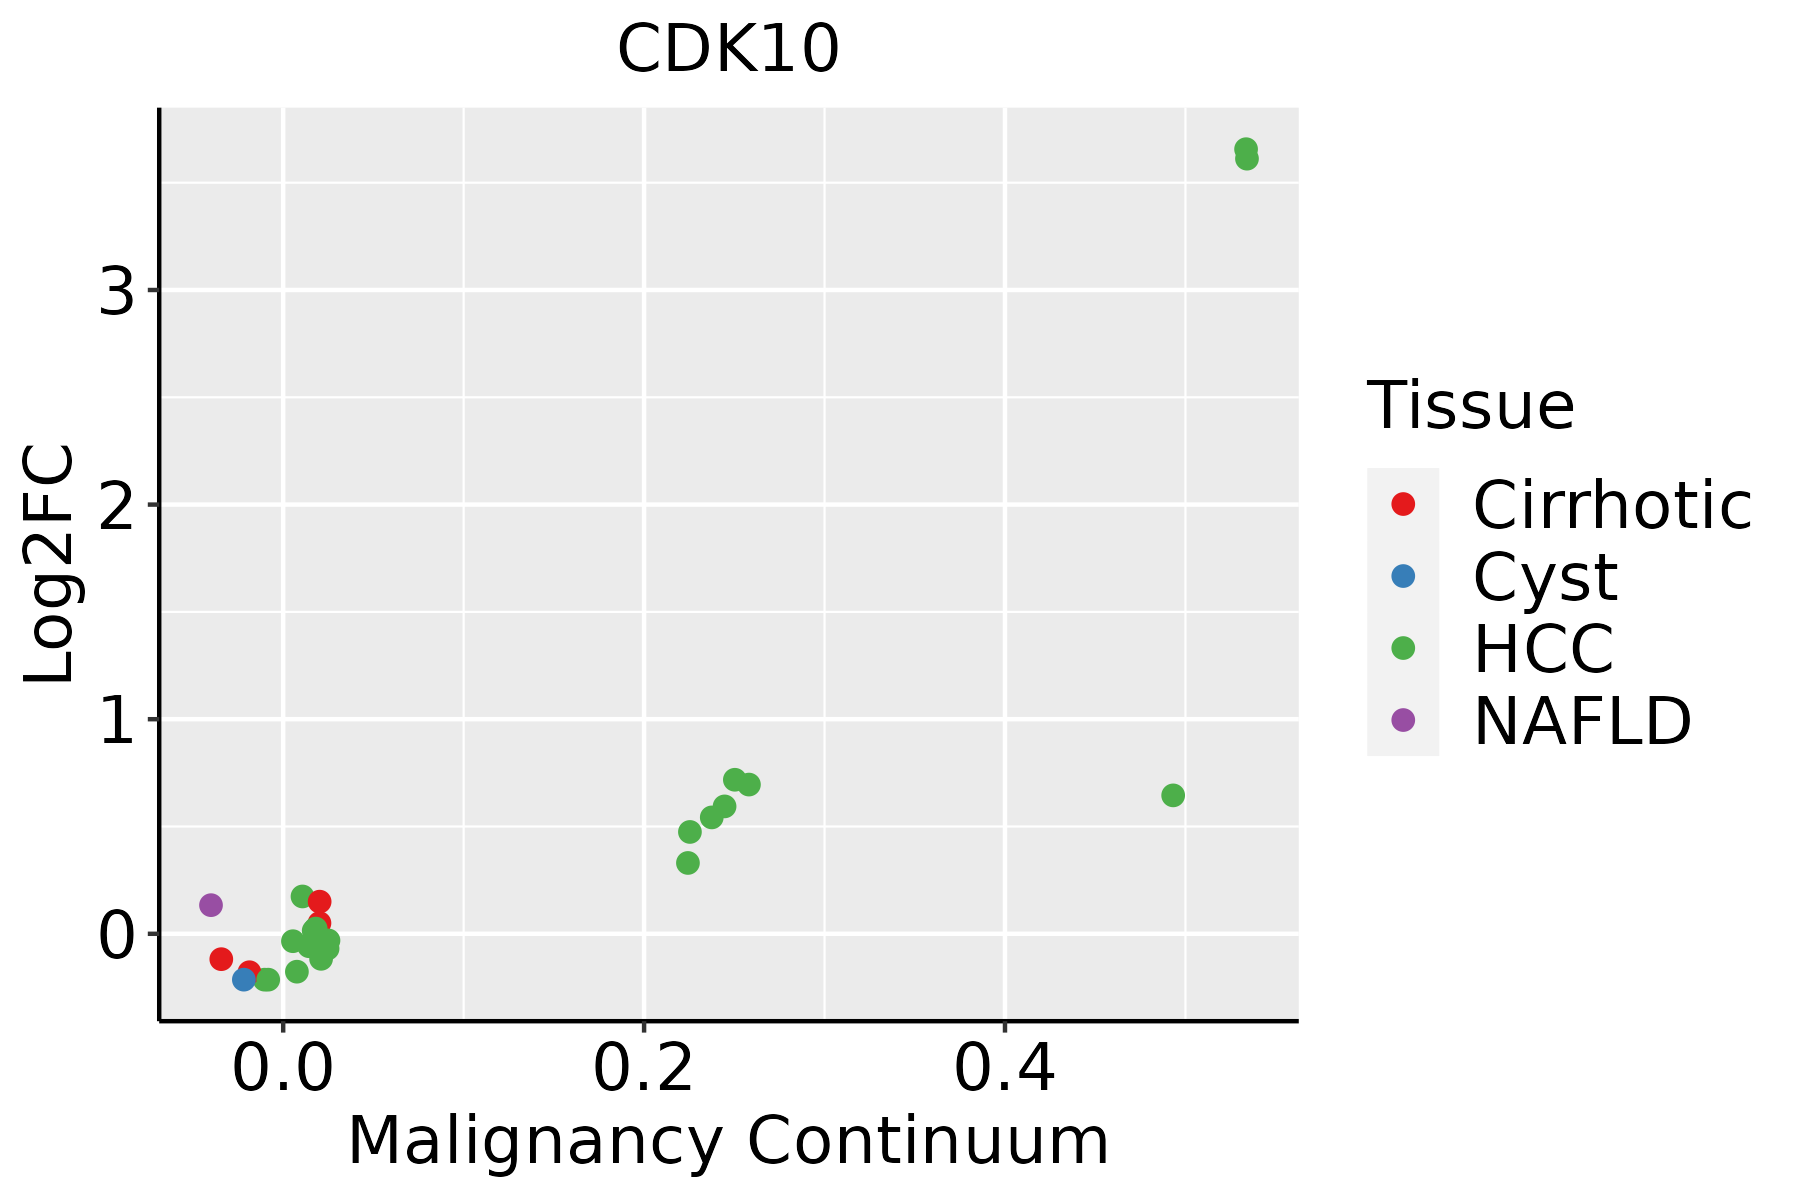 | HCC: Hepatocellular carcinoma |
| NAFLD: Non-alcoholic fatty liver disease |
| Oral Cavity | 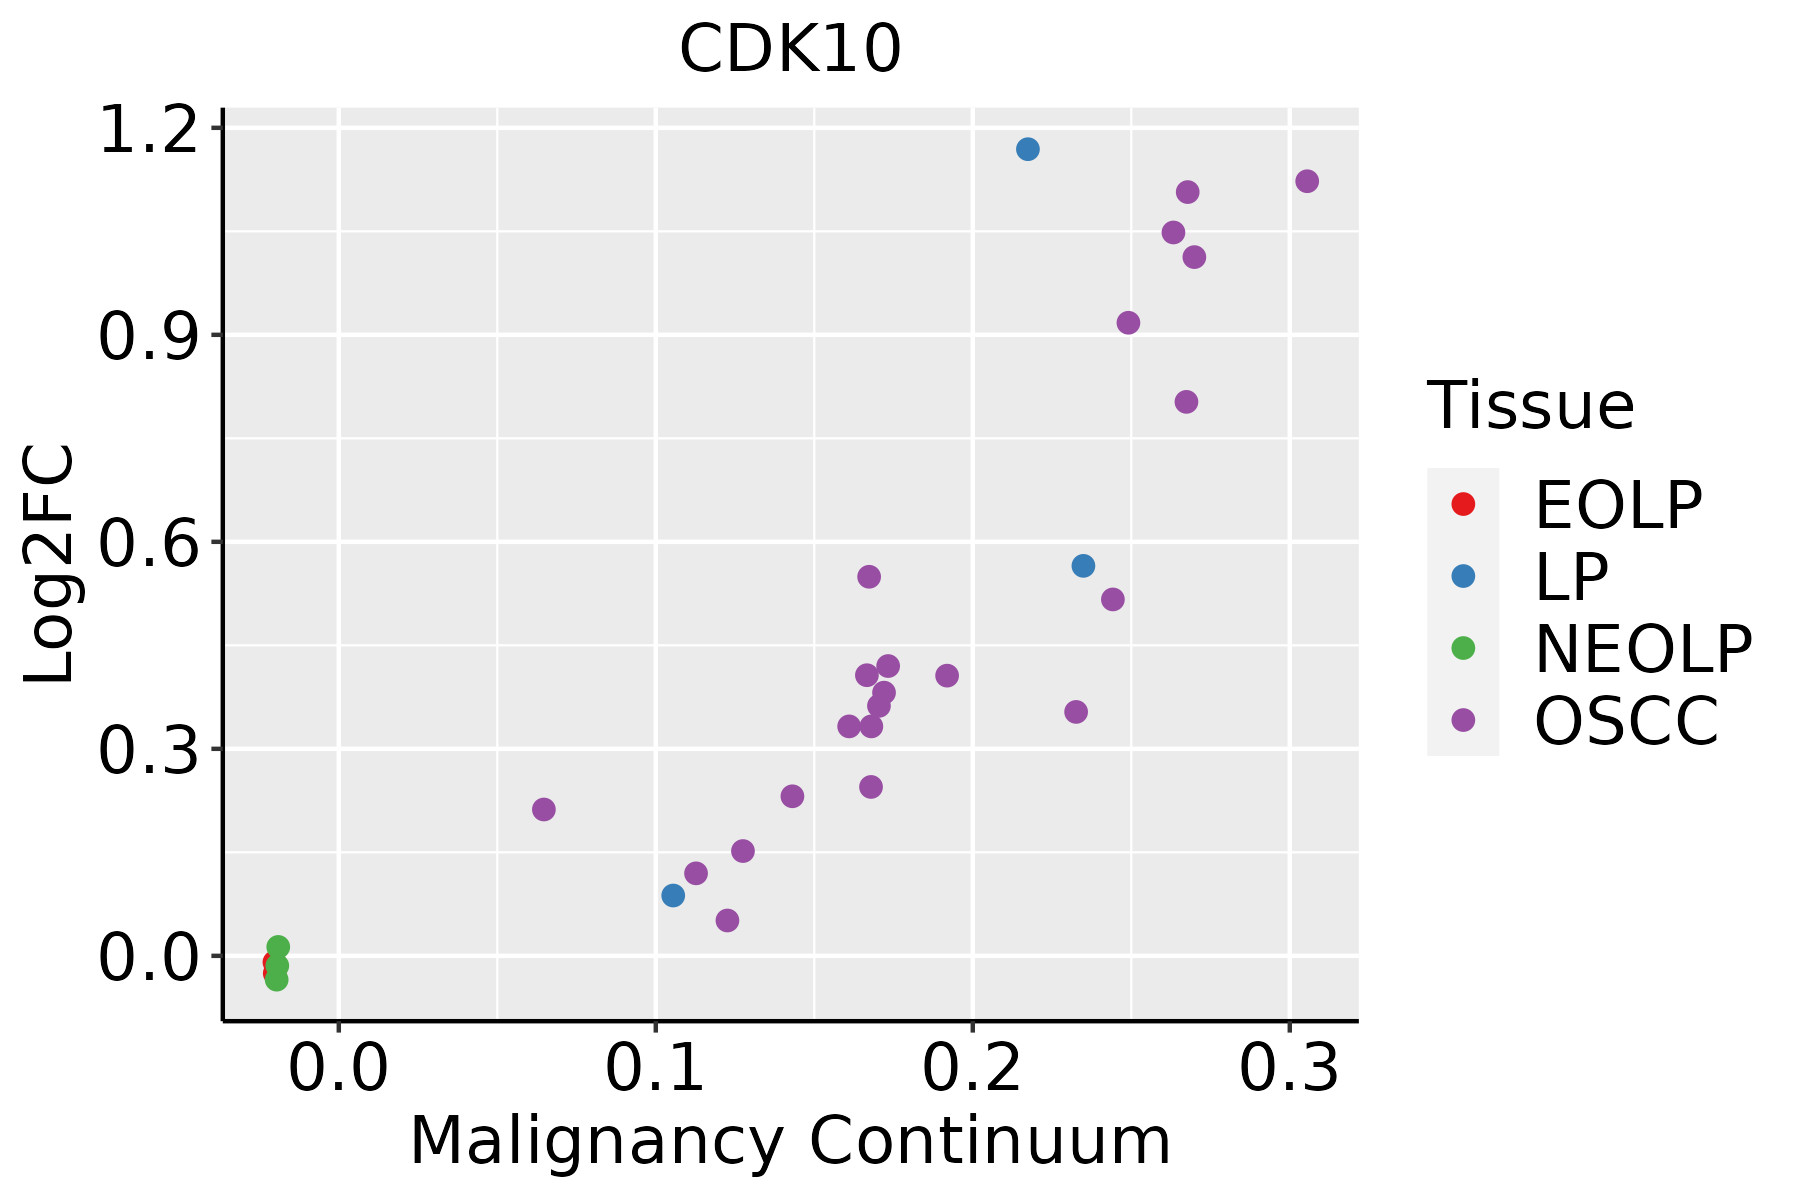 | EOLP: Erosive Oral lichen planus |
| LP: leukoplakia |
| NEOLP: Non-erosive oral lichen planus |
| OSCC: Oral squamous cell carcinoma |
| Thyroid |  | ATC: Anaplastic thyroid cancer |
| HT: Hashimoto's thyroiditis |
| PTC: Papillary thyroid cancer |
| GO ID | Tissue | Disease Stage | Description | Gene Ratio | Bg Ratio | pvalue | p.adjust | Count |
| GO:001063920 | Esophagus | HGIN | negative regulation of organelle organization | 79/2587 | 348/18723 | 4.12e-06 | 1.37e-04 | 79 |
| GO:000734610 | Esophagus | HGIN | regulation of mitotic cell cycle | 98/2587 | 457/18723 | 4.39e-06 | 1.42e-04 | 98 |
| GO:00447729 | Esophagus | HGIN | mitotic cell cycle phase transition | 89/2587 | 424/18723 | 2.80e-05 | 7.21e-04 | 89 |
| GO:19021156 | Esophagus | HGIN | regulation of organelle assembly | 46/2587 | 186/18723 | 4.63e-05 | 1.12e-03 | 46 |
| GO:19019906 | Esophagus | HGIN | regulation of mitotic cell cycle phase transition | 65/2587 | 299/18723 | 1.12e-04 | 2.36e-03 | 65 |
| GO:20000456 | Esophagus | HGIN | regulation of G1/S transition of mitotic cell cycle | 36/2587 | 142/18723 | 1.74e-04 | 3.35e-03 | 36 |
| GO:00000827 | Esophagus | HGIN | G1/S transition of mitotic cell cycle | 48/2587 | 214/18723 | 3.97e-04 | 6.07e-03 | 48 |
| GO:00448437 | Esophagus | HGIN | cell cycle G1/S phase transition | 52/2587 | 241/18723 | 6.19e-04 | 8.58e-03 | 52 |
| GO:19028065 | Esophagus | HGIN | regulation of cell cycle G1/S phase transition | 39/2587 | 168/18723 | 6.60e-04 | 9.03e-03 | 39 |
| GO:003297027 | Esophagus | HGIN | regulation of actin filament-based process | 77/2587 | 397/18723 | 1.14e-03 | 1.39e-02 | 77 |
| GO:003295627 | Esophagus | HGIN | regulation of actin cytoskeleton organization | 69/2587 | 358/18723 | 2.35e-03 | 2.39e-02 | 69 |
| GO:19021162 | Esophagus | HGIN | negative regulation of organelle assembly | 13/2587 | 41/18723 | 2.62e-03 | 2.58e-02 | 13 |
| GO:004593110 | Esophagus | HGIN | positive regulation of mitotic cell cycle | 28/2587 | 121/18723 | 3.72e-03 | 3.39e-02 | 28 |
| GO:006049117 | Esophagus | HGIN | regulation of cell projection assembly | 39/2587 | 188/18723 | 5.61e-03 | 4.57e-02 | 39 |
| GO:19019876 | Esophagus | HGIN | regulation of cell cycle phase transition | 72/2587 | 390/18723 | 5.78e-03 | 4.70e-02 | 72 |
| GO:004477216 | Esophagus | ESCC | mitotic cell cycle phase transition | 281/8552 | 424/18723 | 4.63e-18 | 4.45e-16 | 281 |
| GO:000734615 | Esophagus | ESCC | regulation of mitotic cell cycle | 293/8552 | 457/18723 | 8.00e-16 | 5.64e-14 | 293 |
| GO:190198713 | Esophagus | ESCC | regulation of cell cycle phase transition | 242/8552 | 390/18723 | 3.86e-11 | 1.26e-09 | 242 |
| GO:190199013 | Esophagus | ESCC | regulation of mitotic cell cycle phase transition | 191/8552 | 299/18723 | 1.35e-10 | 3.94e-09 | 191 |
| GO:0010639110 | Esophagus | ESCC | negative regulation of organelle organization | 215/8552 | 348/18723 | 8.20e-10 | 2.01e-08 | 215 |
| Hugo Symbol | Variant Class | Variant Classification | dbSNP RS | HGVSc | HGVSp | HGVSp Short | SWISSPROT | BIOTYPE | SIFT | PolyPhen | Tumor Sample Barcode | Tissue | Histology | Sex | Age | Stage | Therapy Types | Drugs | Outcome |
| CDK10 | SNV | Missense_Mutation | rs369118585 | c.58N>A | p.Gly20Ser | p.G20S | Q15131 | protein_coding | tolerated(0.37) | benign(0.003) | TCGA-A2-A0CP-01 | Breast | breast invasive carcinoma | Female | <65 | I/II | Chemotherapy | cytoxan | SD |
| CDK10 | SNV | Missense_Mutation | | c.365A>G | p.Gln122Arg | p.Q122R | Q15131 | protein_coding | deleterious(0) | possibly_damaging(0.596) | TCGA-AR-A252-01 | Breast | breast invasive carcinoma | Female | <65 | I/II | Chemotherapy | doxorubicin | SD |
| CDK10 | SNV | Missense_Mutation | | c.995C>A | p.Pro332Gln | p.P332Q | Q15131 | protein_coding | deleterious(0.01) | possibly_damaging(0.862) | TCGA-D8-A27E-01 | Breast | breast invasive carcinoma | Female | >=65 | I/II | Hormone Therapy | tamoxiphen+anastrazolum | SD |
| CDK10 | SNV | Missense_Mutation | | c.77N>G | p.Pro26Arg | p.P26R | Q15131 | protein_coding | tolerated(0.07) | benign(0.062) | TCGA-E9-A1NA-01 | Breast | breast invasive carcinoma | Female | <65 | I/II | Chemotherapy | cyclophosphamide | SD |
| CDK10 | insertion | In_Frame_Ins | novel | c.552_553insCTCACGCCTGTGATCCCAGCACTTTTGGGA | p.Leu184_Ala185insLeuThrProValIleProAlaLeuLeuGly | p.L184_A185insLTPVIPALLG | Q15131 | protein_coding | | | TCGA-AO-A0JF-01 | Breast | breast invasive carcinoma | Female | >=65 | I/II | Chemotherapy | doxorubicin | SD |
| CDK10 | insertion | Nonsense_Mutation | novel | c.598_599insGGTTTCCAACTTGCTCATGACCGACAAGGGT | p.Val200GlyfsTer7 | p.V200Gfs*7 | Q15131 | protein_coding | | | TCGA-BH-A0HQ-01 | Breast | breast invasive carcinoma | Female | <65 | I/II | Hormone Therapy | arimidex | SD |
| CDK10 | SNV | Missense_Mutation | rs145469184 | c.661G>A | p.Asp221Asn | p.D221N | Q15131 | protein_coding | deleterious(0) | probably_damaging(0.979) | TCGA-2W-A8YY-01 | Cervix | cervical & endocervical cancer | Female | <65 | I/II | Chemotherapy | cisplatin | CR |
| CDK10 | SNV | Missense_Mutation | | c.184G>C | p.Asp62His | p.D62H | Q15131 | protein_coding | deleterious(0.03) | benign(0.053) | TCGA-EK-A2PL-01 | Cervix | cervical & endocervical cancer | Female | <65 | III/IV | Unknown | Unknown | SD |
| CDK10 | SNV | Missense_Mutation | rs373968493 | c.275N>A | p.Arg92His | p.R92H | Q15131 | protein_coding | deleterious(0.04) | possibly_damaging(0.82) | TCGA-HG-A2PA-01 | Cervix | cervical & endocervical cancer | Female | <65 | I/II | Unspecific | Taxol | PD |
| CDK10 | SNV | Missense_Mutation | novel | c.222N>C | p.Lys74Asn | p.K74N | Q15131 | protein_coding | tolerated(0.26) | benign(0.013) | TCGA-HM-A4S6-01 | Cervix | cervical & endocervical cancer | Female | <65 | III/IV | Chemotherapy | cisplatin | CR |
| Entrez ID | Symbol | Category | Interaction Types | Drug Claim Name | Drug Name | PMIDs |
| 8558 | CDK10 | DRUGGABLE GENOME, KINASE, TRANSCRIPTION FACTOR, ENZYME, SERINE THREONINE KINASE | inhibitor | CHEMBL488436 | AZD-5438 | |
| 8558 | CDK10 | DRUGGABLE GENOME, KINASE, TRANSCRIPTION FACTOR, ENZYME, SERINE THREONINE KINASE | inhibitor | CHEMBL1230607 | PHA-793887 | |
| 8558 | CDK10 | DRUGGABLE GENOME, KINASE, TRANSCRIPTION FACTOR, ENZYME, SERINE THREONINE KINASE | inhibitor | CHEMBL3544942 | RONICICLIB | |
| 8558 | CDK10 | DRUGGABLE GENOME, KINASE, TRANSCRIPTION FACTOR, ENZYME, SERINE THREONINE KINASE | | ALVOCIDIB | ALVOCIDIB | |
| 8558 | CDK10 | DRUGGABLE GENOME, KINASE, TRANSCRIPTION FACTOR, ENZYME, SERINE THREONINE KINASE | inhibitor | CHEMBL445813 | AT-7519 | |


