
|
|||||
|
 | |
| |
| |
| |
| |
| |
|
Gene: CDIPT |
Gene summary for CDIPT |
| Gene information | Species | Human | Gene symbol | CDIPT | Gene ID | 10423 |
| Gene name | CDP-diacylglycerol--inositol 3-phosphatidyltransferase | |
| Gene Alias | PIS | |
| Cytomap | 16p11.2 | |
| Gene Type | protein-coding | GO ID | GO:0006629 | UniProtAcc | A8K3L7 |
Top |
Malignant transformation analysis |
| Identification of the aberrant gene expression in precancerous and cancerous lesions by comparing the gene expression of stem-like cells in diseased tissues with normal stem cells |
| Entrez ID | Symbol | Replicates | Species | Organ | Tissue | Adj P-value | Log2FC | Malignancy |
| 10423 | CDIPT | HTA11_3410_2000001011 | Human | Colorectum | AD | 2.74e-11 | 2.72e-01 | 0.0155 |
| 10423 | CDIPT | HTA11_2487_2000001011 | Human | Colorectum | SER | 9.98e-17 | 5.63e-01 | -0.1808 |
| 10423 | CDIPT | HTA11_1938_2000001011 | Human | Colorectum | AD | 1.08e-14 | 5.59e-01 | -0.0811 |
| 10423 | CDIPT | HTA11_78_2000001011 | Human | Colorectum | AD | 5.86e-11 | 4.04e-01 | -0.1088 |
| 10423 | CDIPT | HTA11_347_2000001011 | Human | Colorectum | AD | 1.35e-32 | 6.86e-01 | -0.1954 |
| 10423 | CDIPT | HTA11_411_2000001011 | Human | Colorectum | SER | 3.68e-11 | 9.61e-01 | -0.2602 |
| 10423 | CDIPT | HTA11_2112_2000001011 | Human | Colorectum | SER | 4.08e-05 | 4.68e-01 | -0.2196 |
| 10423 | CDIPT | HTA11_3361_2000001011 | Human | Colorectum | AD | 1.07e-09 | 3.79e-01 | -0.1207 |
| 10423 | CDIPT | HTA11_83_2000001011 | Human | Colorectum | SER | 6.97e-10 | 4.03e-01 | -0.1526 |
| 10423 | CDIPT | HTA11_696_2000001011 | Human | Colorectum | AD | 9.36e-15 | 3.99e-01 | -0.1464 |
| 10423 | CDIPT | HTA11_866_2000001011 | Human | Colorectum | AD | 8.75e-09 | 3.69e-01 | -0.1001 |
| 10423 | CDIPT | HTA11_1391_2000001011 | Human | Colorectum | AD | 1.10e-23 | 5.77e-01 | -0.059 |
| 10423 | CDIPT | HTA11_2992_2000001011 | Human | Colorectum | SER | 1.50e-04 | 3.62e-01 | -0.1706 |
| 10423 | CDIPT | HTA11_5212_2000001011 | Human | Colorectum | AD | 6.08e-10 | 4.76e-01 | -0.2061 |
| 10423 | CDIPT | HTA11_5216_2000001011 | Human | Colorectum | SER | 1.14e-05 | 3.76e-01 | -0.1462 |
| 10423 | CDIPT | HTA11_546_2000001011 | Human | Colorectum | AD | 1.56e-07 | 4.03e-01 | -0.0842 |
| 10423 | CDIPT | HTA11_9341_2000001011 | Human | Colorectum | SER | 4.71e-03 | 4.99e-01 | -0.00410000000000005 |
| 10423 | CDIPT | HTA11_7862_2000001011 | Human | Colorectum | AD | 2.57e-08 | 3.66e-01 | -0.0179 |
| 10423 | CDIPT | HTA11_866_3004761011 | Human | Colorectum | AD | 3.49e-18 | 4.61e-01 | 0.096 |
| 10423 | CDIPT | HTA11_4255_2000001011 | Human | Colorectum | SER | 9.55e-04 | 3.24e-01 | 0.0446 |
| Page: 1 2 3 4 5 6 7 8 |
| Tissue | Expression Dynamics | Abbreviation |
| Colorectum (GSE201348) |  | FAP: Familial adenomatous polyposis |
| CRC: Colorectal cancer | ||
| Colorectum (HTA11) | 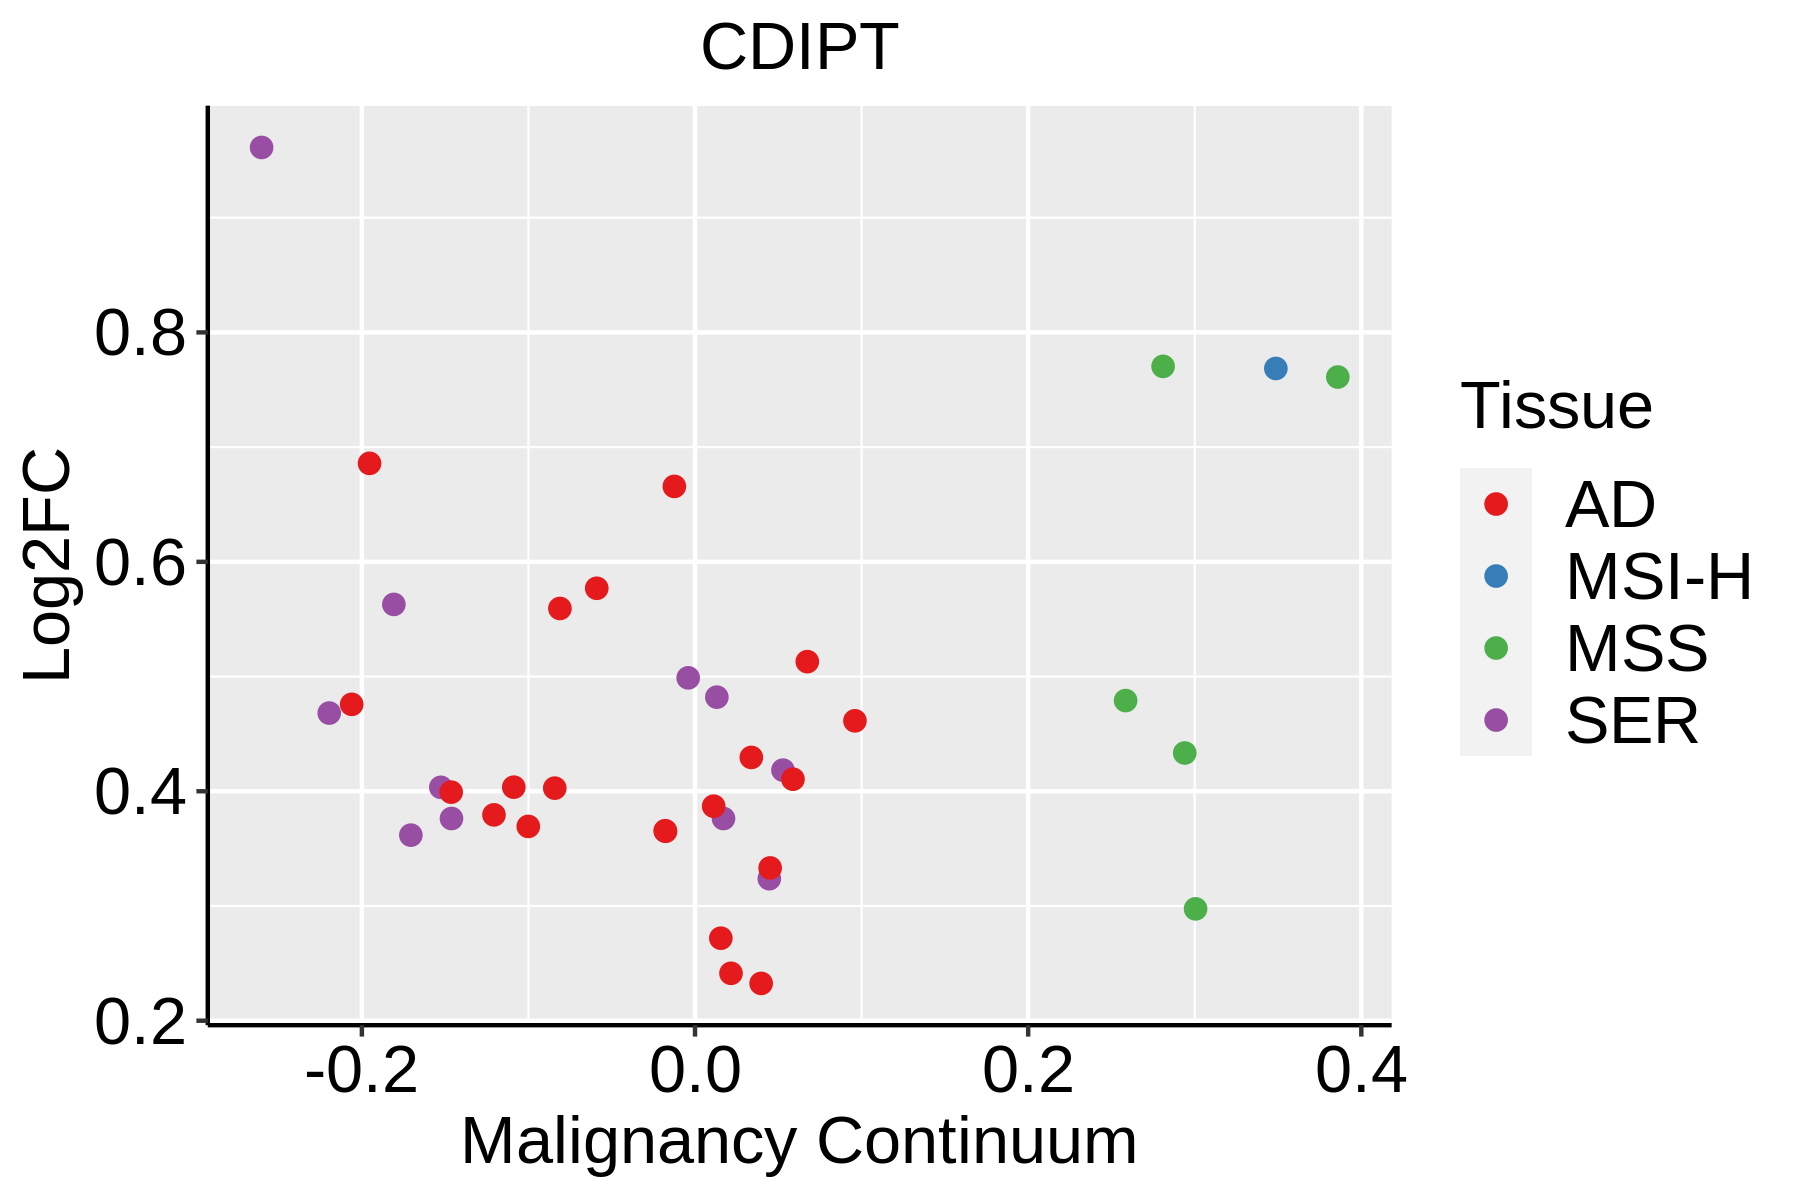 | AD: Adenomas |
| SER: Sessile serrated lesions | ||
| MSI-H: Microsatellite-high colorectal cancer | ||
| MSS: Microsatellite stable colorectal cancer | ||
| Esophagus | 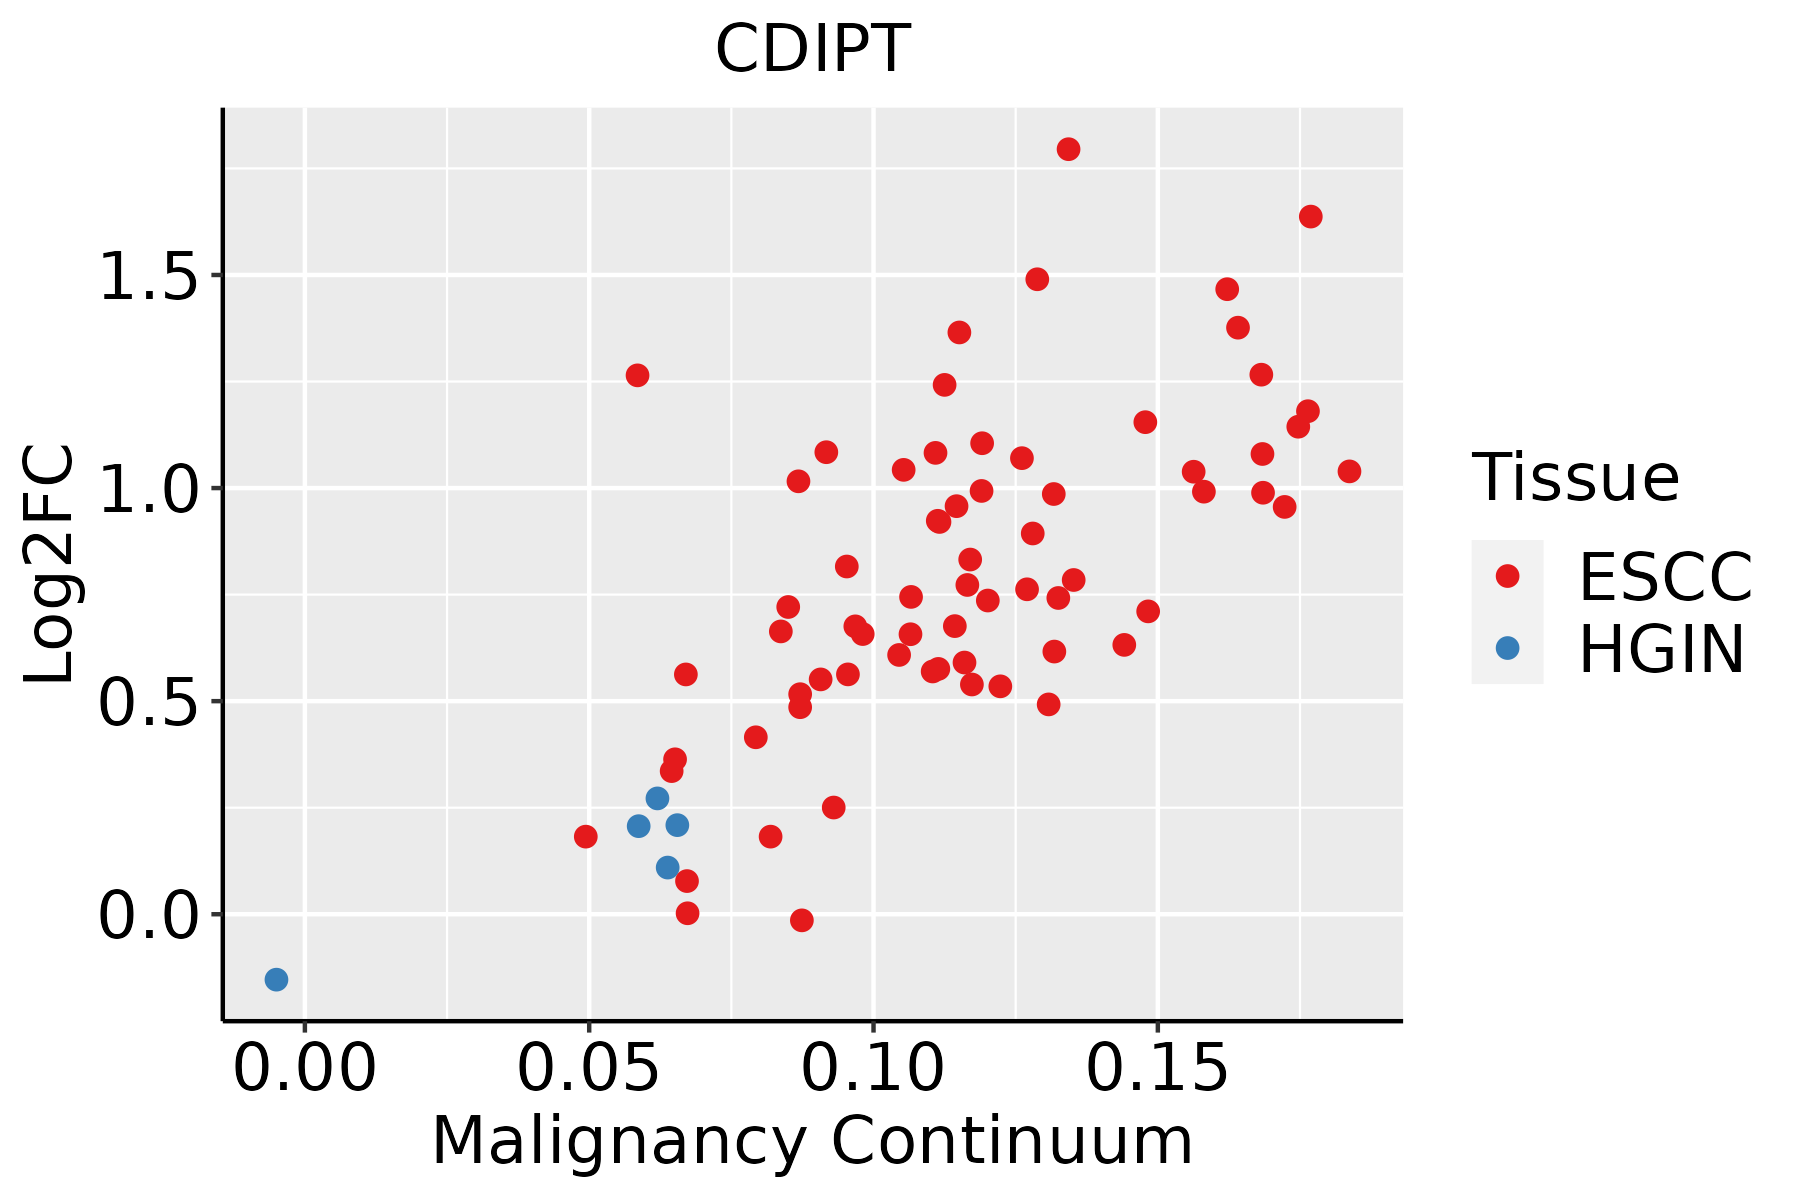 | ESCC: Esophageal squamous cell carcinoma |
| HGIN: High-grade intraepithelial neoplasias | ||
| LGIN: Low-grade intraepithelial neoplasias | ||
| Liver |  | HCC: Hepatocellular carcinoma |
| NAFLD: Non-alcoholic fatty liver disease | ||
| Oral Cavity | 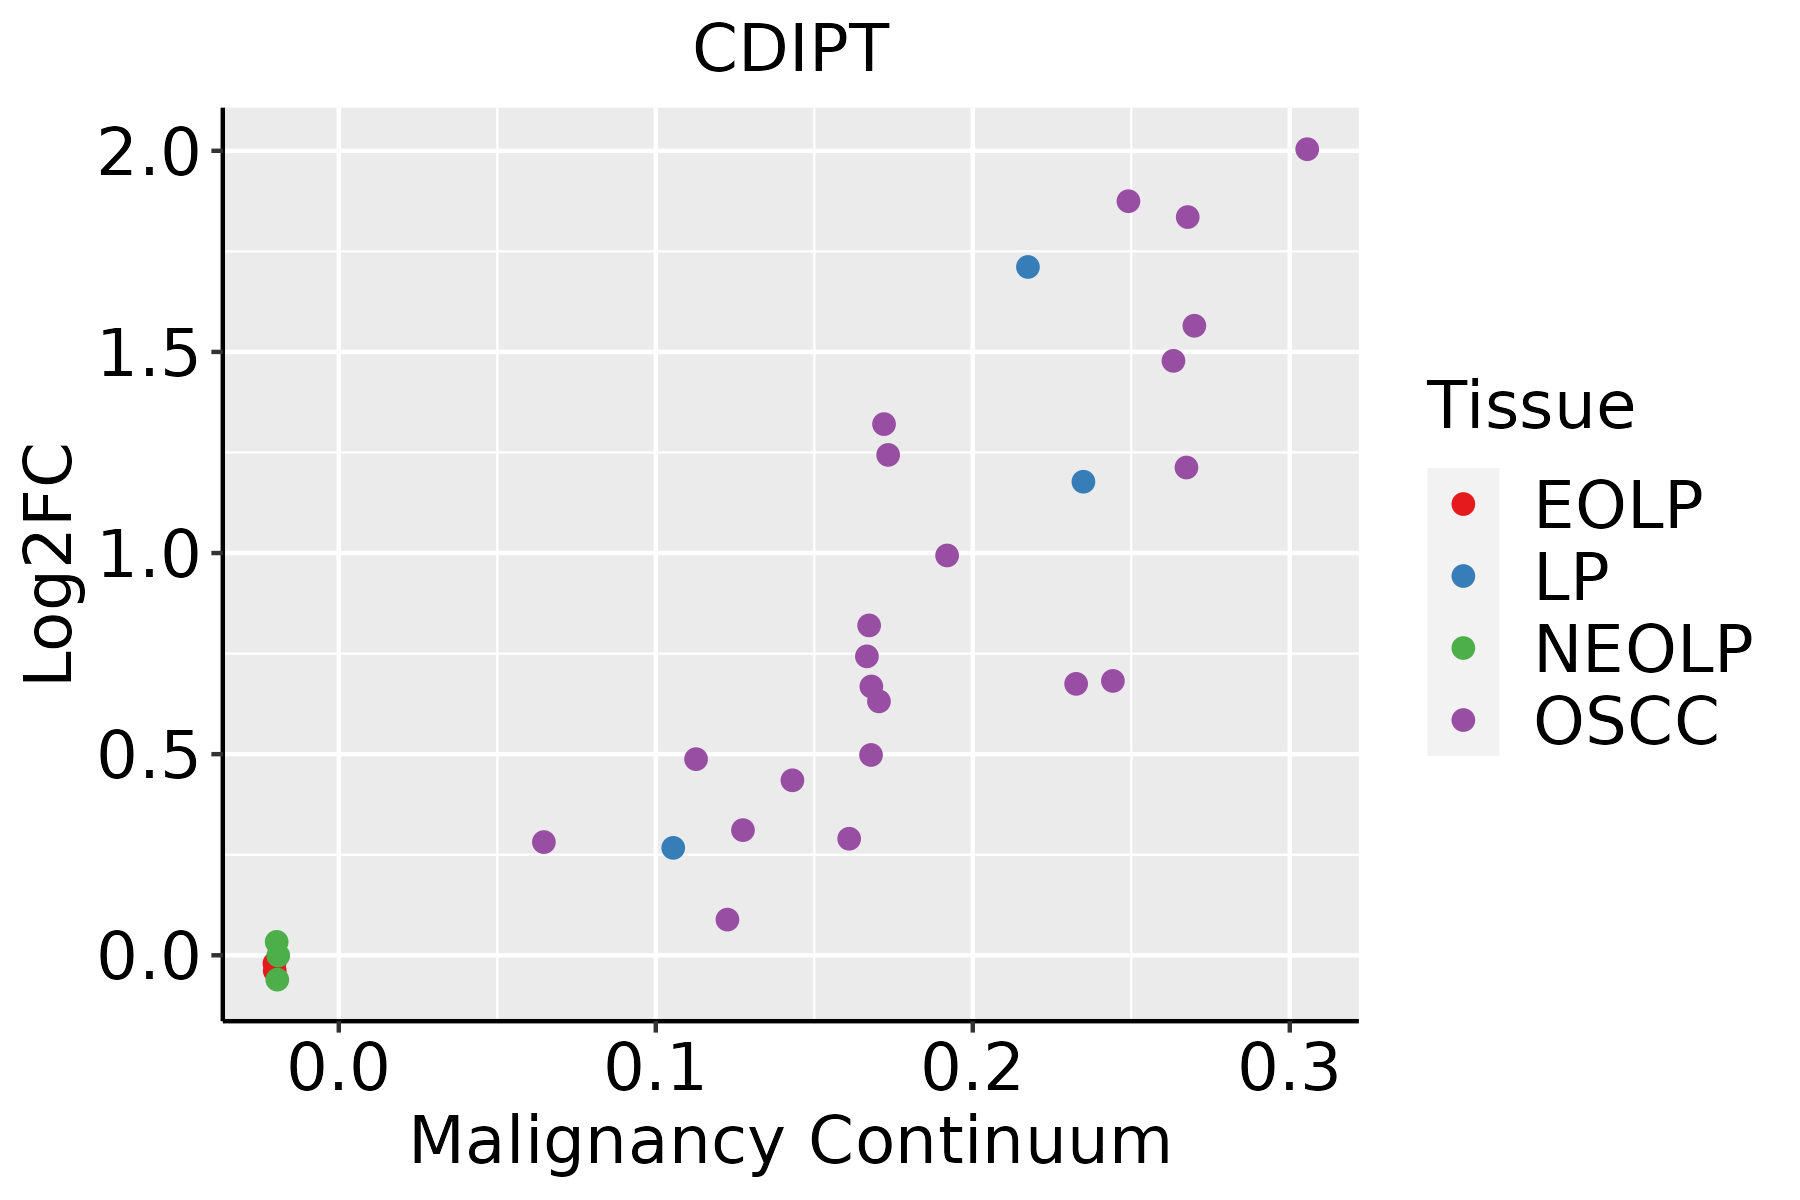 | EOLP: Erosive Oral lichen planus |
| LP: leukoplakia | ||
| NEOLP: Non-erosive oral lichen planus | ||
| OSCC: Oral squamous cell carcinoma | ||
| Skin | 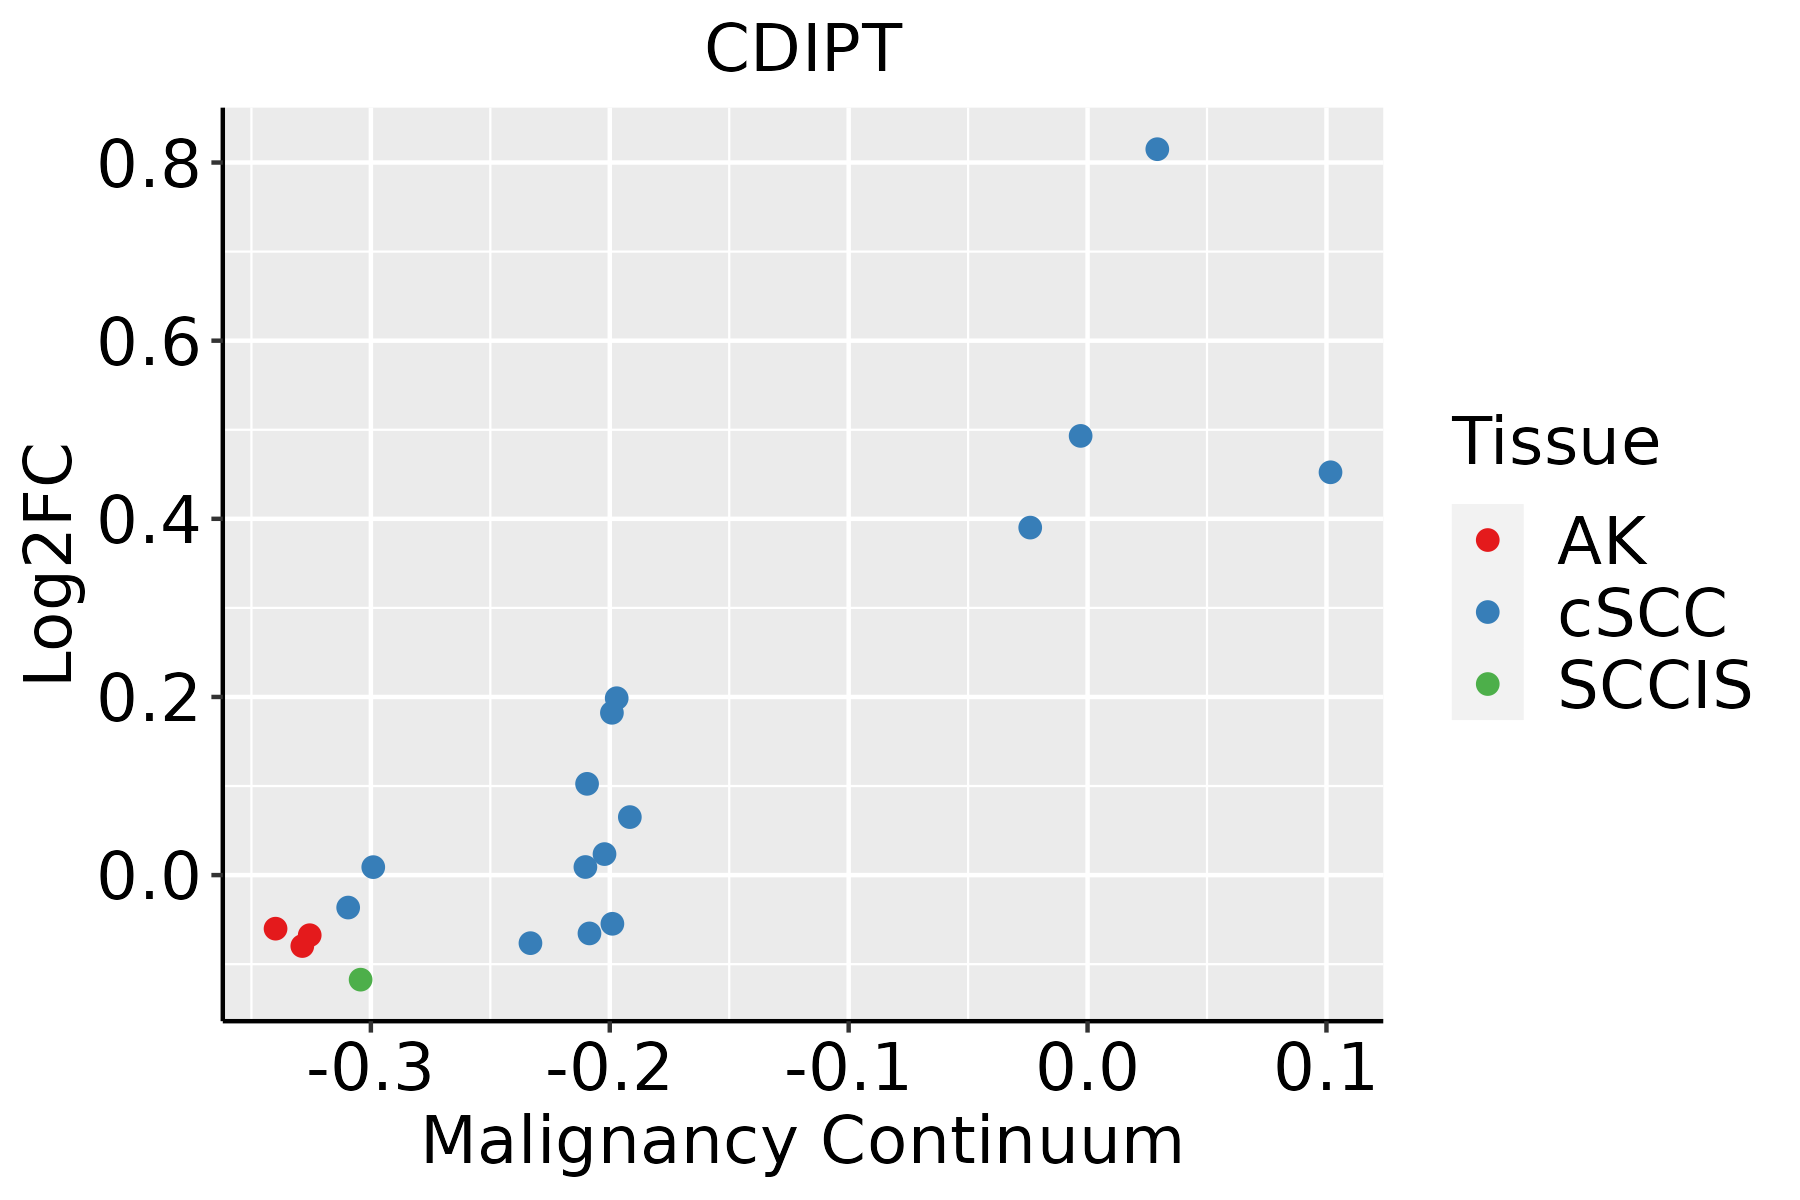 | AK: Actinic keratosis |
| cSCC: Cutaneous squamous cell carcinoma | ||
| SCCIS:squamous cell carcinoma in situ | ||
| Thyroid |  | ATC: Anaplastic thyroid cancer |
| HT: Hashimoto's thyroiditis | ||
| PTC: Papillary thyroid cancer |
| ∗log2FC in expression of this searched gene in stem-like cells from each diseased tissue sample relative to stem-like cells in normal samples in each tissue plotted against the malignancy continuum. Samples are colored based on if they are from different disease stage. |
Top |
Malignant transformation related pathway analysis |
| Find out the enriched GO biological processes and KEGG pathways involved in transition from healthy to precancer to cancer |
| Tissue | Disease Stage | Enriched GO biological Processes |
| Colorectum | AD |  |
| Colorectum | SER |  |
| Colorectum | MSS |  |
| Colorectum | MSI-H |  |
| Colorectum | FAP |  |
| ∗Top 15 enriched GO BP terms are showed in the bar plot of each disease state in each tissue. Each row represents a significant GO biological process which is colored according to the -log10(p.adjust). |
| Page: 1 2 3 4 5 6 7 8 9 |
| GO ID | Tissue | Disease Stage | Description | Gene Ratio | Bg Ratio | pvalue | p.adjust | Count |
| GO:0006650 | Colorectum | AD | glycerophospholipid metabolic process | 83/3918 | 306/18723 | 5.40e-03 | 3.55e-02 | 83 |
| GO:0006644 | Colorectum | AD | phospholipid metabolic process | 101/3918 | 383/18723 | 5.80e-03 | 3.67e-02 | 101 |
| GO:0045017 | Colorectum | AD | glycerolipid biosynthetic process | 69/3918 | 252/18723 | 8.33e-03 | 4.88e-02 | 69 |
| GO:0046486 | Colorectum | SER | glycerolipid metabolic process | 82/2897 | 392/18723 | 2.26e-03 | 2.17e-02 | 82 |
| GO:00066441 | Colorectum | SER | phospholipid metabolic process | 79/2897 | 383/18723 | 3.94e-03 | 3.24e-02 | 79 |
| GO:00450171 | Colorectum | SER | glycerolipid biosynthetic process | 55/2897 | 252/18723 | 4.47e-03 | 3.56e-02 | 55 |
| GO:00066501 | Colorectum | SER | glycerophospholipid metabolic process | 64/2897 | 306/18723 | 6.41e-03 | 4.60e-02 | 64 |
| GO:00086544 | Esophagus | ESCC | phospholipid biosynthetic process | 162/8552 | 253/18723 | 2.59e-09 | 5.73e-08 | 162 |
| GO:00464744 | Esophagus | ESCC | glycerophospholipid biosynthetic process | 135/8552 | 211/18723 | 5.75e-08 | 1.02e-06 | 135 |
| GO:00450175 | Esophagus | ESCC | glycerolipid biosynthetic process | 154/8552 | 252/18723 | 5.20e-07 | 6.96e-06 | 154 |
| GO:00066446 | Esophagus | ESCC | phospholipid metabolic process | 218/8552 | 383/18723 | 5.37e-06 | 5.59e-05 | 218 |
| GO:00066505 | Esophagus | ESCC | glycerophospholipid metabolic process | 174/8552 | 306/18723 | 4.92e-05 | 3.85e-04 | 174 |
| GO:00464864 | Esophagus | ESCC | glycerolipid metabolic process | 211/8552 | 392/18723 | 6.51e-04 | 3.46e-03 | 211 |
| GO:00463411 | Esophagus | ESCC | CDP-diacylglycerol metabolic process | 11/8552 | 14/18723 | 1.30e-02 | 4.27e-02 | 11 |
| GO:00066611 | Esophagus | ESCC | phosphatidylinositol biosynthetic process | 73/8552 | 131/18723 | 1.31e-02 | 4.28e-02 | 73 |
| GO:00086542 | Liver | HCC | phospholipid biosynthetic process | 150/7958 | 253/18723 | 4.77e-08 | 1.03e-06 | 150 |
| GO:00066444 | Liver | HCC | phospholipid metabolic process | 214/7958 | 383/18723 | 7.25e-08 | 1.48e-06 | 214 |
| GO:004648611 | Liver | HCC | glycerolipid metabolic process | 215/7958 | 392/18723 | 4.54e-07 | 7.49e-06 | 215 |
| GO:004501711 | Liver | HCC | glycerolipid biosynthetic process | 143/7958 | 252/18723 | 3.27e-06 | 4.31e-05 | 143 |
| GO:00066504 | Liver | HCC | glycerophospholipid metabolic process | 168/7958 | 306/18723 | 7.27e-06 | 8.62e-05 | 168 |
| Page: 1 2 |
| Pathway ID | Tissue | Disease Stage | Description | Gene Ratio | Bg Ratio | pvalue | p.adjust | qvalue | Count |
| Page: 1 |
Top |
Cell-cell communication analysis |
| Identification of potential cell-cell interactions between two cell types and their ligand-receptor pairs for different disease states |
| Ligand | Receptor | LRpair | Pathway | Tissue | Disease Stage |
| Page: 1 |
Top |
Single-cell gene regulatory network inference analysis |
| Find out the significant the regulons (TFs) and the target genes of each regulon across cell types for different disease states |
| TF | Cell Type | Tissue | Disease Stage | Target Gene | RSS | Regulon Activity |
| ∗The dot plots of a searched regulon are shown for all cell subpopulations in each disease state of each tissue based on the regulon specific score inferred using pySCENIC and by calculating the average expression. |
| Page: 1 |
Top |
Somatic mutation of malignant transformation related genes |
| Annotation of somatic variants for genes involved in malignant transformation |
| Hugo Symbol | Variant Class | Variant Classification | dbSNP RS | HGVSc | HGVSp | HGVSp Short | SWISSPROT | BIOTYPE | SIFT | PolyPhen | Tumor Sample Barcode | Tissue | Histology | Sex | Age | Stage | Therapy Types | Drugs | Outcome |
| CDIPT | SNV | Missense_Mutation | rs375184092 | c.394N>T | p.Arg132Trp | p.R132W | O14735 | protein_coding | deleterious(0) | probably_damaging(0.918) | TCGA-AZ-4315-01 | Colorectum | colon adenocarcinoma | Male | <65 | I/II | Unknown | Unknown | SD |
| CDIPT | insertion | Frame_Shift_Ins | novel | c.475_476insC | p.His159ProfsTer4 | p.H159Pfs*4 | O14735 | protein_coding | TCGA-BM-6198-01 | Colorectum | rectum adenocarcinoma | Male | >=65 | III/IV | Chemotherapy | xeloda | SD | ||
| CDIPT | SNV | Missense_Mutation | novel | c.524G>A | p.Gly175Asp | p.G175D | O14735 | protein_coding | tolerated(0.09) | benign(0.242) | TCGA-A5-A2K7-01 | Endometrium | uterine corpus endometrioid carcinoma | Female | <65 | I/II | Chemotherapy | taxol | SD |
| CDIPT | SNV | Missense_Mutation | novel | c.590N>T | p.Ala197Val | p.A197V | O14735 | protein_coding | deleterious(0) | probably_damaging(0.968) | TCGA-AX-A1CE-01 | Endometrium | uterine corpus endometrioid carcinoma | Female | <65 | I/II | Unspecific | Paclitaxel | SD |
| CDIPT | SNV | Missense_Mutation | novel | c.296N>A | p.Ser99Asn | p.S99N | O14735 | protein_coding | tolerated(0.06) | possibly_damaging(0.588) | TCGA-AX-A2HD-01 | Endometrium | uterine corpus endometrioid carcinoma | Female | >=65 | III/IV | Unknown | Unknown | SD |
| CDIPT | SNV | Missense_Mutation | novel | c.65N>T | p.Ala22Val | p.A22V | O14735 | protein_coding | deleterious(0.01) | possibly_damaging(0.549) | TCGA-B5-A3FC-01 | Endometrium | uterine corpus endometrioid carcinoma | Female | <65 | I/II | Unknown | Unknown | SD |
| CDIPT | SNV | Missense_Mutation | novel | c.371N>G | p.Asp124Gly | p.D124G | O14735 | protein_coding | tolerated(0.15) | benign(0.02) | TCGA-BG-A222-01 | Endometrium | uterine corpus endometrioid carcinoma | Female | <65 | I/II | Unknown | Unknown | SD |
| CDIPT | SNV | Missense_Mutation | c.379G>T | p.Gly127Trp | p.G127W | O14735 | protein_coding | deleterious(0) | probably_damaging(0.967) | TCGA-BS-A0TA-01 | Endometrium | uterine corpus endometrioid carcinoma | Female | <65 | III/IV | Chemotherapy | taxol | PD | |
| CDIPT | SNV | Missense_Mutation | rs752466033 | c.206T>C | p.Met69Thr | p.M69T | O14735 | protein_coding | deleterious(0.02) | probably_damaging(0.978) | TCGA-DI-A1BU-01 | Endometrium | uterine corpus endometrioid carcinoma | Female | <65 | I/II | Chemotherapy | paclitaxel | SD |
| CDIPT | SNV | Missense_Mutation | novel | c.74N>A | p.Ser25Tyr | p.S25Y | O14735 | protein_coding | deleterious(0) | probably_damaging(0.912) | TCGA-E6-A1LX-01 | Endometrium | uterine corpus endometrioid carcinoma | Female | <65 | I/II | Unknown | Unknown | SD |
| Page: 1 2 |
Top |
Related drugs of malignant transformation related genes |
| Identification of chemicals and drugs interact with genes involved in malignant transfromation |
| (DGIdb 4.0) |
| Entrez ID | Symbol | Category | Interaction Types | Drug Claim Name | Drug Name | PMIDs |
| Page: 1 |

Copyright 2023-Present -The University of Texas Health Science Center at Houston |