
|
|||||
|
 | |
| |
| |
| |
| |
| |
|
Gene: CDIP1 |
Gene summary for CDIP1 |
| Gene information | Species | Human | Gene symbol | CDIP1 | Gene ID | 29965 |
| Gene name | cell death inducing p53 target 1 | |
| Gene Alias | C16orf5 | |
| Cytomap | 16p13.3 | |
| Gene Type | protein-coding | GO ID | GO:0006915 | UniProtAcc | Q9H305 |
Top |
Malignant transformation analysis |
| Identification of the aberrant gene expression in precancerous and cancerous lesions by comparing the gene expression of stem-like cells in diseased tissues with normal stem cells |
| Entrez ID | Symbol | Replicates | Species | Organ | Tissue | Adj P-value | Log2FC | Malignancy |
| 29965 | CDIP1 | LZE4T | Human | Esophagus | ESCC | 1.23e-02 | -5.31e-02 | 0.0811 |
| 29965 | CDIP1 | LZE7T | Human | Esophagus | ESCC | 1.34e-04 | 1.13e-01 | 0.0667 |
| 29965 | CDIP1 | LZE8T | Human | Esophagus | ESCC | 1.94e-05 | -1.56e-02 | 0.067 |
| 29965 | CDIP1 | LZE24T | Human | Esophagus | ESCC | 1.45e-06 | 4.08e-02 | 0.0596 |
| 29965 | CDIP1 | P2T-E | Human | Esophagus | ESCC | 8.97e-27 | 6.81e-01 | 0.1177 |
| 29965 | CDIP1 | P4T-E | Human | Esophagus | ESCC | 1.14e-05 | -1.52e-02 | 0.1323 |
| 29965 | CDIP1 | P5T-E | Human | Esophagus | ESCC | 4.41e-07 | -1.11e-02 | 0.1327 |
| 29965 | CDIP1 | P8T-E | Human | Esophagus | ESCC | 2.79e-10 | -1.08e-01 | 0.0889 |
| 29965 | CDIP1 | P9T-E | Human | Esophagus | ESCC | 2.28e-06 | -7.64e-02 | 0.1131 |
| 29965 | CDIP1 | P10T-E | Human | Esophagus | ESCC | 3.34e-16 | 2.81e-03 | 0.116 |
| 29965 | CDIP1 | P11T-E | Human | Esophagus | ESCC | 2.40e-08 | 2.10e-01 | 0.1426 |
| 29965 | CDIP1 | P12T-E | Human | Esophagus | ESCC | 8.42e-23 | 5.57e-01 | 0.1122 |
| 29965 | CDIP1 | P15T-E | Human | Esophagus | ESCC | 1.05e-12 | 1.61e-01 | 0.1149 |
| 29965 | CDIP1 | P16T-E | Human | Esophagus | ESCC | 5.25e-17 | 1.25e-01 | 0.1153 |
| 29965 | CDIP1 | P17T-E | Human | Esophagus | ESCC | 7.02e-03 | 2.78e-01 | 0.1278 |
| 29965 | CDIP1 | P20T-E | Human | Esophagus | ESCC | 1.80e-11 | 1.31e-01 | 0.1124 |
| 29965 | CDIP1 | P21T-E | Human | Esophagus | ESCC | 1.47e-16 | 1.83e-01 | 0.1617 |
| 29965 | CDIP1 | P22T-E | Human | Esophagus | ESCC | 1.47e-17 | 1.88e-01 | 0.1236 |
| 29965 | CDIP1 | P23T-E | Human | Esophagus | ESCC | 1.52e-11 | 2.08e-01 | 0.108 |
| 29965 | CDIP1 | P24T-E | Human | Esophagus | ESCC | 7.51e-08 | -7.22e-02 | 0.1287 |
| Page: 1 2 3 4 |
| Tissue | Expression Dynamics | Abbreviation |
| Esophagus | 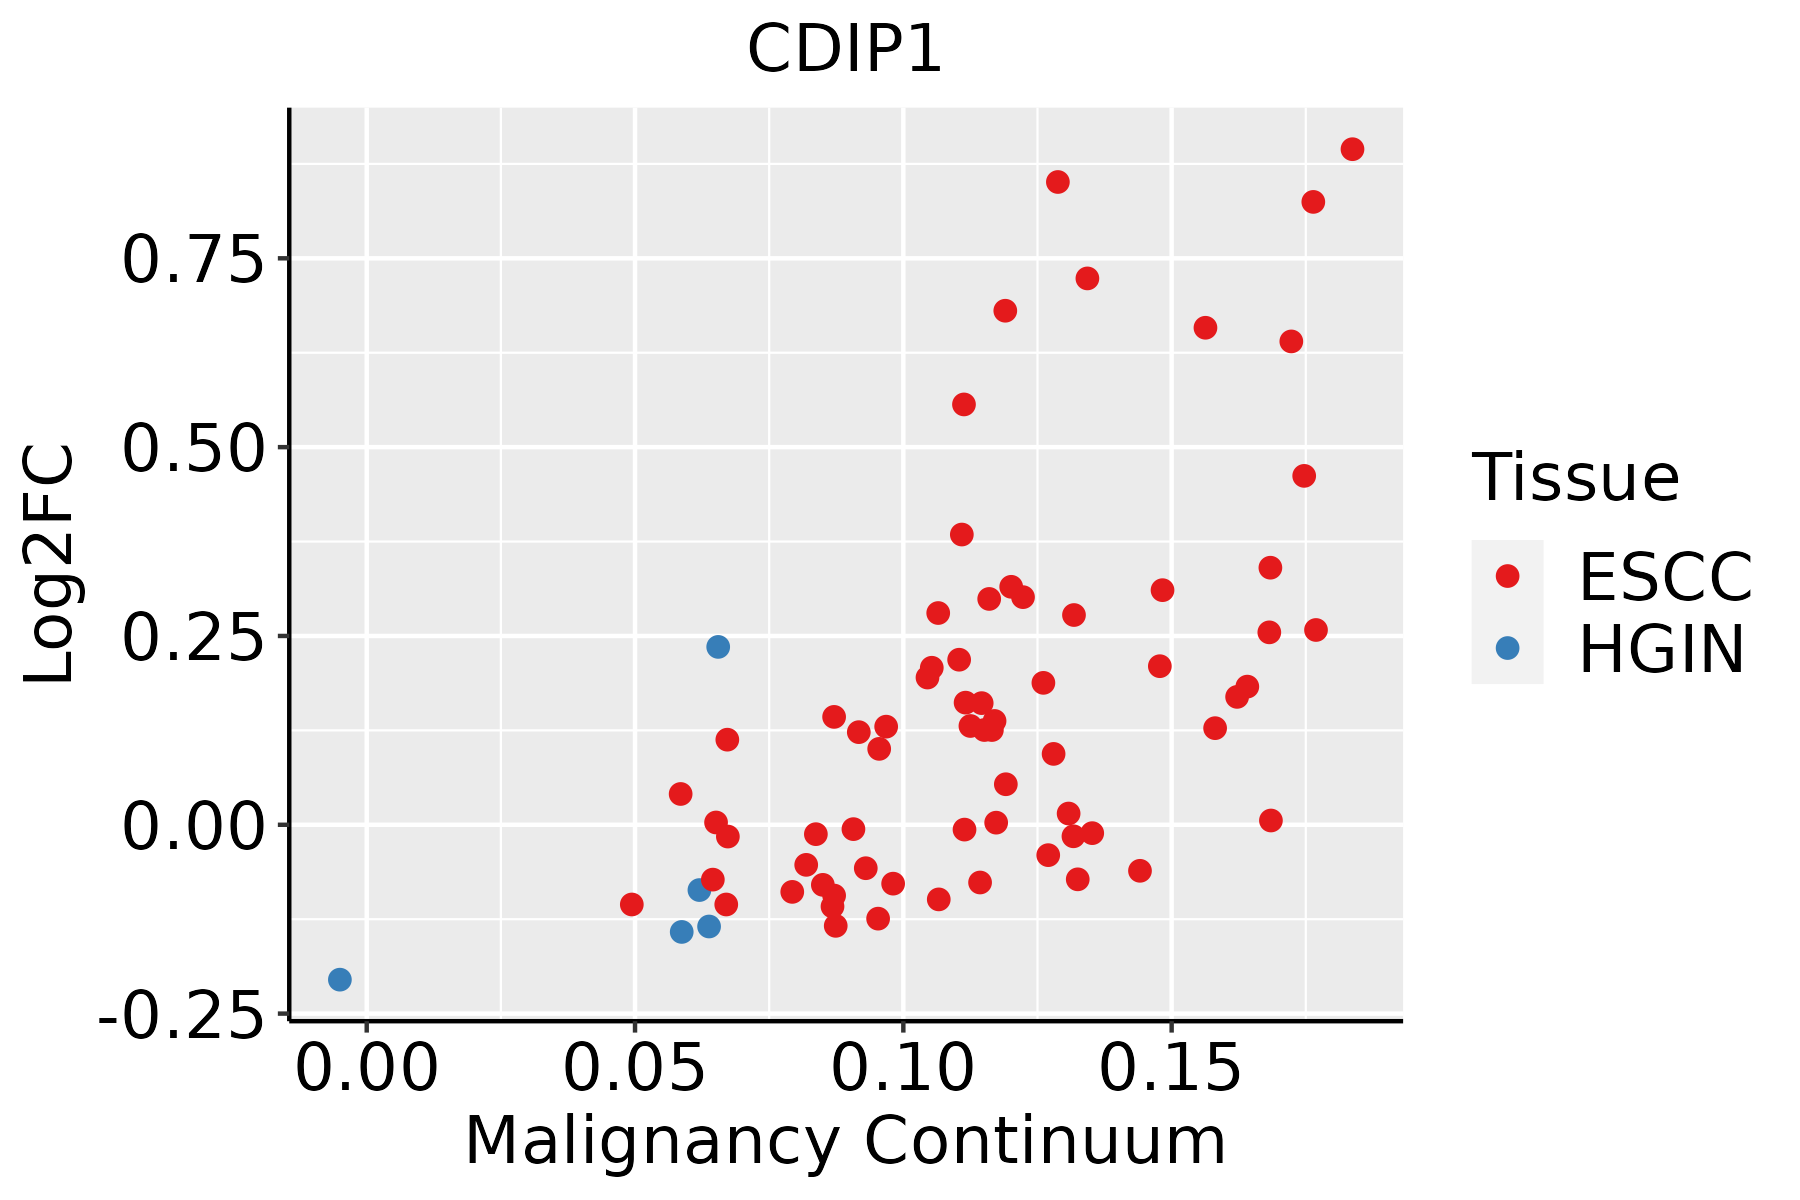 | ESCC: Esophageal squamous cell carcinoma |
| HGIN: High-grade intraepithelial neoplasias | ||
| LGIN: Low-grade intraepithelial neoplasias | ||
| Liver | 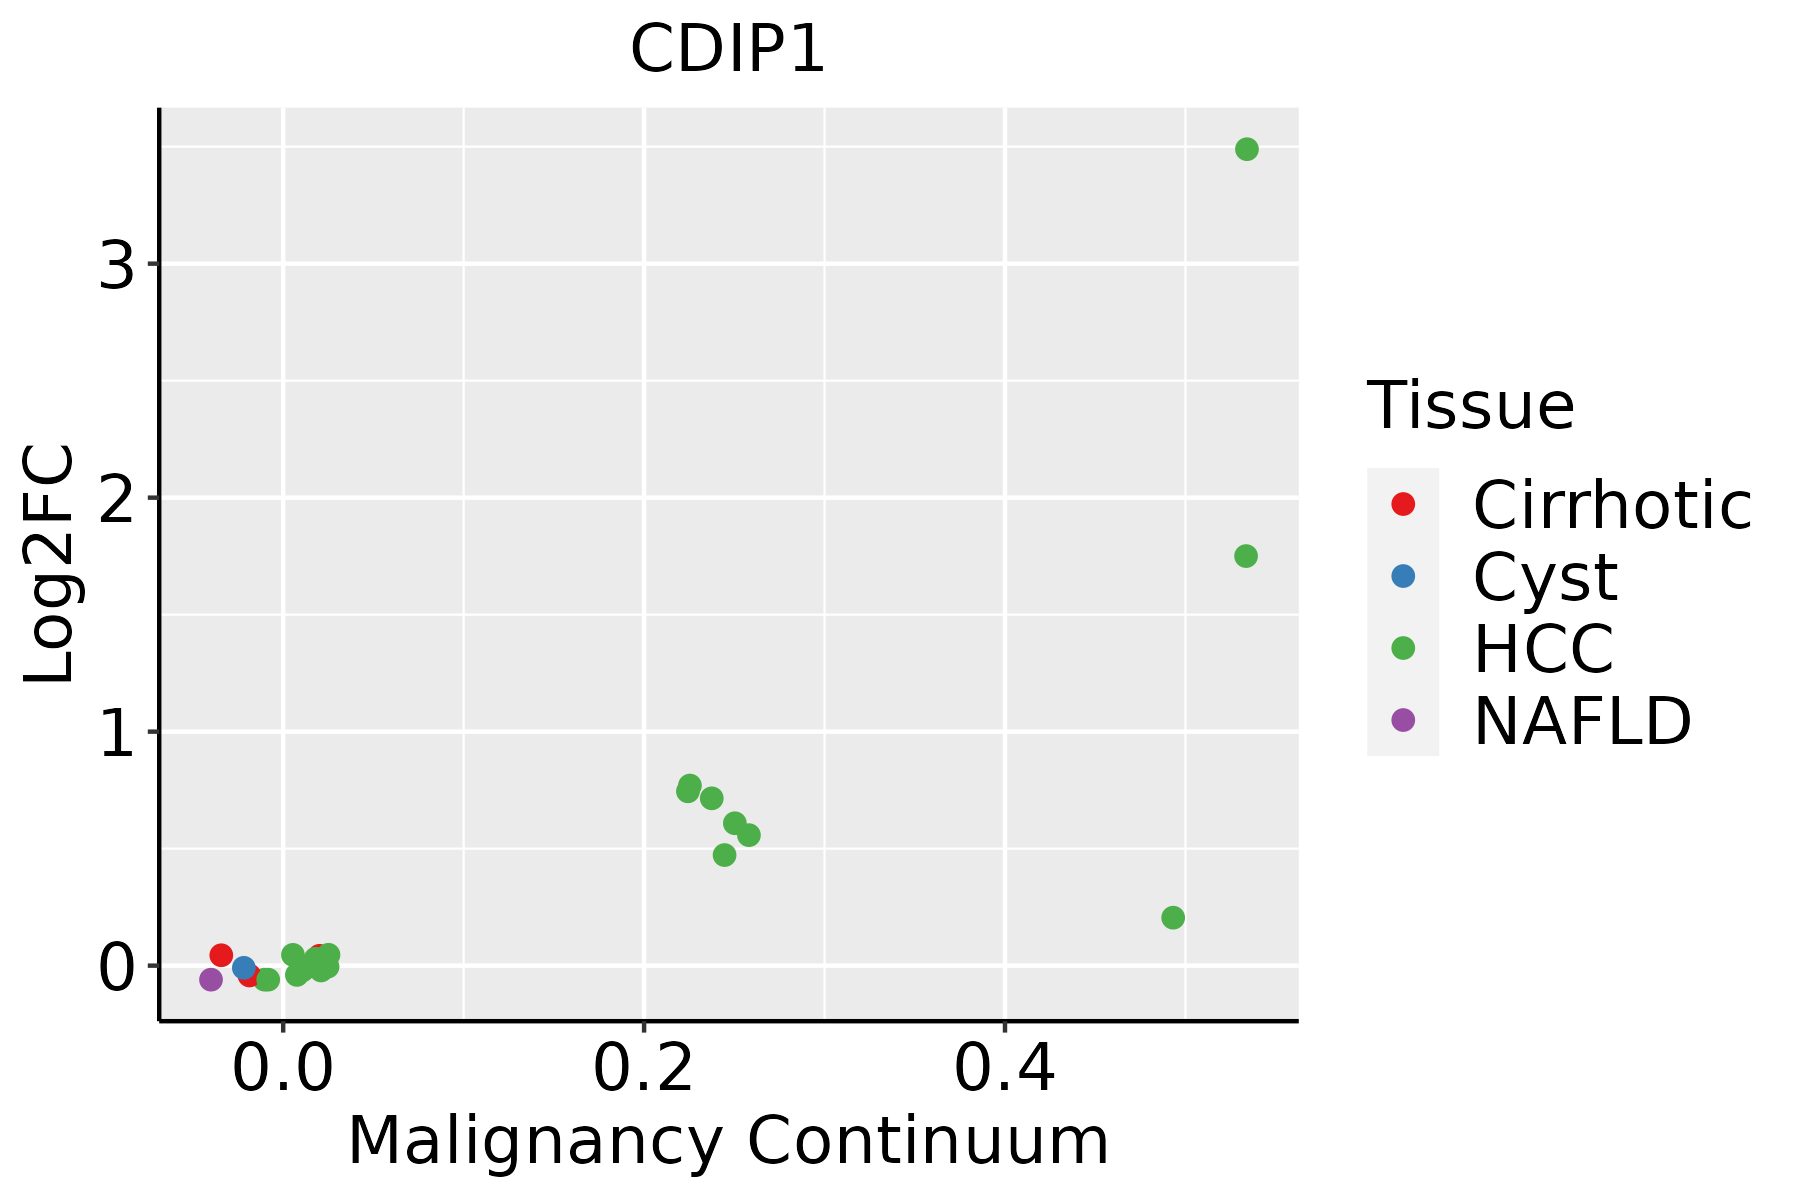 | HCC: Hepatocellular carcinoma |
| NAFLD: Non-alcoholic fatty liver disease | ||
| Oral Cavity |  | EOLP: Erosive Oral lichen planus |
| LP: leukoplakia | ||
| NEOLP: Non-erosive oral lichen planus | ||
| OSCC: Oral squamous cell carcinoma |
| ∗log2FC in expression of this searched gene in stem-like cells from each diseased tissue sample relative to stem-like cells in normal samples in each tissue plotted against the malignancy continuum. Samples are colored based on if they are from different disease stage. |
Top |
Malignant transformation related pathway analysis |
| Find out the enriched GO biological processes and KEGG pathways involved in transition from healthy to precancer to cancer |
| Tissue | Disease Stage | Enriched GO biological Processes |
| Colorectum | AD |  |
| Colorectum | SER |  |
| Colorectum | MSS |  |
| Colorectum | MSI-H |  |
| Colorectum | FAP |  |
| ∗Top 15 enriched GO BP terms are showed in the bar plot of each disease state in each tissue. Each row represents a significant GO biological process which is colored according to the -log10(p.adjust). |
| Page: 1 2 3 4 5 6 7 8 9 |
| GO ID | Tissue | Disease Stage | Description | Gene Ratio | Bg Ratio | pvalue | p.adjust | Count |
| GO:0097193111 | Esophagus | ESCC | intrinsic apoptotic signaling pathway | 222/8552 | 288/18723 | 5.87e-28 | 2.02e-25 | 222 |
| GO:0072331111 | Esophagus | ESCC | signal transduction by p53 class mediator | 121/8552 | 163/18723 | 9.61e-14 | 4.69e-12 | 121 |
| GO:0008630110 | Esophagus | ESCC | intrinsic apoptotic signaling pathway in response to DNA damage | 78/8552 | 99/18723 | 1.43e-11 | 5.08e-10 | 78 |
| GO:0042771110 | Esophagus | ESCC | intrinsic apoptotic signaling pathway in response to DNA damage by p53 class mediator | 38/8552 | 43/18723 | 5.75e-09 | 1.18e-07 | 38 |
| GO:0072332111 | Esophagus | ESCC | intrinsic apoptotic signaling pathway by p53 class mediator | 59/8552 | 76/18723 | 1.22e-08 | 2.42e-07 | 59 |
| GO:003320914 | Esophagus | ESCC | tumor necrosis factor-mediated signaling pathway | 67/8552 | 99/18723 | 7.87e-06 | 7.72e-05 | 67 |
| GO:003461220 | Esophagus | ESCC | response to tumor necrosis factor | 149/8552 | 253/18723 | 1.47e-05 | 1.33e-04 | 149 |
| GO:007135620 | Esophagus | ESCC | cellular response to tumor necrosis factor | 132/8552 | 229/18723 | 1.69e-04 | 1.11e-03 | 132 |
| GO:009719322 | Liver | HCC | intrinsic apoptotic signaling pathway | 184/7958 | 288/18723 | 1.50e-13 | 8.32e-12 | 184 |
| GO:007233122 | Liver | HCC | signal transduction by p53 class mediator | 108/7958 | 163/18723 | 7.14e-10 | 2.23e-08 | 108 |
| GO:007233212 | Liver | HCC | intrinsic apoptotic signaling pathway by p53 class mediator | 51/7958 | 76/18723 | 1.27e-05 | 1.42e-04 | 51 |
| GO:000863011 | Liver | HCC | intrinsic apoptotic signaling pathway in response to DNA damage | 58/7958 | 99/18723 | 8.97e-04 | 5.29e-03 | 58 |
| GO:003461211 | Liver | HCC | response to tumor necrosis factor | 132/7958 | 253/18723 | 1.14e-03 | 6.48e-03 | 132 |
| GO:004277111 | Liver | HCC | intrinsic apoptotic signaling pathway in response to DNA damage by p53 class mediator | 28/7958 | 43/18723 | 2.30e-03 | 1.14e-02 | 28 |
| GO:007135611 | Liver | HCC | cellular response to tumor necrosis factor | 115/7958 | 229/18723 | 1.08e-02 | 3.99e-02 | 115 |
| GO:009719320 | Oral cavity | OSCC | intrinsic apoptotic signaling pathway | 202/7305 | 288/18723 | 4.64e-27 | 1.73e-24 | 202 |
| GO:007233120 | Oral cavity | OSCC | signal transduction by p53 class mediator | 107/7305 | 163/18723 | 4.75e-12 | 1.83e-10 | 107 |
| GO:000863018 | Oral cavity | OSCC | intrinsic apoptotic signaling pathway in response to DNA damage | 72/7305 | 99/18723 | 9.50e-12 | 3.50e-10 | 72 |
| GO:007233219 | Oral cavity | OSCC | intrinsic apoptotic signaling pathway by p53 class mediator | 56/7305 | 76/18723 | 8.43e-10 | 2.13e-08 | 56 |
| GO:004277118 | Oral cavity | OSCC | intrinsic apoptotic signaling pathway in response to DNA damage by p53 class mediator | 36/7305 | 43/18723 | 2.12e-09 | 4.97e-08 | 36 |
| Page: 1 2 |
| Pathway ID | Tissue | Disease Stage | Description | Gene Ratio | Bg Ratio | pvalue | p.adjust | qvalue | Count |
| Page: 1 |
Top |
Cell-cell communication analysis |
| Identification of potential cell-cell interactions between two cell types and their ligand-receptor pairs for different disease states |
| Ligand | Receptor | LRpair | Pathway | Tissue | Disease Stage |
| Page: 1 |
Top |
Single-cell gene regulatory network inference analysis |
| Find out the significant the regulons (TFs) and the target genes of each regulon across cell types for different disease states |
| TF | Cell Type | Tissue | Disease Stage | Target Gene | RSS | Regulon Activity |
| ∗The dot plots of a searched regulon are shown for all cell subpopulations in each disease state of each tissue based on the regulon specific score inferred using pySCENIC and by calculating the average expression. |
| Page: 1 |
Top |
Somatic mutation of malignant transformation related genes |
| Annotation of somatic variants for genes involved in malignant transformation |
| Hugo Symbol | Variant Class | Variant Classification | dbSNP RS | HGVSc | HGVSp | HGVSp Short | SWISSPROT | BIOTYPE | SIFT | PolyPhen | Tumor Sample Barcode | Tissue | Histology | Sex | Age | Stage | Therapy Types | Drugs | Outcome |
| CDIP1 | SNV | Missense_Mutation | c.137N>G | p.Pro46Arg | p.P46R | Q9H305 | protein_coding | deleterious(0) | probably_damaging(0.994) | TCGA-E2-A1IN-01 | Breast | breast invasive carcinoma | Female | <65 | I/II | Hormone Therapy | arimidex | SD | |
| CDIP1 | SNV | Missense_Mutation | c.226A>T | p.Thr76Ser | p.T76S | Q9H305 | protein_coding | tolerated(0.96) | benign(0) | TCGA-CK-4951-01 | Colorectum | colon adenocarcinoma | Female | >=65 | I/II | Unknown | Unknown | PD | |
| CDIP1 | SNV | Missense_Mutation | novel | c.304N>A | p.Pro102Thr | p.P102T | Q9H305 | protein_coding | tolerated(0.22) | benign(0) | TCGA-A5-A0G1-01 | Endometrium | uterine corpus endometrioid carcinoma | Female | >=65 | I/II | Unknown | Unknown | SD |
| CDIP1 | SNV | Missense_Mutation | novel | c.127N>T | p.Pro43Ser | p.P43S | Q9H305 | protein_coding | tolerated(0.16) | benign(0) | TCGA-A5-A1OF-01 | Endometrium | uterine corpus endometrioid carcinoma | Female | <65 | I/II | Unknown | Unknown | SD |
| CDIP1 | SNV | Missense_Mutation | novel | c.593A>G | p.Lys198Arg | p.K198R | Q9H305 | protein_coding | tolerated(0.19) | probably_damaging(0.992) | TCGA-BS-A0UF-01 | Endometrium | uterine corpus endometrioid carcinoma | Female | >=65 | I/II | Unknown | Unknown | SD |
| CDIP1 | insertion | Frame_Shift_Ins | novel | c.137dupC | p.Ala47CysfsTer9 | p.A47Cfs*9 | Q9H305 | protein_coding | TCGA-DF-A2KY-01 | Endometrium | uterine corpus endometrioid carcinoma | Female | <65 | III/IV | Chemotherapy | carboplatin | SD | ||
| CDIP1 | SNV | Missense_Mutation | c.290C>T | p.Pro97Leu | p.P97L | Q9H305 | protein_coding | tolerated(0.05) | benign(0.055) | TCGA-P3-A5QE-01 | Oral cavity | head & neck squamous cell carcinoma | Male | <65 | III/IV | Unknown | Unknown | SD | |
| CDIP1 | SNV | Missense_Mutation | novel | c.584C>A | p.Pro195His | p.P195H | Q9H305 | protein_coding | deleterious(0) | probably_damaging(0.999) | TCGA-EM-A2CK-01 | Thyroid | thyroid carcinoma | Male | <65 | I/II | Unknown | Unknown | SD |
| Page: 1 |
Top |
Related drugs of malignant transformation related genes |
| Identification of chemicals and drugs interact with genes involved in malignant transfromation |
| (DGIdb 4.0) |
| Entrez ID | Symbol | Category | Interaction Types | Drug Claim Name | Drug Name | PMIDs |
| Page: 1 |

Copyright 2023-Present -The University of Texas Health Science Center at Houston |