
|
|||||
|
 | |
| |
| |
| |
| |
| |
|
Gene: CDHR3 |
Gene summary for CDHR3 |
| Gene information | Species | Human | Gene symbol | CDHR3 | Gene ID | 222256 |
| Gene name | cadherin related family member 3 | |
| Gene Alias | CDH28 | |
| Cytomap | 7q22.3 | |
| Gene Type | protein-coding | GO ID | GO:0000902 | UniProtAcc | B7Z8X2 |
Top |
Malignant transformation analysis |
| Identification of the aberrant gene expression in precancerous and cancerous lesions by comparing the gene expression of stem-like cells in diseased tissues with normal stem cells |
| Entrez ID | Symbol | Replicates | Species | Organ | Tissue | Adj P-value | Log2FC | Malignancy |
| 222256 | CDHR3 | HTA11_3410_2000001011 | Human | Colorectum | AD | 9.34e-04 | -3.98e-01 | 0.0155 |
| 222256 | CDHR3 | HTA11_347_2000001011 | Human | Colorectum | AD | 7.61e-03 | 2.90e-01 | -0.1954 |
| 222256 | CDHR3 | HTA11_99999970781_79442 | Human | Colorectum | MSS | 2.04e-13 | -4.87e-01 | 0.294 |
| 222256 | CDHR3 | HTA11_99999965104_69814 | Human | Colorectum | MSS | 4.25e-03 | 4.51e-01 | 0.281 |
| 222256 | CDHR3 | HTA11_99999974143_84620 | Human | Colorectum | MSS | 3.20e-07 | -3.70e-01 | 0.3005 |
| 222256 | CDHR3 | A001-C-207 | Human | Colorectum | FAP | 4.32e-04 | -3.94e-01 | 0.1278 |
| 222256 | CDHR3 | A015-C-203 | Human | Colorectum | FAP | 7.64e-25 | -4.93e-01 | -0.1294 |
| 222256 | CDHR3 | A015-C-204 | Human | Colorectum | FAP | 7.45e-03 | -3.40e-01 | -0.0228 |
| 222256 | CDHR3 | A002-C-201 | Human | Colorectum | FAP | 7.71e-08 | -3.91e-01 | 0.0324 |
| 222256 | CDHR3 | A001-C-119 | Human | Colorectum | FAP | 6.03e-05 | -4.83e-01 | -0.1557 |
| 222256 | CDHR3 | A001-C-108 | Human | Colorectum | FAP | 2.34e-17 | -4.24e-01 | -0.0272 |
| 222256 | CDHR3 | A002-C-205 | Human | Colorectum | FAP | 3.98e-13 | -4.35e-01 | -0.1236 |
| 222256 | CDHR3 | A001-C-104 | Human | Colorectum | FAP | 8.71e-06 | -3.88e-01 | 0.0184 |
| 222256 | CDHR3 | A015-C-006 | Human | Colorectum | FAP | 2.88e-08 | -4.68e-01 | -0.0994 |
| 222256 | CDHR3 | A015-C-106 | Human | Colorectum | FAP | 5.16e-11 | -3.83e-01 | -0.0511 |
| 222256 | CDHR3 | A002-C-114 | Human | Colorectum | FAP | 6.28e-10 | -4.21e-01 | -0.1561 |
| 222256 | CDHR3 | A015-C-104 | Human | Colorectum | FAP | 1.31e-24 | -5.05e-01 | -0.1899 |
| 222256 | CDHR3 | A001-C-014 | Human | Colorectum | FAP | 6.18e-11 | -4.14e-01 | 0.0135 |
| 222256 | CDHR3 | A002-C-016 | Human | Colorectum | FAP | 8.60e-16 | -3.94e-01 | 0.0521 |
| 222256 | CDHR3 | A015-C-002 | Human | Colorectum | FAP | 7.91e-08 | -5.16e-01 | -0.0763 |
| Page: 1 2 3 4 |
| Tissue | Expression Dynamics | Abbreviation |
| Colorectum (GSE201348) |  | FAP: Familial adenomatous polyposis |
| CRC: Colorectal cancer | ||
| Colorectum (HTA11) | 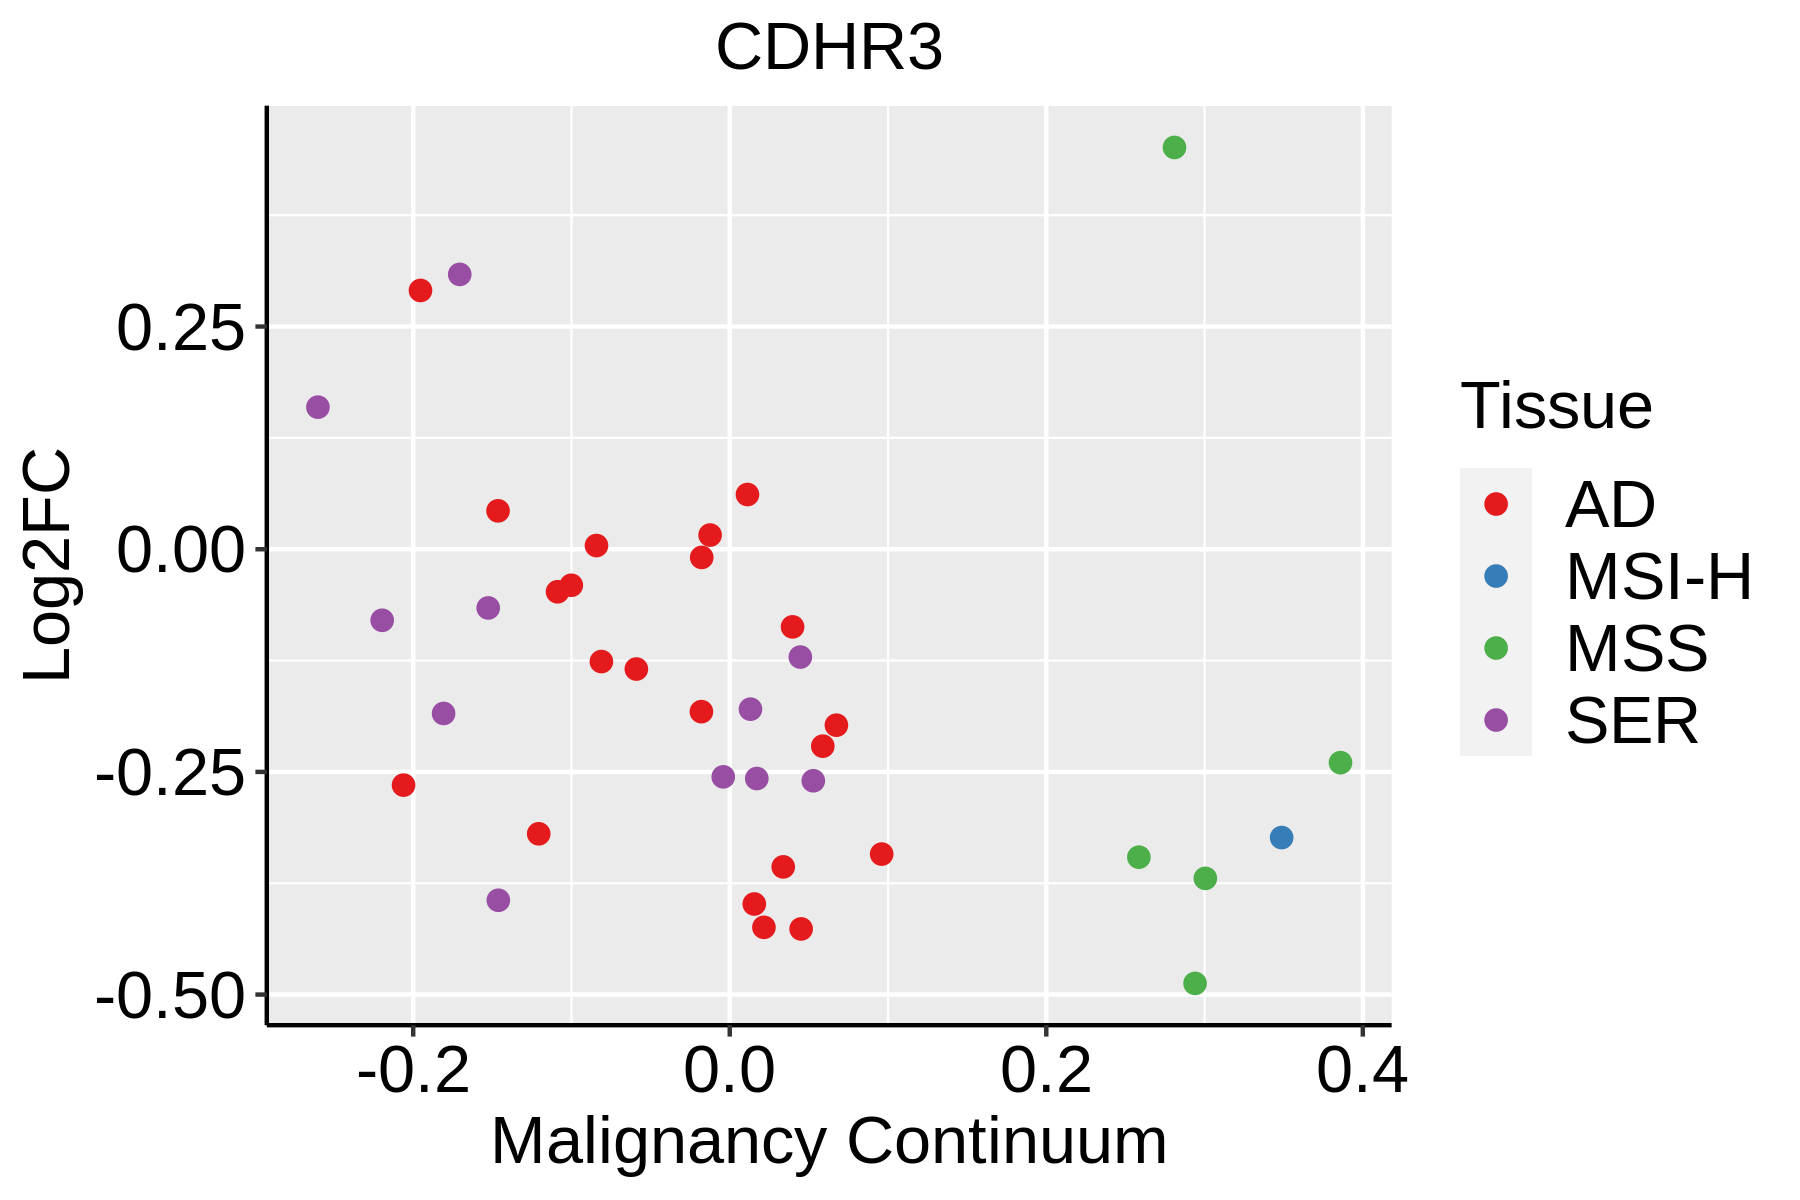 | AD: Adenomas |
| SER: Sessile serrated lesions | ||
| MSI-H: Microsatellite-high colorectal cancer | ||
| MSS: Microsatellite stable colorectal cancer | ||
| Esophagus | 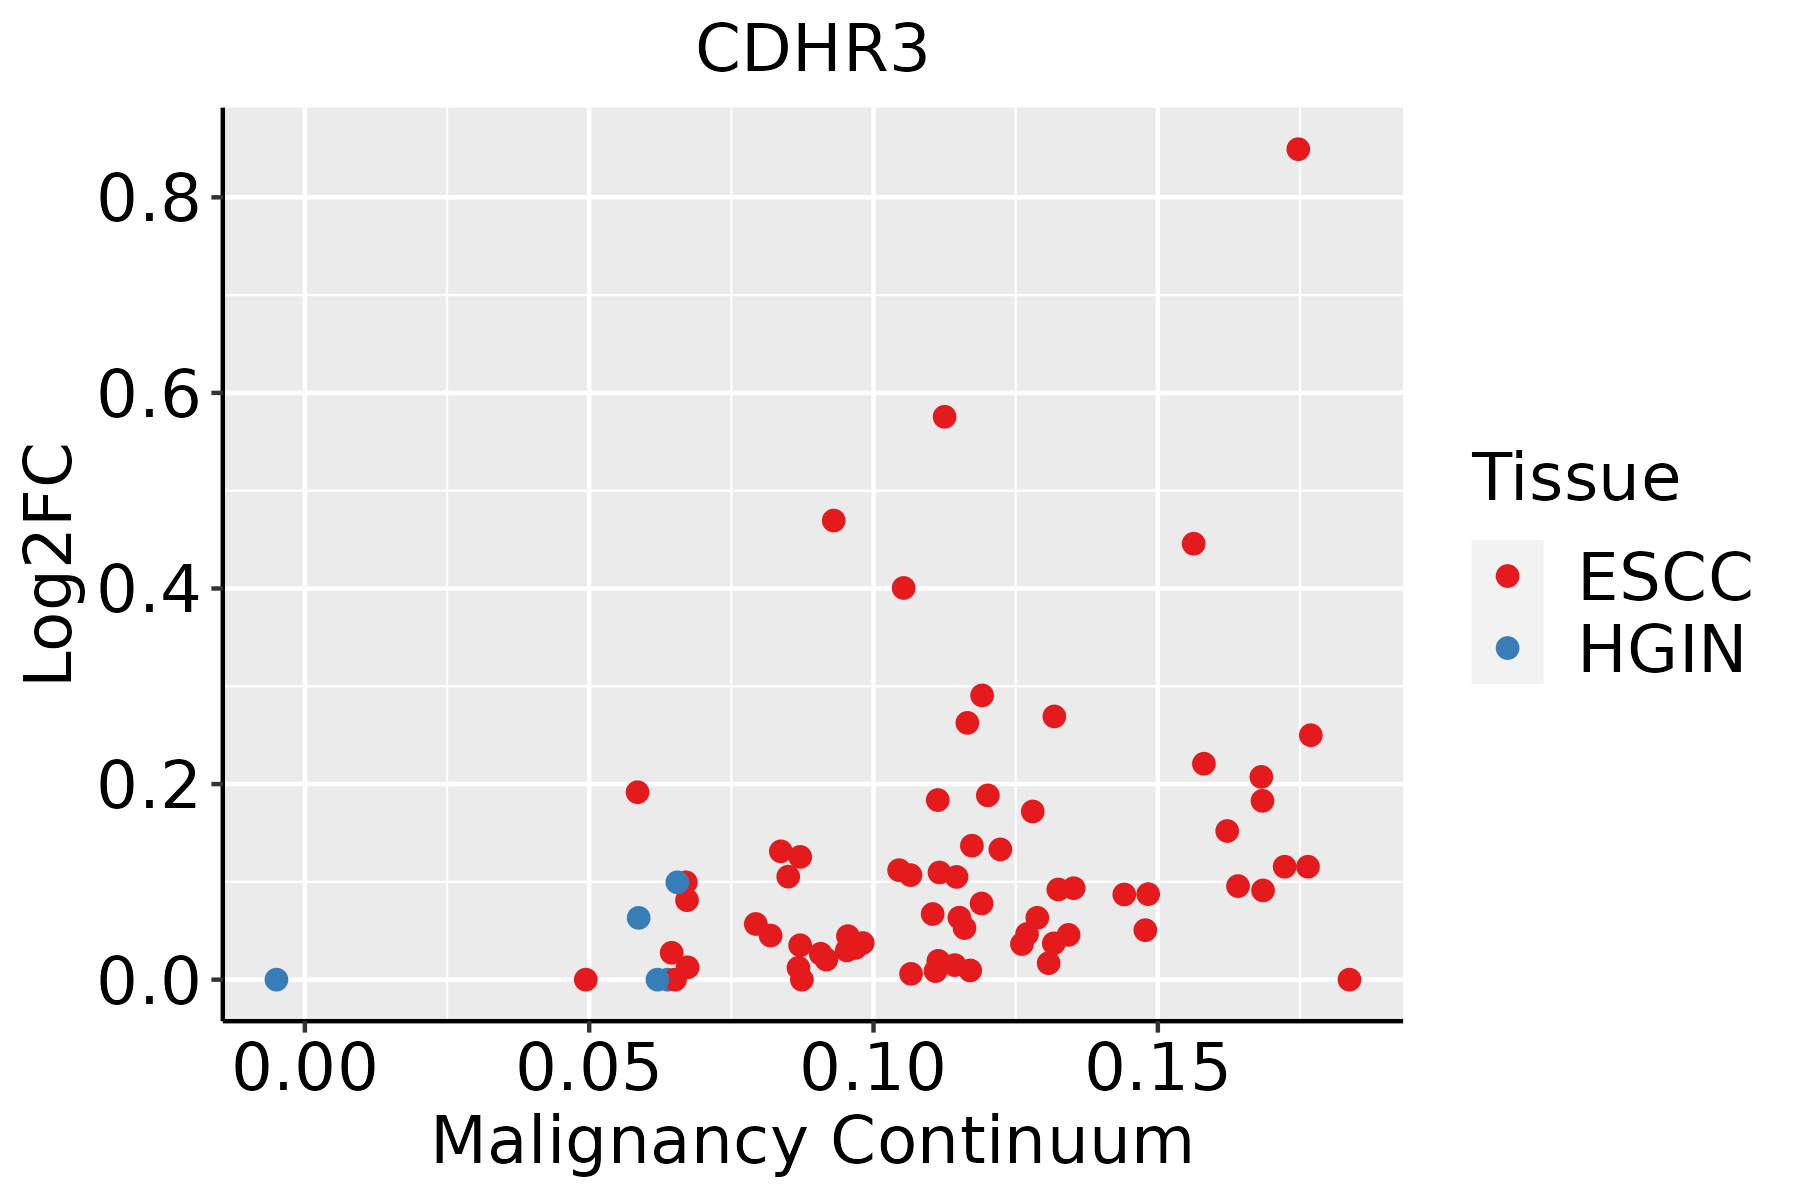 | ESCC: Esophageal squamous cell carcinoma |
| HGIN: High-grade intraepithelial neoplasias | ||
| LGIN: Low-grade intraepithelial neoplasias | ||
| Liver | 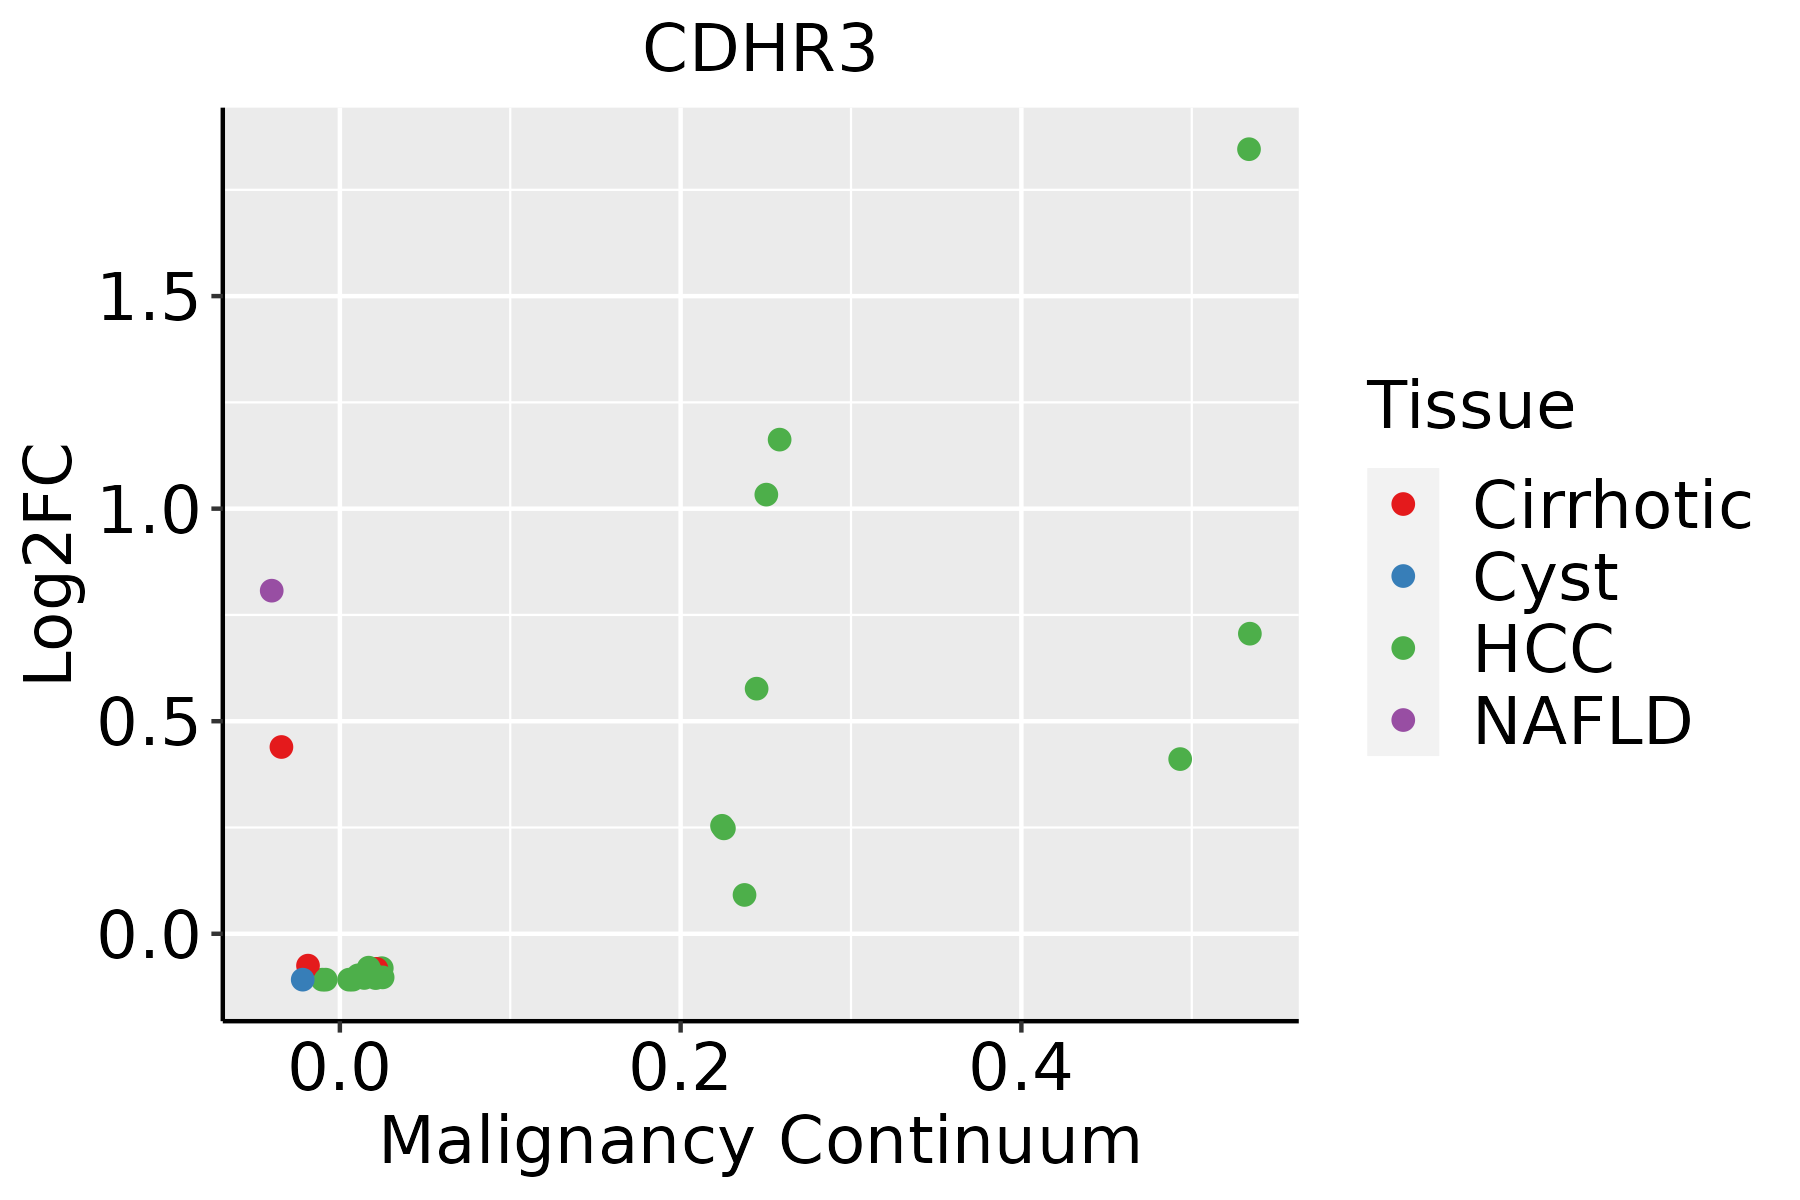 | HCC: Hepatocellular carcinoma |
| NAFLD: Non-alcoholic fatty liver disease |
| ∗log2FC in expression of this searched gene in stem-like cells from each diseased tissue sample relative to stem-like cells in normal samples in each tissue plotted against the malignancy continuum. Samples are colored based on if they are from different disease stage. |
Top |
Malignant transformation related pathway analysis |
| Find out the enriched GO biological processes and KEGG pathways involved in transition from healthy to precancer to cancer |
| Tissue | Disease Stage | Enriched GO biological Processes |
| Colorectum | AD |  |
| Colorectum | SER |  |
| Colorectum | MSS |  |
| Colorectum | MSI-H |  |
| Colorectum | FAP |  |
| ∗Top 15 enriched GO BP terms are showed in the bar plot of each disease state in each tissue. Each row represents a significant GO biological process which is colored according to the -log10(p.adjust). |
| Page: 1 2 3 4 5 6 7 8 9 |
| GO ID | Tissue | Disease Stage | Description | Gene Ratio | Bg Ratio | pvalue | p.adjust | Count |
| GO:0016032 | Colorectum | AD | viral process | 168/3918 | 415/18723 | 4.67e-20 | 3.66e-17 | 168 |
| GO:0019058 | Colorectum | AD | viral life cycle | 119/3918 | 317/18723 | 6.18e-12 | 8.23e-10 | 119 |
| GO:0045216 | Colorectum | AD | cell-cell junction organization | 80/3918 | 200/18723 | 5.57e-10 | 4.58e-08 | 80 |
| GO:0034329 | Colorectum | AD | cell junction assembly | 136/3918 | 420/18723 | 2.02e-08 | 1.15e-06 | 136 |
| GO:0044403 | Colorectum | AD | biological process involved in symbiotic interaction | 99/3918 | 290/18723 | 1.02e-07 | 4.93e-06 | 99 |
| GO:0007043 | Colorectum | AD | cell-cell junction assembly | 57/3918 | 146/18723 | 4.18e-07 | 1.61e-05 | 57 |
| GO:0051701 | Colorectum | AD | biological process involved in interaction with host | 73/3918 | 203/18723 | 5.08e-07 | 1.88e-05 | 73 |
| GO:0052126 | Colorectum | AD | movement in host environment | 63/3918 | 175/18723 | 2.85e-06 | 8.11e-05 | 63 |
| GO:0046718 | Colorectum | AD | viral entry into host cell | 51/3918 | 144/18723 | 3.99e-05 | 7.16e-04 | 51 |
| GO:0044409 | Colorectum | AD | entry into host | 51/3918 | 151/18723 | 1.60e-04 | 2.21e-03 | 51 |
| GO:0034332 | Colorectum | AD | adherens junction organization | 20/3918 | 49/18723 | 1.23e-03 | 1.09e-02 | 20 |
| GO:00160322 | Colorectum | MSS | viral process | 157/3467 | 415/18723 | 7.94e-21 | 6.19e-18 | 157 |
| GO:00190582 | Colorectum | MSS | viral life cycle | 111/3467 | 317/18723 | 1.65e-12 | 2.95e-10 | 111 |
| GO:00444032 | Colorectum | MSS | biological process involved in symbiotic interaction | 93/3467 | 290/18723 | 1.72e-08 | 9.85e-07 | 93 |
| GO:00452162 | Colorectum | MSS | cell-cell junction organization | 69/3467 | 200/18723 | 5.07e-08 | 2.70e-06 | 69 |
| GO:00343292 | Colorectum | MSS | cell junction assembly | 120/3467 | 420/18723 | 2.51e-07 | 1.07e-05 | 120 |
| GO:00517012 | Colorectum | MSS | biological process involved in interaction with host | 67/3467 | 203/18723 | 5.13e-07 | 1.98e-05 | 67 |
| GO:00521262 | Colorectum | MSS | movement in host environment | 58/3467 | 175/18723 | 2.50e-06 | 7.64e-05 | 58 |
| GO:00070432 | Colorectum | MSS | cell-cell junction assembly | 50/3467 | 146/18723 | 4.24e-06 | 1.21e-04 | 50 |
| GO:00467182 | Colorectum | MSS | viral entry into host cell | 47/3467 | 144/18723 | 3.35e-05 | 6.56e-04 | 47 |
| Page: 1 2 3 4 |
| Pathway ID | Tissue | Disease Stage | Description | Gene Ratio | Bg Ratio | pvalue | p.adjust | qvalue | Count |
| Page: 1 |
Top |
Cell-cell communication analysis |
| Identification of potential cell-cell interactions between two cell types and their ligand-receptor pairs for different disease states |
| Ligand | Receptor | LRpair | Pathway | Tissue | Disease Stage |
| Page: 1 |
Top |
Single-cell gene regulatory network inference analysis |
| Find out the significant the regulons (TFs) and the target genes of each regulon across cell types for different disease states |
| TF | Cell Type | Tissue | Disease Stage | Target Gene | RSS | Regulon Activity |
| ∗The dot plots of a searched regulon are shown for all cell subpopulations in each disease state of each tissue based on the regulon specific score inferred using pySCENIC and by calculating the average expression. |
| Page: 1 |
Top |
Somatic mutation of malignant transformation related genes |
| Annotation of somatic variants for genes involved in malignant transformation |
| Hugo Symbol | Variant Class | Variant Classification | dbSNP RS | HGVSc | HGVSp | HGVSp Short | SWISSPROT | BIOTYPE | SIFT | PolyPhen | Tumor Sample Barcode | Tissue | Histology | Sex | Age | Stage | Therapy Types | Drugs | Outcome |
| CDHR3 | SNV | Missense_Mutation | rs200019471 | c.622N>A | p.Val208Met | p.V208M | Q6ZTQ4 | protein_coding | tolerated(0.1) | probably_damaging(0.95) | TCGA-A1-A0SD-01 | Breast | breast invasive carcinoma | Female | <65 | I/II | Unknown | Unknown | SD |
| CDHR3 | SNV | Missense_Mutation | c.592N>C | p.Glu198Gln | p.E198Q | Q6ZTQ4 | protein_coding | deleterious(0) | probably_damaging(0.999) | TCGA-AC-A23H-01 | Breast | breast invasive carcinoma | Female | >=65 | I/II | Unknown | Unknown | PD | |
| CDHR3 | SNV | Missense_Mutation | novel | c.1055N>G | p.Ile352Ser | p.I352S | Q6ZTQ4 | protein_coding | tolerated(0.39) | benign(0.068) | TCGA-AR-A2LJ-01 | Breast | breast invasive carcinoma | Female | <65 | III/IV | Chemotherapy | adriamycin | SD |
| CDHR3 | SNV | Missense_Mutation | c.1592N>T | p.Thr531Ile | p.T531I | Q6ZTQ4 | protein_coding | deleterious(0.02) | probably_damaging(0.981) | TCGA-BH-A0AY-01 | Breast | breast invasive carcinoma | Female | <65 | I/II | Chemotherapy | SD | ||
| CDHR3 | SNV | Missense_Mutation | c.1672G>C | p.Glu558Gln | p.E558Q | Q6ZTQ4 | protein_coding | deleterious(0.05) | possibly_damaging(0.446) | TCGA-C8-A12Q-01 | Breast | breast invasive carcinoma | Female | >=65 | III/IV | Unknown | Unknown | PD | |
| CDHR3 | SNV | Missense_Mutation | c.2390N>C | p.Gly797Ala | p.G797A | Q6ZTQ4 | protein_coding | deleterious(0) | probably_damaging(0.998) | TCGA-E2-A1B1-01 | Breast | breast invasive carcinoma | Female | <65 | I/II | Other, specify in notesbiphosphonate | zoledronic | SD | |
| CDHR3 | insertion | Frame_Shift_Ins | novel | c.2129_2130insCTTCTCTCTCCCATGCTCGAGTCAATAT | p.Trp710CysfsTer78 | p.W710Cfs*78 | Q6ZTQ4 | protein_coding | TCGA-A2-A0D1-01 | Breast | breast invasive carcinoma | Female | >=65 | I/II | Chemotherapy | taxotere | SD | ||
| CDHR3 | insertion | Nonsense_Mutation | novel | c.1697_1698insGCAGCCCAATAAATAGGATTGTT | p.Cys566TrpfsTer6 | p.C566Wfs*6 | Q6ZTQ4 | protein_coding | TCGA-B6-A0I8-01 | Breast | breast invasive carcinoma | Female | <65 | I/II | Unknown | Unknown | PD | ||
| CDHR3 | SNV | Missense_Mutation | rs372834692 | c.779C>T | p.Ala260Val | p.A260V | Q6ZTQ4 | protein_coding | deleterious(0.03) | possibly_damaging(0.879) | TCGA-2W-A8YY-01 | Cervix | cervical & endocervical cancer | Female | <65 | I/II | Chemotherapy | cisplatin | CR |
| CDHR3 | SNV | Missense_Mutation | rs779162025 | c.2464N>T | p.Arg822Cys | p.R822C | Q6ZTQ4 | protein_coding | tolerated(0.1) | benign(0) | TCGA-C5-A3HE-01 | Cervix | cervical & endocervical cancer | Female | <65 | I/II | Unknown | Unknown | PD |
| Page: 1 2 3 4 5 6 7 8 9 10 11 12 |
Top |
Related drugs of malignant transformation related genes |
| Identification of chemicals and drugs interact with genes involved in malignant transfromation |
| (DGIdb 4.0) |
| Entrez ID | Symbol | Category | Interaction Types | Drug Claim Name | Drug Name | PMIDs |
| Page: 1 |

Copyright 2023-Present -The University of Texas Health Science Center at Houston |