
|
|||||
|
 | |
| |
| |
| |
| |
| |
|
Gene: CDHR2 |
Gene summary for CDHR2 |
| Gene information | Species | Human | Gene symbol | CDHR2 | Gene ID | 54825 |
| Gene name | cadherin related family member 2 | |
| Gene Alias | PCDH24 | |
| Cytomap | 5q35.2 | |
| Gene Type | protein-coding | GO ID | GO:0001558 | UniProtAcc | Q9BYE9 |
Top |
Malignant transformation analysis |
| Identification of the aberrant gene expression in precancerous and cancerous lesions by comparing the gene expression of stem-like cells in diseased tissues with normal stem cells |
| Entrez ID | Symbol | Replicates | Species | Organ | Tissue | Adj P-value | Log2FC | Malignancy |
| 54825 | CDHR2 | HTA11_2487_2000001011 | Human | Colorectum | SER | 8.44e-06 | 5.16e-01 | -0.1808 |
| 54825 | CDHR2 | HTA11_411_2000001011 | Human | Colorectum | SER | 1.22e-03 | 1.13e+00 | -0.2602 |
| 54825 | CDHR2 | HTA11_696_2000001011 | Human | Colorectum | AD | 2.18e-05 | 3.88e-01 | -0.1464 |
| 54825 | CDHR2 | HTA11_1391_2000001011 | Human | Colorectum | AD | 4.46e-03 | 3.61e-01 | -0.059 |
| 54825 | CDHR2 | HCC1_Meng | Human | Liver | HCC | 5.26e-32 | 5.64e-02 | 0.0246 |
| 54825 | CDHR2 | HCC2_Meng | Human | Liver | HCC | 9.79e-07 | 8.13e-02 | 0.0107 |
| 54825 | CDHR2 | HCC2 | Human | Liver | HCC | 3.34e-02 | 1.58e+00 | 0.5341 |
| 54825 | CDHR2 | S014 | Human | Liver | HCC | 5.53e-06 | 2.66e-01 | 0.2254 |
| 54825 | CDHR2 | S015 | Human | Liver | HCC | 9.38e-04 | 2.58e-01 | 0.2375 |
| 54825 | CDHR2 | S016 | Human | Liver | HCC | 7.52e-10 | 3.09e-01 | 0.2243 |
| 54825 | CDHR2 | S027 | Human | Liver | HCC | 4.01e-09 | 5.87e-01 | 0.2446 |
| 54825 | CDHR2 | S028 | Human | Liver | HCC | 2.71e-16 | 4.61e-01 | 0.2503 |
| 54825 | CDHR2 | S029 | Human | Liver | HCC | 7.02e-13 | 5.18e-01 | 0.2581 |
| 54825 | CDHR2 | Pat01-B | Human | Stomach | GC | 1.08e-65 | 1.15e+00 | 0.5754 |
| 54825 | CDHR2 | Pat02-B | Human | Stomach | GC | 1.43e-25 | 4.49e-01 | 0.0368 |
| 54825 | CDHR2 | Pat03-B | Human | Stomach | GC | 7.60e-37 | 8.65e-01 | 0.3693 |
| 54825 | CDHR2 | Pat05-B | Human | Stomach | GC | 1.11e-03 | 2.90e-01 | -0.0353 |
| 54825 | CDHR2 | Pat10-B | Human | Stomach | GC | 2.88e-03 | 3.77e-01 | 0.084 |
| 54825 | CDHR2 | Pat12-B | Human | Stomach | GC | 2.11e-05 | 2.25e-01 | 0.0325 |
| 54825 | CDHR2 | Pat13-B | Human | Stomach | GC | 1.27e-02 | 2.35e-01 | 0.0555 |
| Page: 1 2 |
| Tissue | Expression Dynamics | Abbreviation |
| Colorectum (GSE201348) |  | FAP: Familial adenomatous polyposis |
| CRC: Colorectal cancer | ||
| Colorectum (HTA11) |  | AD: Adenomas |
| SER: Sessile serrated lesions | ||
| MSI-H: Microsatellite-high colorectal cancer | ||
| MSS: Microsatellite stable colorectal cancer | ||
| GC | 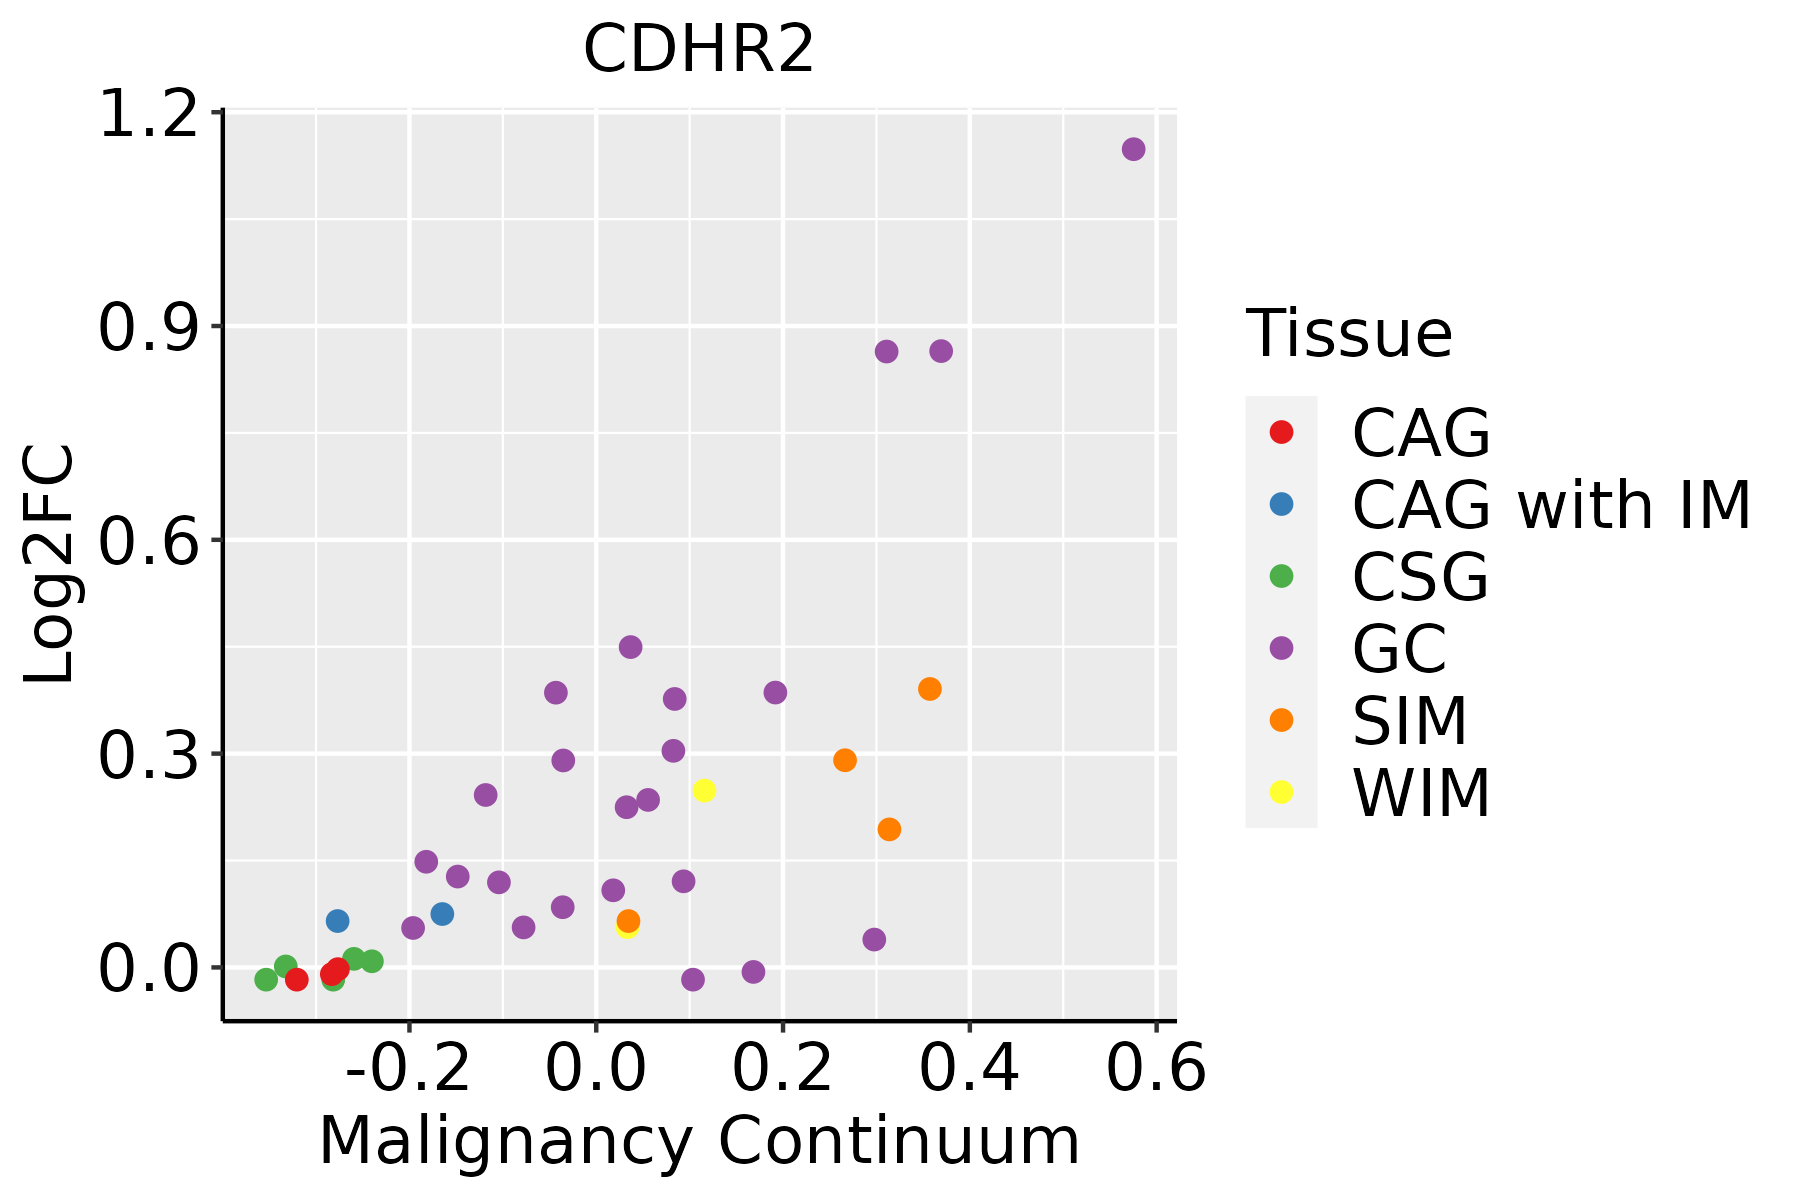 | CAG: Chronic atrophic gastritis |
| CAG with IM: Chronic atrophic gastritis with intestinal metaplasia | ||
| CSG: Chronic superficial gastritis | ||
| GC: Gastric cancer | ||
| SIM: Severe intestinal metaplasia | ||
| WIM: Wild intestinal metaplasia | ||
| Liver |  | HCC: Hepatocellular carcinoma |
| NAFLD: Non-alcoholic fatty liver disease |
| ∗log2FC in expression of this searched gene in stem-like cells from each diseased tissue sample relative to stem-like cells in normal samples in each tissue plotted against the malignancy continuum. Samples are colored based on if they are from different disease stage. |
Top |
Malignant transformation related pathway analysis |
| Find out the enriched GO biological processes and KEGG pathways involved in transition from healthy to precancer to cancer |
| Tissue | Disease Stage | Enriched GO biological Processes |
| Colorectum | AD |  |
| Colorectum | SER |  |
| Colorectum | MSS |  |
| Colorectum | MSI-H |  |
| Colorectum | FAP |  |
| ∗Top 15 enriched GO BP terms are showed in the bar plot of each disease state in each tissue. Each row represents a significant GO biological process which is colored according to the -log10(p.adjust). |
| Page: 1 2 3 4 5 6 7 8 9 |
| GO ID | Tissue | Disease Stage | Description | Gene Ratio | Bg Ratio | pvalue | p.adjust | Count |
| GO:0032535 | Colorectum | AD | regulation of cellular component size | 142/3918 | 383/18723 | 1.74e-13 | 3.41e-11 | 142 |
| GO:0016049 | Colorectum | AD | cell growth | 143/3918 | 482/18723 | 2.83e-06 | 8.09e-05 | 143 |
| GO:0001558 | Colorectum | AD | regulation of cell growth | 124/3918 | 414/18723 | 7.67e-06 | 1.86e-04 | 124 |
| GO:0032530 | Colorectum | AD | regulation of microvillus organization | 10/3918 | 13/18723 | 2.43e-05 | 4.69e-04 | 10 |
| GO:0032528 | Colorectum | AD | microvillus organization | 14/3918 | 24/18723 | 6.90e-05 | 1.11e-03 | 14 |
| GO:0045926 | Colorectum | AD | negative regulation of growth | 70/3918 | 249/18723 | 4.07e-03 | 2.83e-02 | 70 |
| GO:00325351 | Colorectum | SER | regulation of cellular component size | 115/2897 | 383/18723 | 3.04e-13 | 1.10e-10 | 115 |
| GO:00325301 | Colorectum | SER | regulation of microvillus organization | 10/2897 | 13/18723 | 1.41e-06 | 6.46e-05 | 10 |
| GO:00325281 | Colorectum | SER | microvillus organization | 14/2897 | 24/18723 | 1.83e-06 | 7.80e-05 | 14 |
| GO:00015581 | Colorectum | SER | regulation of cell growth | 90/2897 | 414/18723 | 4.00e-04 | 6.02e-03 | 90 |
| GO:00160491 | Colorectum | SER | cell growth | 100/2897 | 482/18723 | 1.07e-03 | 1.24e-02 | 100 |
| GO:00459261 | Colorectum | SER | negative regulation of growth | 55/2897 | 249/18723 | 3.44e-03 | 2.92e-02 | 55 |
| GO:0032536 | Colorectum | SER | regulation of cell projection size | 6/2897 | 12/18723 | 5.42e-03 | 4.03e-02 | 6 |
| GO:001604921 | Liver | HCC | cell growth | 269/7958 | 482/18723 | 1.84e-09 | 5.35e-08 | 269 |
| GO:003253522 | Liver | HCC | regulation of cellular component size | 217/7958 | 383/18723 | 1.28e-08 | 3.14e-07 | 217 |
| GO:000155821 | Liver | HCC | regulation of cell growth | 228/7958 | 414/18723 | 1.34e-07 | 2.55e-06 | 228 |
| GO:00325307 | Liver | HCC | regulation of microvillus organization | 12/7958 | 13/18723 | 2.73e-04 | 1.98e-03 | 12 |
| GO:00325286 | Liver | HCC | microvillus organization | 18/7958 | 24/18723 | 1.27e-03 | 6.92e-03 | 18 |
| GO:00459263 | Liver | HCC | negative regulation of growth | 129/7958 | 249/18723 | 1.81e-03 | 9.37e-03 | 129 |
| GO:0030308 | Liver | HCC | negative regulation of cell growth | 98/7958 | 188/18723 | 4.74e-03 | 2.02e-02 | 98 |
| Page: 1 2 |
| Pathway ID | Tissue | Disease Stage | Description | Gene Ratio | Bg Ratio | pvalue | p.adjust | qvalue | Count |
| Page: 1 |
Top |
Cell-cell communication analysis |
| Identification of potential cell-cell interactions between two cell types and their ligand-receptor pairs for different disease states |
| Ligand | Receptor | LRpair | Pathway | Tissue | Disease Stage |
| Page: 1 |
Top |
Single-cell gene regulatory network inference analysis |
| Find out the significant the regulons (TFs) and the target genes of each regulon across cell types for different disease states |
| TF | Cell Type | Tissue | Disease Stage | Target Gene | RSS | Regulon Activity |
| ∗The dot plots of a searched regulon are shown for all cell subpopulations in each disease state of each tissue based on the regulon specific score inferred using pySCENIC and by calculating the average expression. |
| Page: 1 |
Top |
Somatic mutation of malignant transformation related genes |
| Annotation of somatic variants for genes involved in malignant transformation |
| Hugo Symbol | Variant Class | Variant Classification | dbSNP RS | HGVSc | HGVSp | HGVSp Short | SWISSPROT | BIOTYPE | SIFT | PolyPhen | Tumor Sample Barcode | Tissue | Histology | Sex | Age | Stage | Therapy Types | Drugs | Outcome |
| CDHR2 | SNV | Missense_Mutation | novel | c.2693N>T | p.Asp898Val | p.D898V | Q9BYE9 | protein_coding | deleterious(0) | probably_damaging(0.999) | TCGA-A8-A0A9-01 | Breast | breast invasive carcinoma | Female | >=65 | I/II | Hormone Therapy | anastrozole | SD |
| CDHR2 | SNV | Missense_Mutation | c.1159N>A | p.Asp387Asn | p.D387N | Q9BYE9 | protein_coding | tolerated(0.33) | benign(0.073) | TCGA-AN-A046-01 | Breast | breast invasive carcinoma | Female | >=65 | I/II | Unknown | Unknown | SD | |
| CDHR2 | SNV | Missense_Mutation | c.3427N>G | p.Ser1143Gly | p.S1143G | Q9BYE9 | protein_coding | tolerated(0.39) | benign(0.038) | TCGA-B6-A0IJ-01 | Breast | breast invasive carcinoma | Female | <65 | I/II | Unknown | Unknown | SD | |
| CDHR2 | SNV | Missense_Mutation | c.3428N>C | p.Ser1143Thr | p.S1143T | Q9BYE9 | protein_coding | tolerated(0.58) | benign(0.003) | TCGA-B6-A0IJ-01 | Breast | breast invasive carcinoma | Female | <65 | I/II | Unknown | Unknown | SD | |
| CDHR2 | SNV | Missense_Mutation | novel | c.2722N>C | p.Tyr908His | p.Y908H | Q9BYE9 | protein_coding | tolerated(0.06) | possibly_damaging(0.556) | TCGA-BH-A0E2-01 | Breast | breast invasive carcinoma | Female | <65 | III/IV | Chemotherapy | doxorubicin | SD |
| CDHR2 | SNV | Missense_Mutation | c.1466N>A | p.Val489Glu | p.V489E | Q9BYE9 | protein_coding | deleterious(0) | probably_damaging(0.986) | TCGA-D8-A1JP-01 | Breast | breast invasive carcinoma | Female | >=65 | I/II | Hormone Therapy | tamoxiphen | SD | |
| CDHR2 | SNV | Missense_Mutation | rs777738616 | c.1310N>T | p.Ala437Val | p.A437V | Q9BYE9 | protein_coding | tolerated(0.09) | benign(0.001) | TCGA-E2-A1B4-01 | Breast | breast invasive carcinoma | Female | >=65 | III/IV | Hormone Therapy | arimidex | SD |
| CDHR2 | SNV | Missense_Mutation | c.3450A>T | p.Lys1150Asn | p.K1150N | Q9BYE9 | protein_coding | tolerated(0.46) | benign(0.001) | TCGA-E2-A1LS-01 | Breast | breast invasive carcinoma | Female | <65 | I/II | Unspecific | Cyclophosphamide | SD | |
| CDHR2 | SNV | Missense_Mutation | novel | c.2005G>A | p.Asp669Asn | p.D669N | Q9BYE9 | protein_coding | deleterious(0) | probably_damaging(1) | TCGA-GM-A3NW-01 | Breast | breast invasive carcinoma | Female | <65 | I/II | Chemotherapy | fluorouracil | SD |
| CDHR2 | insertion | Frame_Shift_Ins | novel | c.2694_2695insT | p.Leu899SerfsTer21 | p.L899Sfs*21 | Q9BYE9 | protein_coding | TCGA-A8-A0A9-01 | Breast | breast invasive carcinoma | Female | >=65 | I/II | Hormone Therapy | anastrozole | SD |
| Page: 1 2 3 4 5 6 7 8 9 10 11 12 13 14 15 16 17 18 |
Top |
Related drugs of malignant transformation related genes |
| Identification of chemicals and drugs interact with genes involved in malignant transfromation |
| (DGIdb 4.0) |
| Entrez ID | Symbol | Category | Interaction Types | Drug Claim Name | Drug Name | PMIDs |
| Page: 1 |

Copyright 2023-Present -The University of Texas Health Science Center at Houston |