
|
|||||
|
 | |
| |
| |
| |
| |
| |
|
Gene: CDH3 |
Gene summary for CDH3 |
| Gene information | Species | Human | Gene symbol | CDH3 | Gene ID | 1001 |
| Gene name | cadherin 3 | |
| Gene Alias | CDHP | |
| Cytomap | 16q22.1 | |
| Gene Type | protein-coding | GO ID | GO:0001816 | UniProtAcc | P22223 |
Top |
Malignant transformation analysis |
| Identification of the aberrant gene expression in precancerous and cancerous lesions by comparing the gene expression of stem-like cells in diseased tissues with normal stem cells |
| Entrez ID | Symbol | Replicates | Species | Organ | Tissue | Adj P-value | Log2FC | Malignancy |
| 1001 | CDH3 | CA_HPV_1 | Human | Cervix | CC | 1.61e-02 | -1.28e-01 | 0.0264 |
| 1001 | CDH3 | CCI_2 | Human | Cervix | CC | 5.84e-19 | 1.42e+00 | 0.5249 |
| 1001 | CDH3 | CCI_3 | Human | Cervix | CC | 1.11e-13 | 9.86e-01 | 0.516 |
| 1001 | CDH3 | Tumor | Human | Cervix | CC | 7.73e-34 | 6.46e-01 | 0.1241 |
| 1001 | CDH3 | sample3 | Human | Cervix | CC | 1.34e-38 | 6.93e-01 | 0.1387 |
| 1001 | CDH3 | T3 | Human | Cervix | CC | 2.09e-45 | 6.99e-01 | 0.1389 |
| 1001 | CDH3 | HTA11_3410_2000001011 | Human | Colorectum | AD | 4.86e-10 | 2.41e-01 | 0.0155 |
| 1001 | CDH3 | HTA11_2487_2000001011 | Human | Colorectum | SER | 2.87e-03 | 2.08e-01 | -0.1808 |
| 1001 | CDH3 | HTA11_1938_2000001011 | Human | Colorectum | AD | 1.13e-16 | 4.17e-01 | -0.0811 |
| 1001 | CDH3 | HTA11_78_2000001011 | Human | Colorectum | AD | 6.08e-09 | 3.48e-01 | -0.1088 |
| 1001 | CDH3 | HTA11_411_2000001011 | Human | Colorectum | SER | 1.64e-03 | 4.81e-01 | -0.2602 |
| 1001 | CDH3 | HTA11_1391_2000001011 | Human | Colorectum | AD | 1.18e-17 | 5.54e-01 | -0.059 |
| 1001 | CDH3 | HTA11_866_3004761011 | Human | Colorectum | AD | 5.89e-08 | 2.42e-01 | 0.096 |
| 1001 | CDH3 | HTA11_10711_2000001011 | Human | Colorectum | AD | 1.68e-04 | 1.40e-01 | 0.0338 |
| 1001 | CDH3 | HTA11_7696_3000711011 | Human | Colorectum | AD | 6.00e-23 | 5.42e-01 | 0.0674 |
| 1001 | CDH3 | HTA11_11156_2000001011 | Human | Colorectum | AD | 4.10e-02 | 2.47e-01 | 0.0397 |
| 1001 | CDH3 | HTA11_6818_2000001021 | Human | Colorectum | AD | 4.84e-09 | 3.09e-01 | 0.0588 |
| 1001 | CDH3 | HTA11_99999970781_79442 | Human | Colorectum | MSS | 1.03e-30 | 7.11e-01 | 0.294 |
| 1001 | CDH3 | HTA11_99999965104_69814 | Human | Colorectum | MSS | 2.34e-06 | 3.26e-01 | 0.281 |
| 1001 | CDH3 | HTA11_99999971662_82457 | Human | Colorectum | MSS | 9.88e-32 | 8.59e-01 | 0.3859 |
| Page: 1 2 3 4 5 6 |
| Tissue | Expression Dynamics | Abbreviation |
| Cervix | 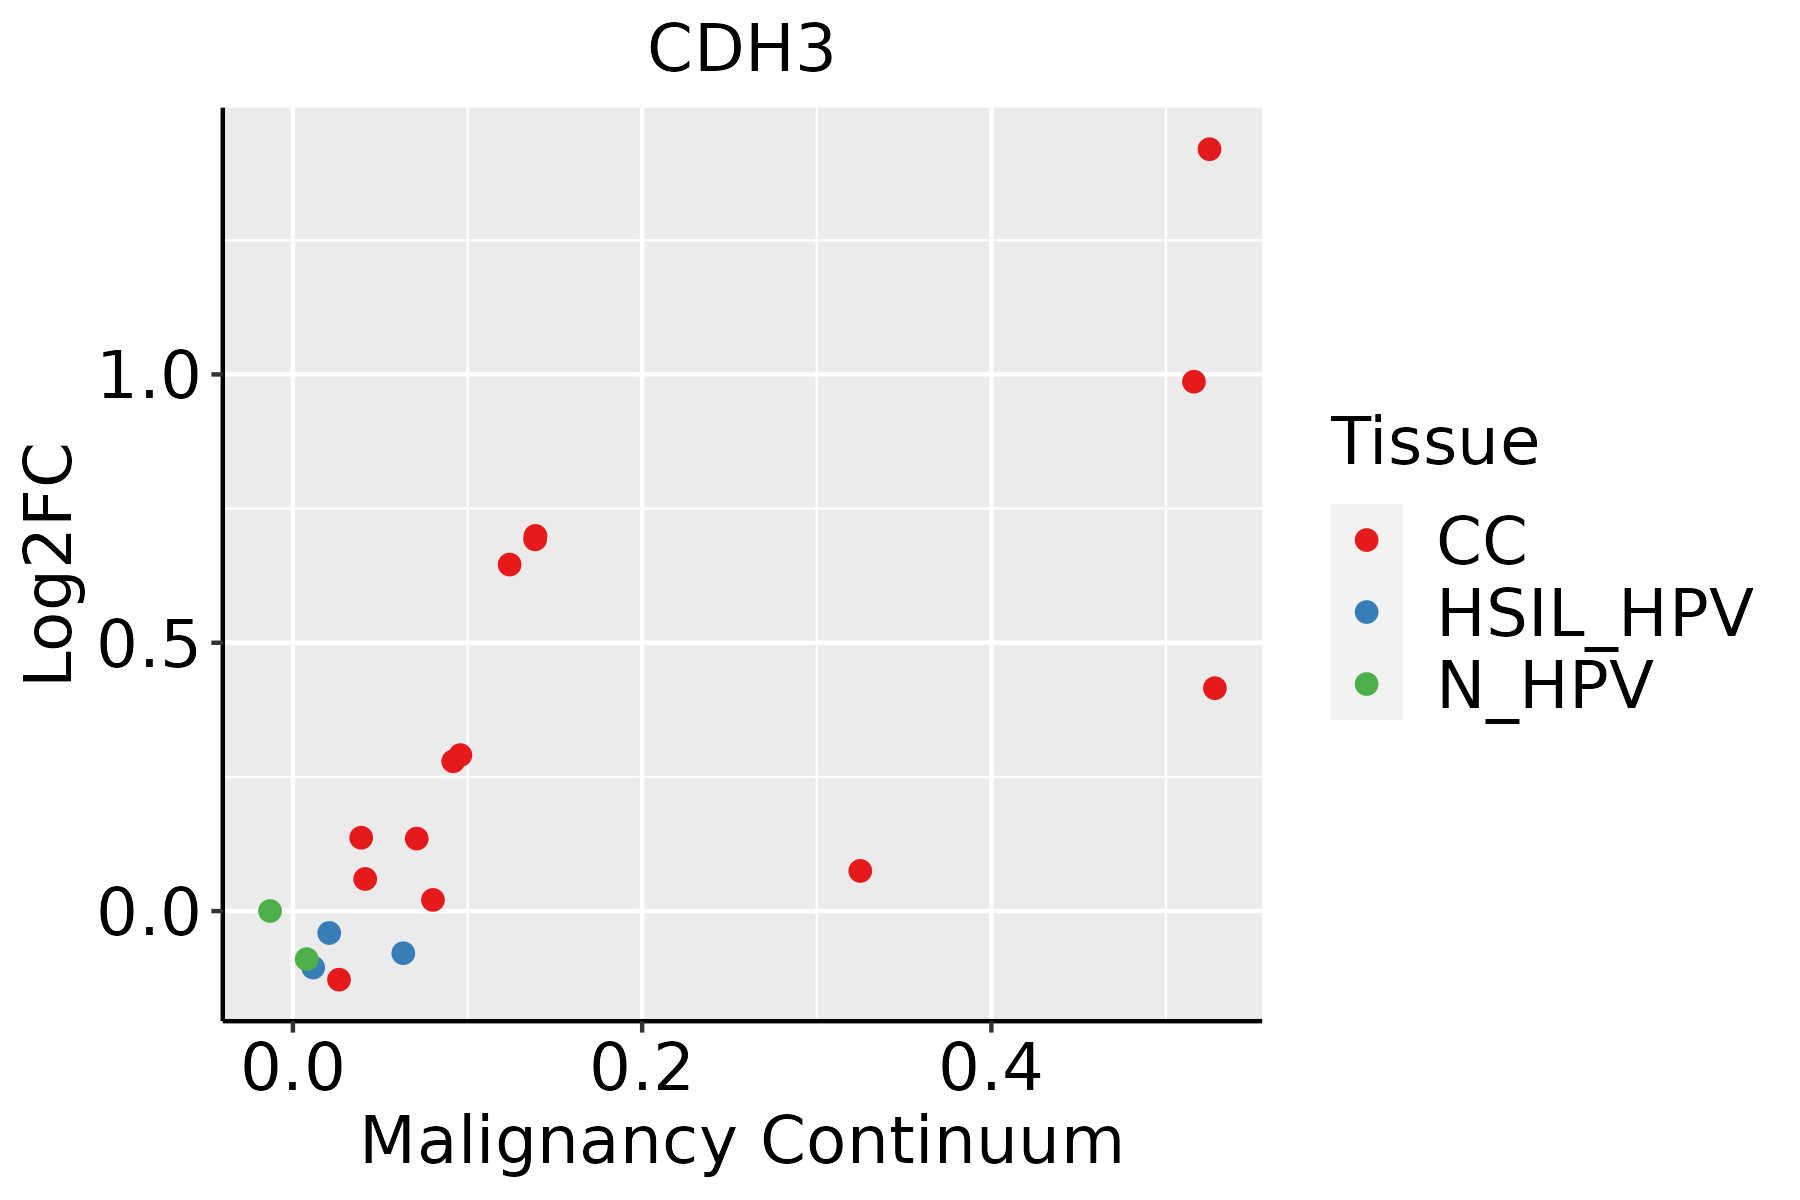 | CC: Cervix cancer |
| HSIL_HPV: HPV-infected high-grade squamous intraepithelial lesions | ||
| N_HPV: HPV-infected normal cervix | ||
| Colorectum (GSE201348) | 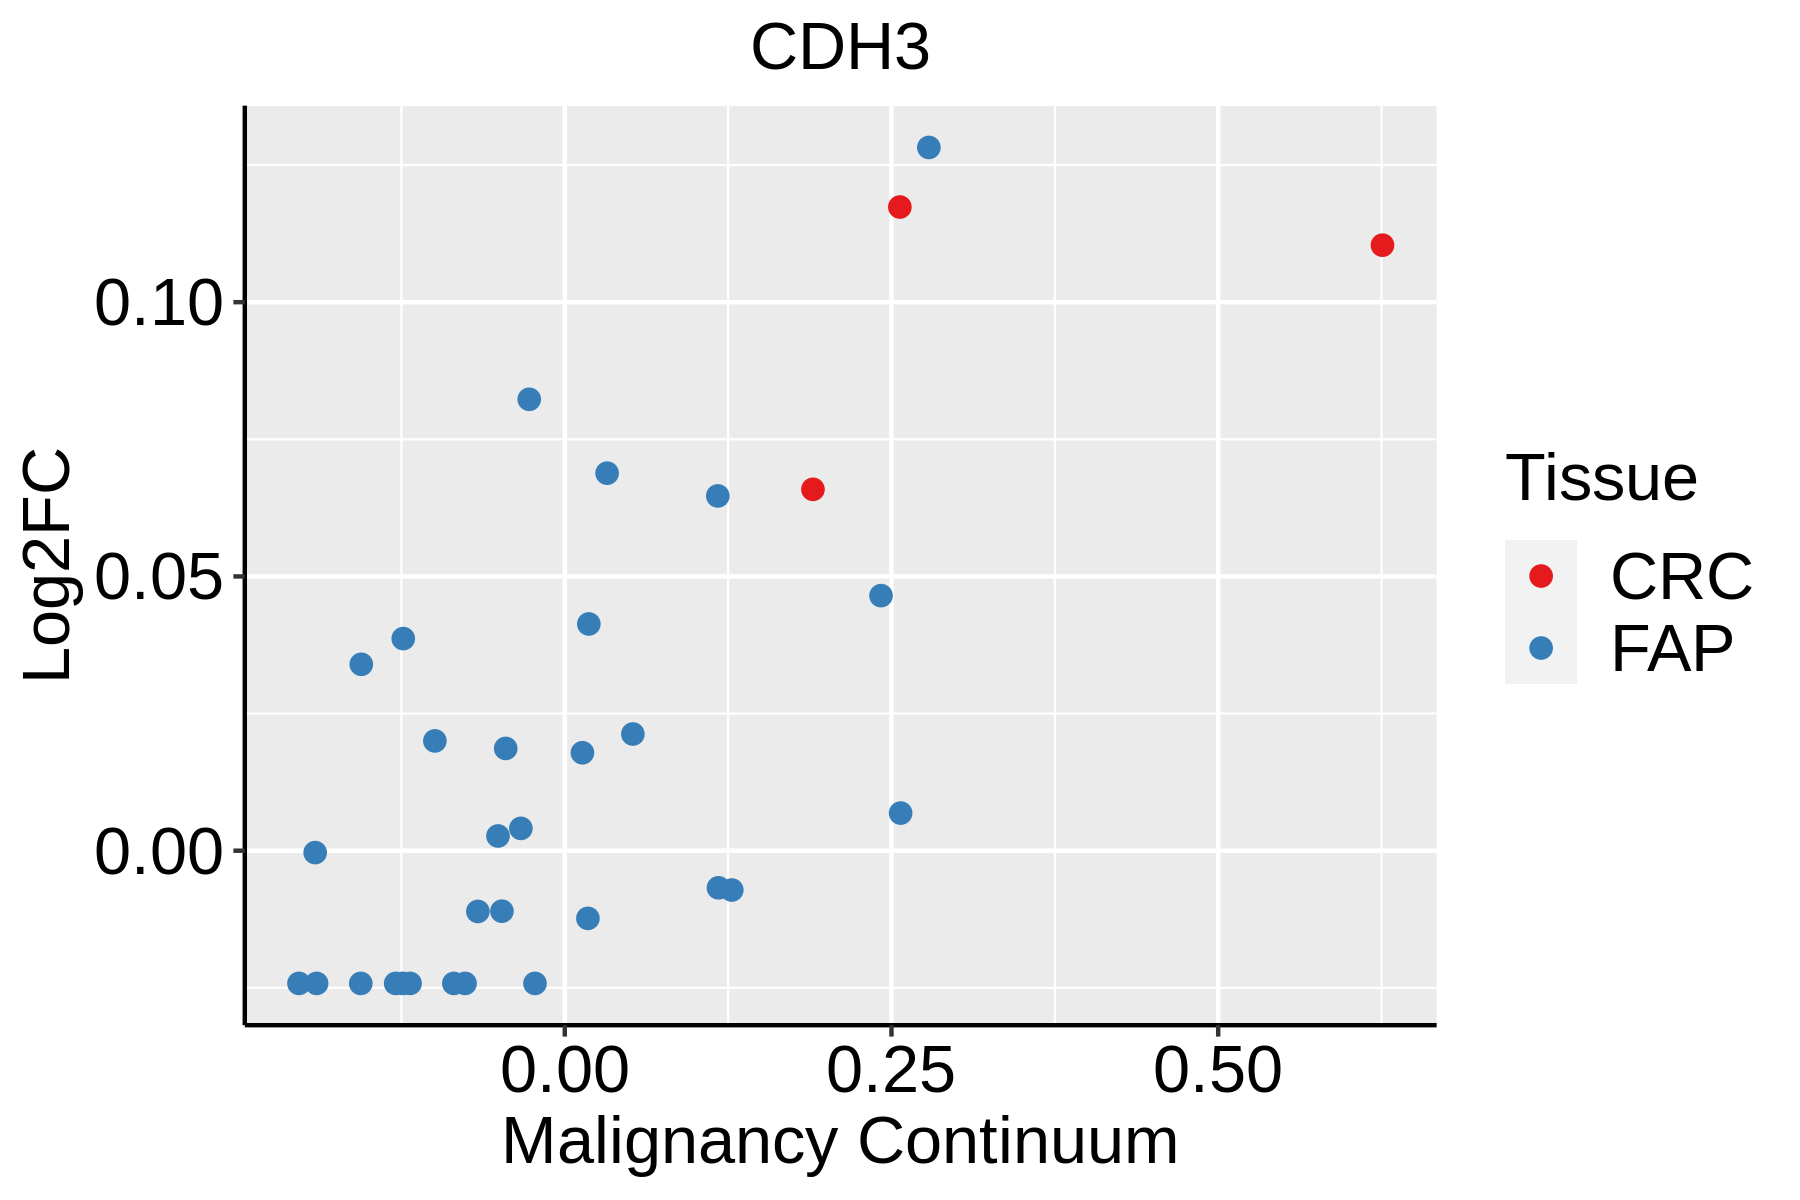 | FAP: Familial adenomatous polyposis |
| CRC: Colorectal cancer | ||
| Colorectum (HTA11) |  | AD: Adenomas |
| SER: Sessile serrated lesions | ||
| MSI-H: Microsatellite-high colorectal cancer | ||
| MSS: Microsatellite stable colorectal cancer | ||
| Esophagus |  | ESCC: Esophageal squamous cell carcinoma |
| HGIN: High-grade intraepithelial neoplasias | ||
| LGIN: Low-grade intraepithelial neoplasias | ||
| Oral Cavity | 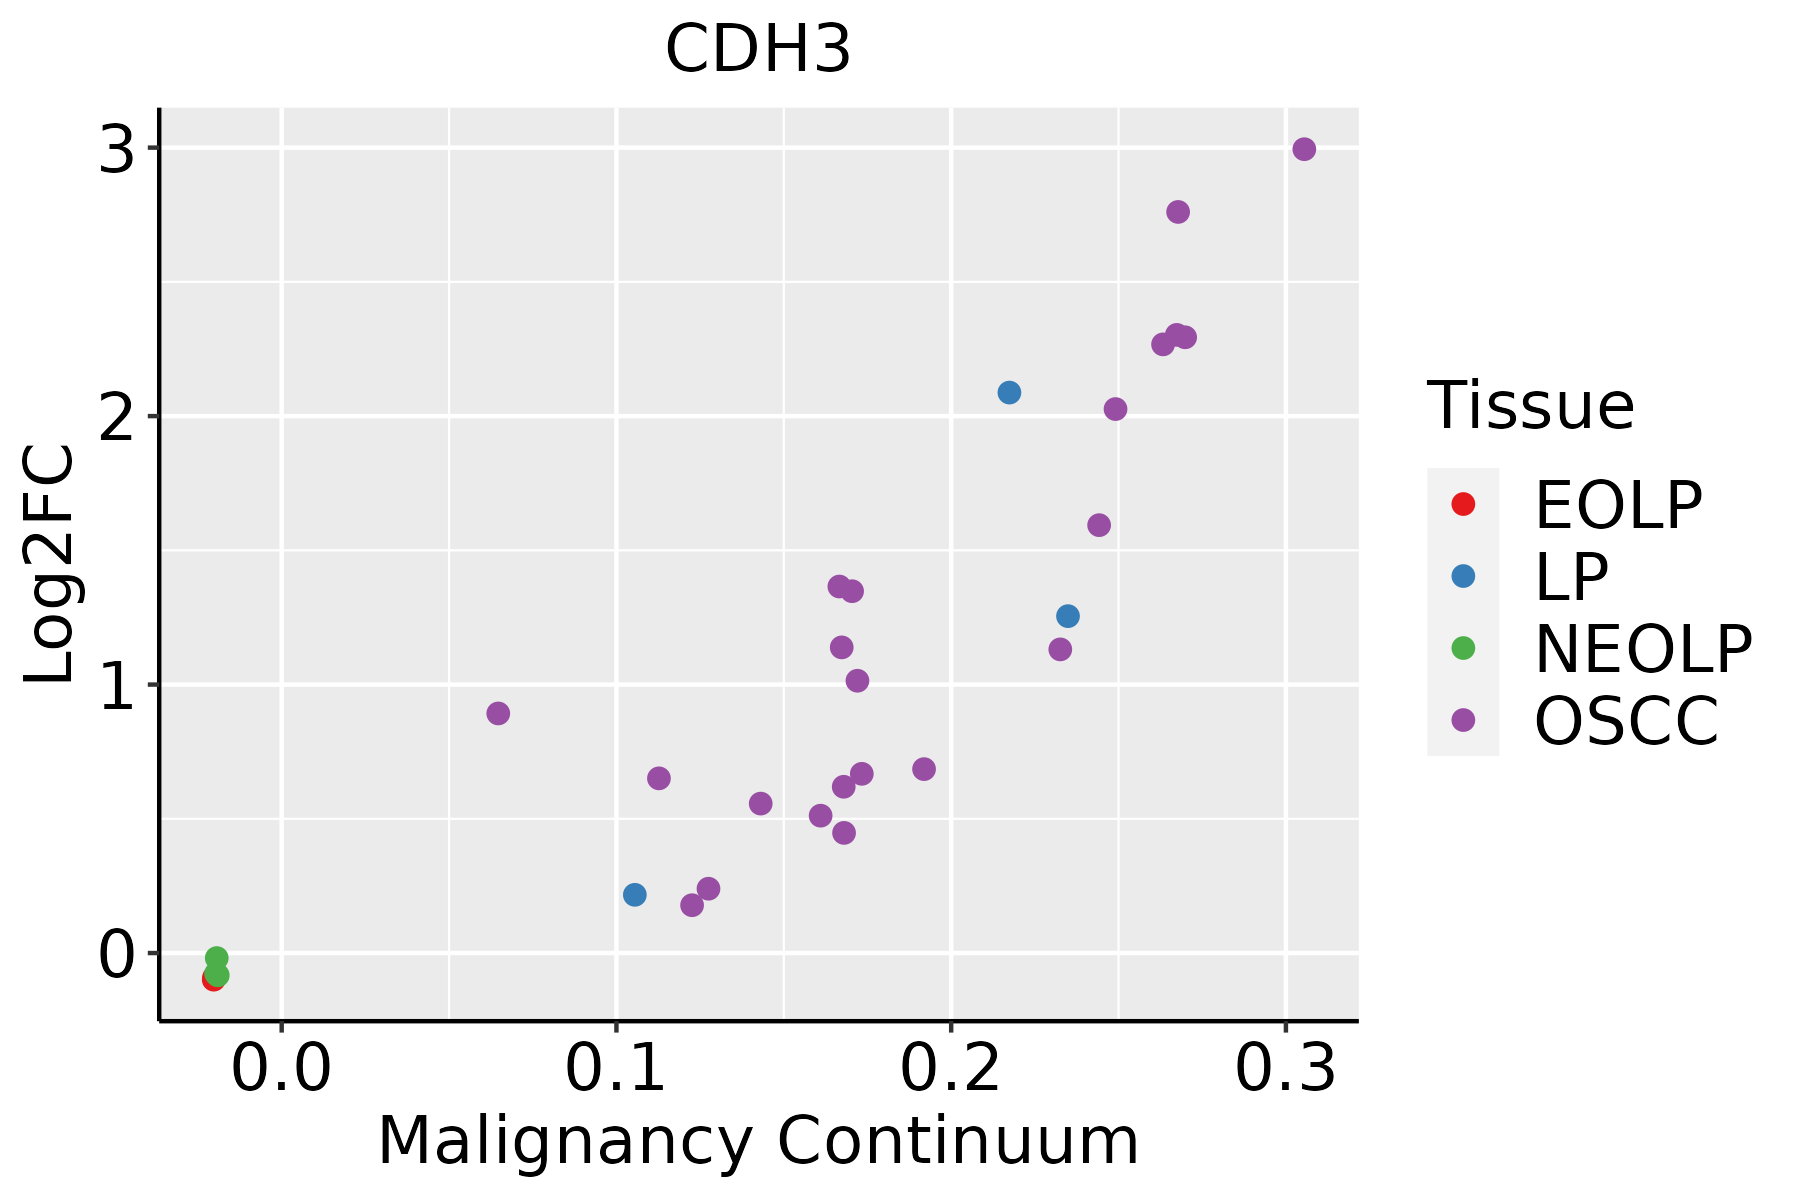 | EOLP: Erosive Oral lichen planus |
| LP: leukoplakia | ||
| NEOLP: Non-erosive oral lichen planus | ||
| OSCC: Oral squamous cell carcinoma | ||
| Skin | 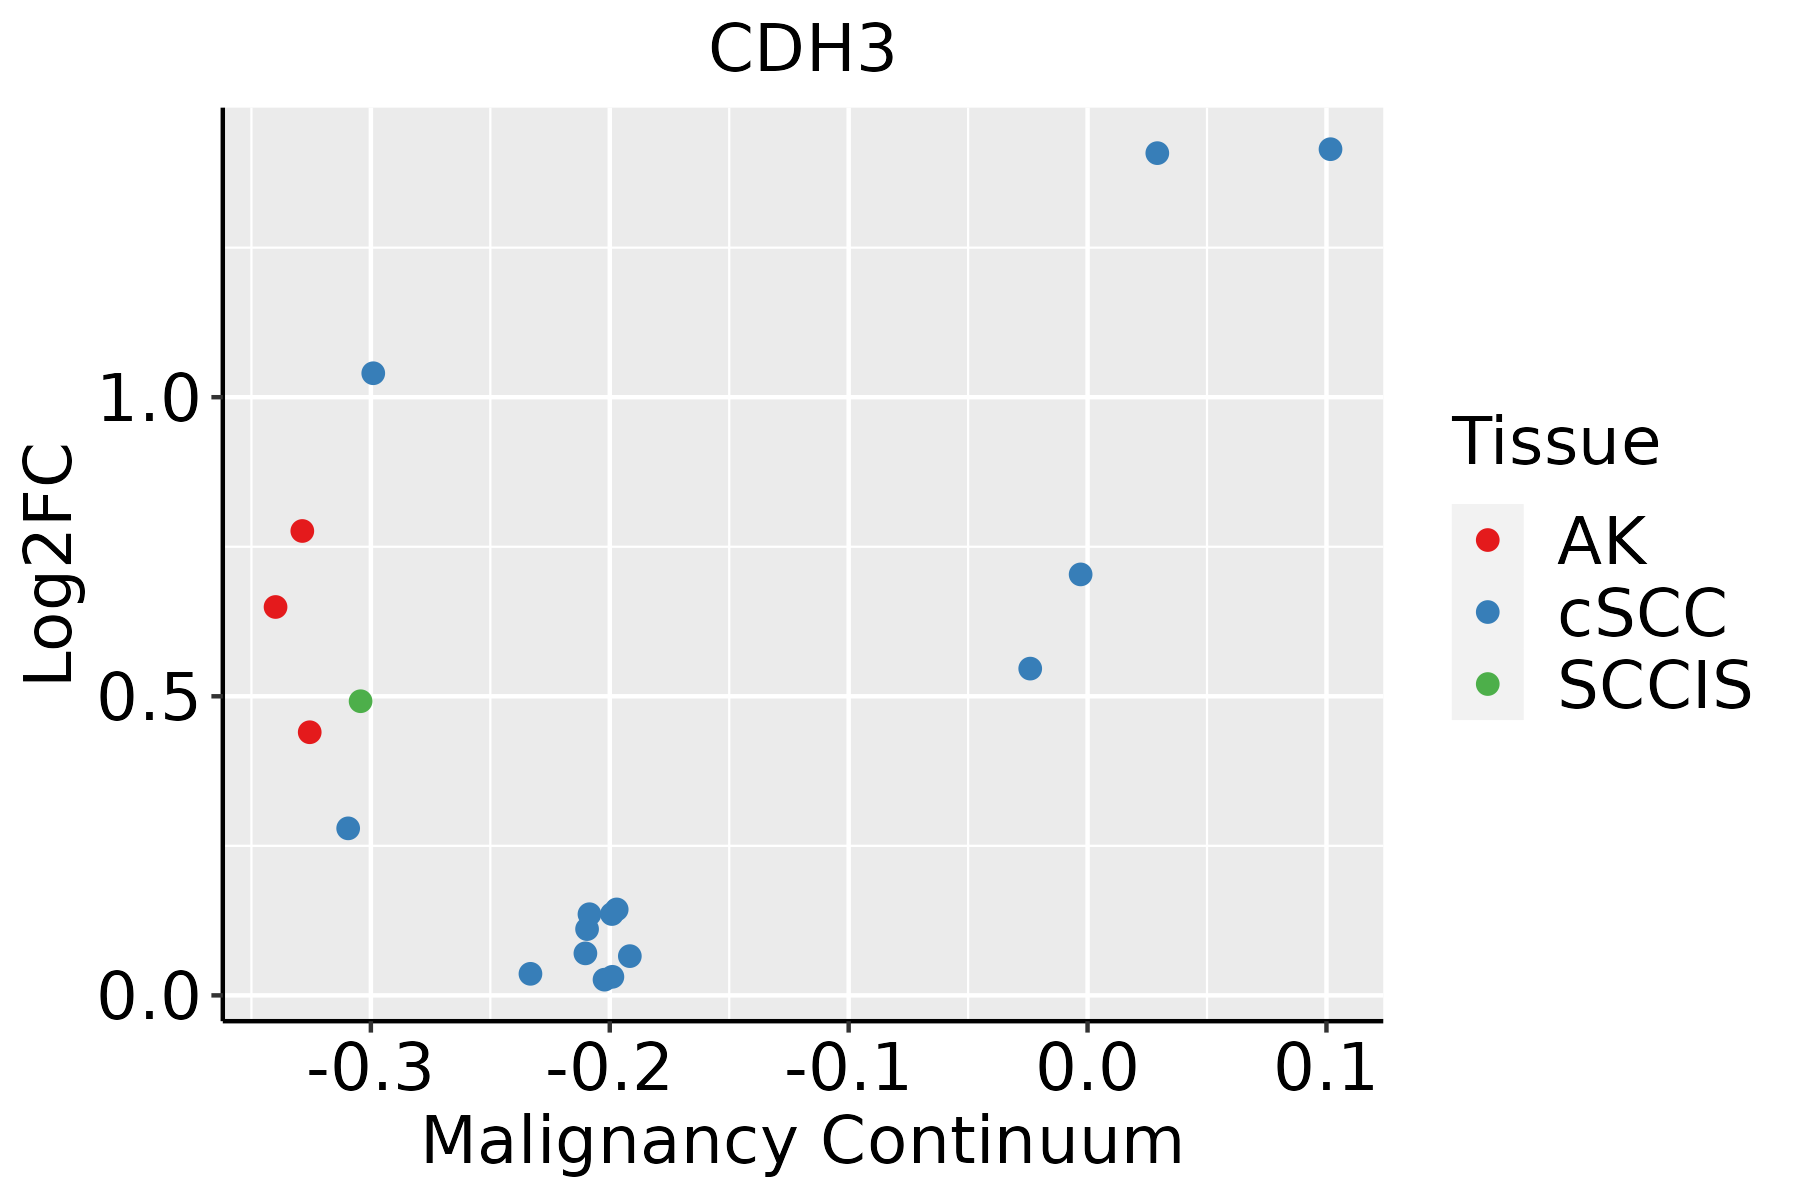 | AK: Actinic keratosis |
| cSCC: Cutaneous squamous cell carcinoma | ||
| SCCIS:squamous cell carcinoma in situ | ||
| Thyroid | 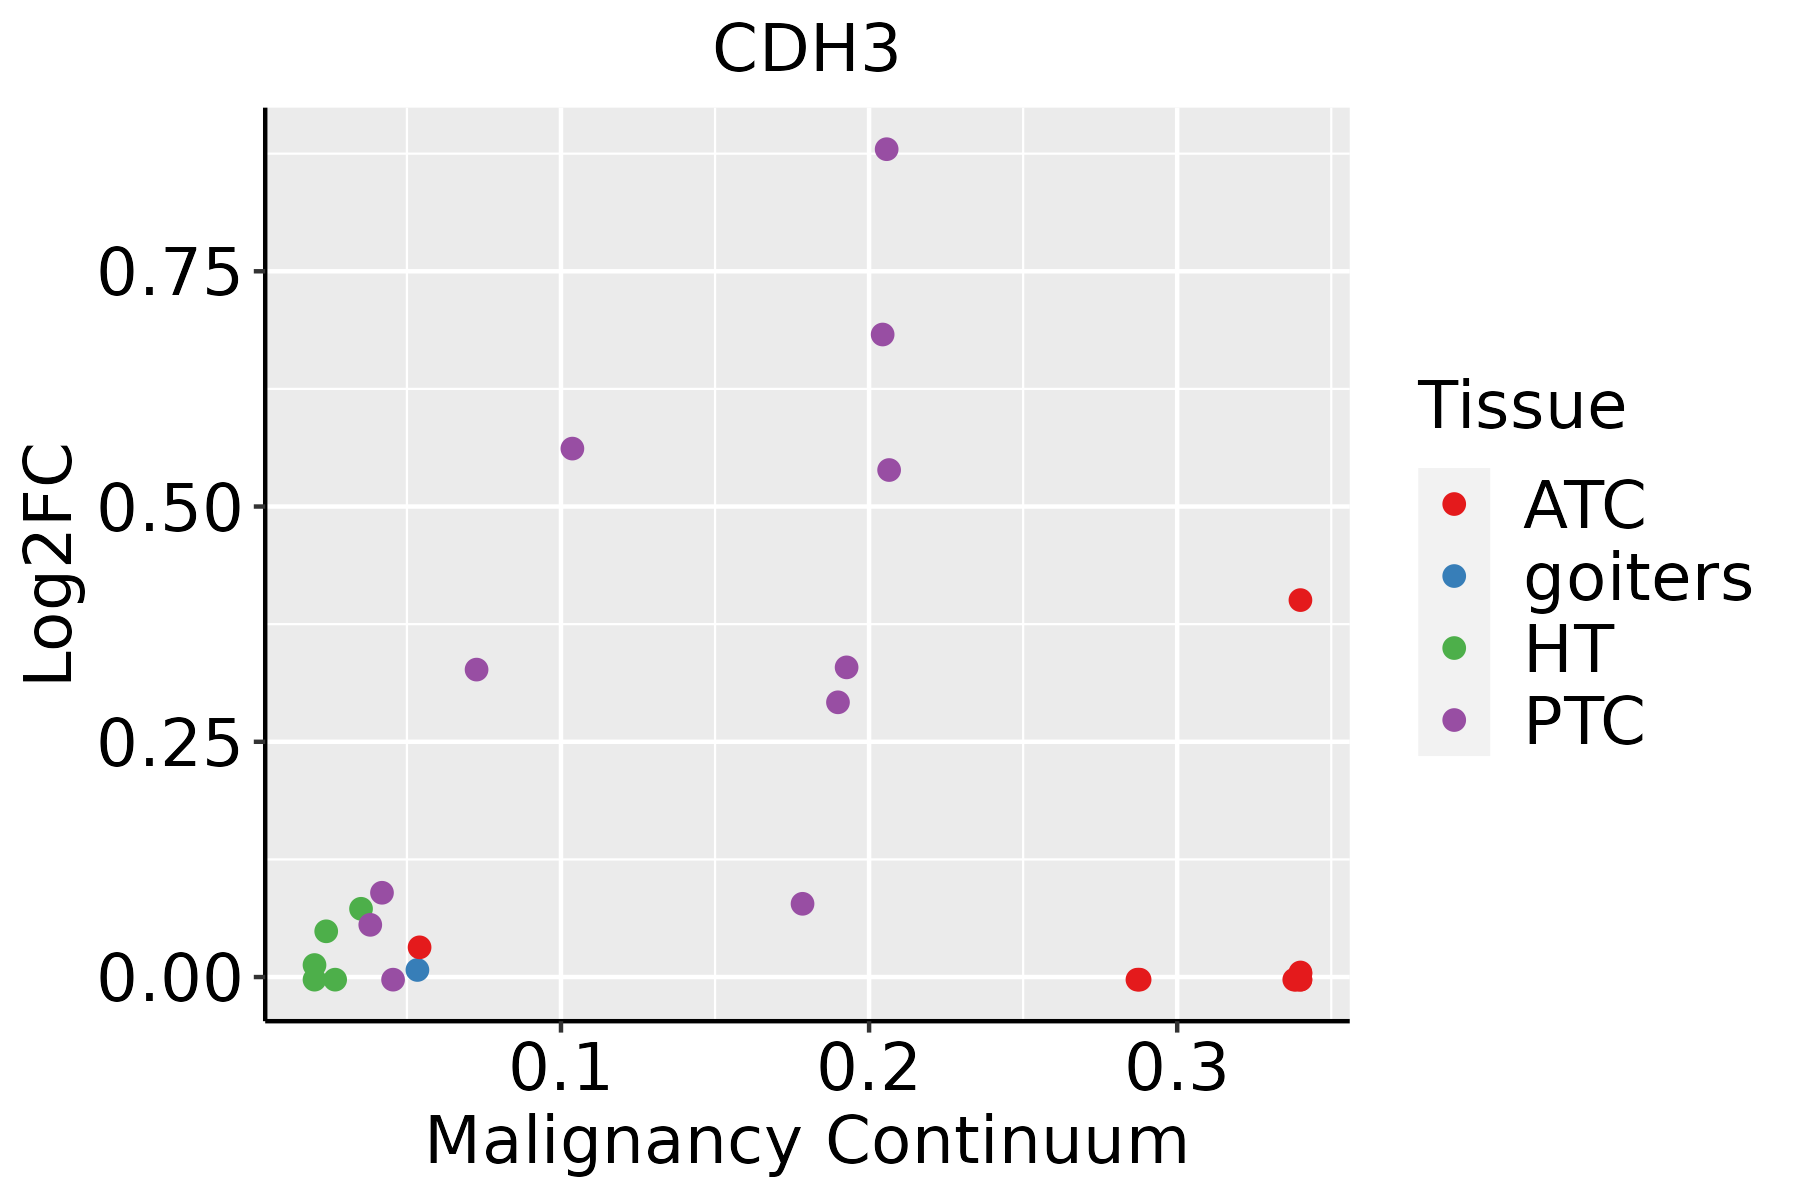 | ATC: Anaplastic thyroid cancer |
| HT: Hashimoto's thyroiditis | ||
| PTC: Papillary thyroid cancer |
| ∗log2FC in expression of this searched gene in stem-like cells from each diseased tissue sample relative to stem-like cells in normal samples in each tissue plotted against the malignancy continuum. Samples are colored based on if they are from different disease stage. |
Top |
Malignant transformation related pathway analysis |
| Find out the enriched GO biological processes and KEGG pathways involved in transition from healthy to precancer to cancer |
| Tissue | Disease Stage | Enriched GO biological Processes |
| Colorectum | AD |  |
| Colorectum | SER |  |
| Colorectum | MSS |  |
| Colorectum | MSI-H |  |
| Colorectum | FAP |  |
| ∗Top 15 enriched GO BP terms are showed in the bar plot of each disease state in each tissue. Each row represents a significant GO biological process which is colored according to the -log10(p.adjust). |
| Page: 1 2 3 4 5 6 7 8 9 |
| GO ID | Tissue | Disease Stage | Description | Gene Ratio | Bg Ratio | pvalue | p.adjust | Count |
| GO:004206010 | Cervix | CC | wound healing | 109/2311 | 422/18723 | 1.84e-14 | 1.57e-11 | 109 |
| GO:00085446 | Cervix | CC | epidermis development | 83/2311 | 324/18723 | 3.91e-11 | 8.54e-09 | 83 |
| GO:00435884 | Cervix | CC | skin development | 71/2311 | 263/18723 | 8.04e-11 | 1.46e-08 | 71 |
| GO:00506737 | Cervix | CC | epithelial cell proliferation | 98/2311 | 437/18723 | 2.01e-09 | 2.15e-07 | 98 |
| GO:00160557 | Cervix | CC | Wnt signaling pathway | 98/2311 | 444/18723 | 4.82e-09 | 4.65e-07 | 98 |
| GO:01987387 | Cervix | CC | cell-cell signaling by wnt | 98/2311 | 446/18723 | 6.16e-09 | 5.58e-07 | 98 |
| GO:00302164 | Cervix | CC | keratinocyte differentiation | 42/2311 | 139/18723 | 1.74e-08 | 1.28e-06 | 42 |
| GO:00301117 | Cervix | CC | regulation of Wnt signaling pathway | 76/2311 | 328/18723 | 3.05e-08 | 2.08e-06 | 76 |
| GO:00099137 | Cervix | CC | epidermal cell differentiation | 53/2311 | 202/18723 | 5.48e-08 | 3.25e-06 | 53 |
| GO:00506787 | Cervix | CC | regulation of epithelial cell proliferation | 83/2311 | 381/18723 | 1.31e-07 | 6.42e-06 | 83 |
| GO:00608287 | Cervix | CC | regulation of canonical Wnt signaling pathway | 58/2311 | 253/18723 | 1.83e-06 | 5.89e-05 | 58 |
| GO:00600707 | Cervix | CC | canonical Wnt signaling pathway | 66/2311 | 303/18723 | 2.47e-06 | 7.35e-05 | 66 |
| GO:00506794 | Cervix | CC | positive regulation of epithelial cell proliferation | 47/2311 | 207/18723 | 2.18e-05 | 3.90e-04 | 47 |
| GO:00018949 | Cervix | CC | tissue homeostasis | 57/2311 | 268/18723 | 2.43e-05 | 4.21e-04 | 57 |
| GO:00516567 | Cervix | CC | establishment of organelle localization | 76/2311 | 390/18723 | 3.17e-05 | 5.21e-04 | 76 |
| GO:00602498 | Cervix | CC | anatomical structure homeostasis | 63/2311 | 314/18723 | 6.03e-05 | 8.68e-04 | 63 |
| GO:00716344 | Cervix | CC | regulation of transforming growth factor beta production | 14/2311 | 41/18723 | 2.49e-04 | 2.77e-03 | 14 |
| GO:00436164 | Cervix | CC | keratinocyte proliferation | 15/2311 | 46/18723 | 2.70e-04 | 2.97e-03 | 15 |
| GO:00716043 | Cervix | CC | transforming growth factor beta production | 14/2311 | 43/18723 | 4.37e-04 | 4.38e-03 | 14 |
| GO:00108376 | Cervix | CC | regulation of keratinocyte proliferation | 12/2311 | 35/18723 | 6.55e-04 | 6.05e-03 | 12 |
| Page: 1 2 3 4 5 6 7 8 9 10 11 12 13 14 15 |
| Pathway ID | Tissue | Disease Stage | Description | Gene Ratio | Bg Ratio | pvalue | p.adjust | qvalue | Count |
| hsa045147 | Cervix | CC | Cell adhesion molecules | 36/1267 | 157/8465 | 4.94e-03 | 1.67e-02 | 9.86e-03 | 36 |
| hsa0451412 | Cervix | CC | Cell adhesion molecules | 36/1267 | 157/8465 | 4.94e-03 | 1.67e-02 | 9.86e-03 | 36 |
| Page: 1 |
Top |
Cell-cell communication analysis |
| Identification of potential cell-cell interactions between two cell types and their ligand-receptor pairs for different disease states |
| Ligand | Receptor | LRpair | Pathway | Tissue | Disease Stage |
| Page: 1 |
Top |
Single-cell gene regulatory network inference analysis |
| Find out the significant the regulons (TFs) and the target genes of each regulon across cell types for different disease states |
| TF | Cell Type | Tissue | Disease Stage | Target Gene | RSS | Regulon Activity |
| ∗The dot plots of a searched regulon are shown for all cell subpopulations in each disease state of each tissue based on the regulon specific score inferred using pySCENIC and by calculating the average expression. |
| Page: 1 |
Top |
Somatic mutation of malignant transformation related genes |
| Annotation of somatic variants for genes involved in malignant transformation |
| Hugo Symbol | Variant Class | Variant Classification | dbSNP RS | HGVSc | HGVSp | HGVSp Short | SWISSPROT | BIOTYPE | SIFT | PolyPhen | Tumor Sample Barcode | Tissue | Histology | Sex | Age | Stage | Therapy Types | Drugs | Outcome |
| CDH3 | SNV | Missense_Mutation | rs144117679 | c.2395N>A | p.Ala799Thr | p.A799T | P22223 | protein_coding | tolerated(0.06) | benign(0.009) | TCGA-D8-A1XY-01 | Breast | breast invasive carcinoma | Female | >=65 | I/II | Chemotherapy | tamoxiphen | SD |
| CDH3 | deletion | In_Frame_Del | novel | c.959_964delNNNNNN | p.Ala321_Asn322del | p.A321_N322del | P22223 | protein_coding | TCGA-A7-A5ZX-01 | Breast | breast invasive carcinoma | Female | <65 | III/IV | Chemotherapy | doxorubicin | CR | ||
| CDH3 | insertion | Nonsense_Mutation | novel | c.1348_1349insCCCATTAGATGTGCACTCAGGAAACACGGGAGTGTTTATGTTACAG | p.Gln450ProfsTer3 | p.Q450Pfs*3 | P22223 | protein_coding | TCGA-B6-A0IK-01 | Breast | breast invasive carcinoma | Female | <65 | III/IV | Unknown | Unknown | PD | ||
| CDH3 | insertion | Nonsense_Mutation | novel | c.2447_2448insTATTCATTTATTCAACACATATAGCAGTTGAATA | p.Lys817IlefsTer10 | p.K817Ifs*10 | P22223 | protein_coding | TCGA-BH-A0EE-01 | Breast | breast invasive carcinoma | Female | >=65 | I/II | Chemotherapy | docetaxel | SD | ||
| CDH3 | SNV | Missense_Mutation | rs371492322 | c.2177C>T | p.Pro726Leu | p.P726L | P22223 | protein_coding | deleterious(0) | probably_damaging(0.999) | TCGA-2W-A8YY-01 | Cervix | cervical & endocervical cancer | Female | <65 | I/II | Chemotherapy | cisplatin | CR |
| CDH3 | SNV | Missense_Mutation | novel | c.1601N>C | p.Leu534Pro | p.L534P | P22223 | protein_coding | deleterious(0) | probably_damaging(1) | TCGA-A6-6651-01 | Colorectum | colon adenocarcinoma | Female | <65 | III/IV | Ancillary | leucovorin | SD |
| CDH3 | SNV | Missense_Mutation | c.1182N>T | p.Lys394Asn | p.K394N | P22223 | protein_coding | deleterious(0) | probably_damaging(0.952) | TCGA-AA-3663-01 | Colorectum | colon adenocarcinoma | Male | <65 | I/II | Unknown | Unknown | SD | |
| CDH3 | SNV | Missense_Mutation | rs200463078 | c.437N>T | p.Thr146Met | p.T146M | P22223 | protein_coding | deleterious(0) | probably_damaging(0.999) | TCGA-AA-3679-01 | Colorectum | colon adenocarcinoma | Male | <65 | III/IV | Chemotherapy | folinic | SD |
| CDH3 | SNV | Missense_Mutation | c.1093N>C | p.Thr365Pro | p.T365P | P22223 | protein_coding | deleterious(0.03) | possibly_damaging(0.511) | TCGA-AA-3930-01 | Colorectum | colon adenocarcinoma | Male | >=65 | III/IV | Chemotherapy | capecitabine | PD | |
| CDH3 | SNV | Missense_Mutation | rs868118578 | c.1621N>A | p.Val541Ile | p.V541I | P22223 | protein_coding | tolerated(0.39) | benign(0.001) | TCGA-AA-A00N-01 | Colorectum | colon adenocarcinoma | Male | >=65 | I/II | Unknown | Unknown | PD |
| Page: 1 2 3 4 5 6 7 8 |
Top |
Related drugs of malignant transformation related genes |
| Identification of chemicals and drugs interact with genes involved in malignant transfromation |
| (DGIdb 4.0) |
| Entrez ID | Symbol | Category | Interaction Types | Drug Claim Name | Drug Name | PMIDs |
| 1001 | CDH3 | DRUGGABLE GENOME | PF-3732010 | |||
| 1001 | CDH3 | DRUGGABLE GENOME | PF-06671008 | PF-06671008 |
| Page: 1 |

Copyright 2023-Present -The University of Texas Health Science Center at Houston |