
|
|||||
|
 | |
| |
| |
| |
| |
| |
|
Gene: CDH26 |
Gene summary for CDH26 |
| Gene information | Species | Human | Gene symbol | CDH26 | Gene ID | 60437 |
| Gene name | cadherin 26 | |
| Gene Alias | VR20 | |
| Cytomap | 20q13.33 | |
| Gene Type | protein-coding | GO ID | GO:0001775 | UniProtAcc | Q8IXH8 |
Top |
Malignant transformation analysis |
| Identification of the aberrant gene expression in precancerous and cancerous lesions by comparing the gene expression of stem-like cells in diseased tissues with normal stem cells |
| Entrez ID | Symbol | Replicates | Species | Organ | Tissue | Adj P-value | Log2FC | Malignancy |
| 60437 | CDH26 | LZE4T | Human | Esophagus | ESCC | 4.53e-04 | 1.60e-01 | 0.0811 |
| 60437 | CDH26 | LZE5T | Human | Esophagus | ESCC | 1.00e-09 | 5.59e-01 | 0.0514 |
| 60437 | CDH26 | P1T-E | Human | Esophagus | ESCC | 7.11e-04 | 3.62e-01 | 0.0875 |
| 60437 | CDH26 | P5T-E | Human | Esophagus | ESCC | 3.66e-04 | 7.39e-02 | 0.1327 |
| 60437 | CDH26 | P8T-E | Human | Esophagus | ESCC | 2.20e-17 | 3.04e-01 | 0.0889 |
| 60437 | CDH26 | P12T-E | Human | Esophagus | ESCC | 3.50e-02 | 8.08e-02 | 0.1122 |
| 60437 | CDH26 | P23T-E | Human | Esophagus | ESCC | 6.05e-08 | 2.40e-01 | 0.108 |
| 60437 | CDH26 | P26T-E | Human | Esophagus | ESCC | 3.07e-02 | 1.11e-01 | 0.1276 |
| 60437 | CDH26 | P39T-E | Human | Esophagus | ESCC | 9.44e-07 | 2.04e-01 | 0.0894 |
| 60437 | CDH26 | P47T-E | Human | Esophagus | ESCC | 4.31e-06 | 1.31e-01 | 0.1067 |
| 60437 | CDH26 | P48T-E | Human | Esophagus | ESCC | 3.50e-02 | 9.62e-02 | 0.0959 |
| 60437 | CDH26 | P54T-E | Human | Esophagus | ESCC | 1.34e-09 | 2.96e-01 | 0.0975 |
| 60437 | CDH26 | P61T-E | Human | Esophagus | ESCC | 3.11e-12 | 2.83e-01 | 0.099 |
| 60437 | CDH26 | P74T-E | Human | Esophagus | ESCC | 4.85e-08 | 2.36e-01 | 0.1479 |
| 60437 | CDH26 | P75T-E | Human | Esophagus | ESCC | 1.76e-12 | 2.86e-01 | 0.1125 |
| 60437 | CDH26 | P76T-E | Human | Esophagus | ESCC | 2.63e-03 | 7.37e-02 | 0.1207 |
| 60437 | CDH26 | P83T-E | Human | Esophagus | ESCC | 1.35e-05 | 1.93e-01 | 0.1738 |
| 60437 | CDH26 | P84T-E | Human | Esophagus | ESCC | 8.33e-03 | 2.42e-01 | 0.0933 |
| 60437 | CDH26 | P127T-E | Human | Esophagus | ESCC | 1.80e-08 | 1.83e-01 | 0.0826 |
| 60437 | CDH26 | P128T-E | Human | Esophagus | ESCC | 6.78e-38 | 1.22e+00 | 0.1241 |
| Page: 1 |
| Tissue | Expression Dynamics | Abbreviation |
| Esophagus | 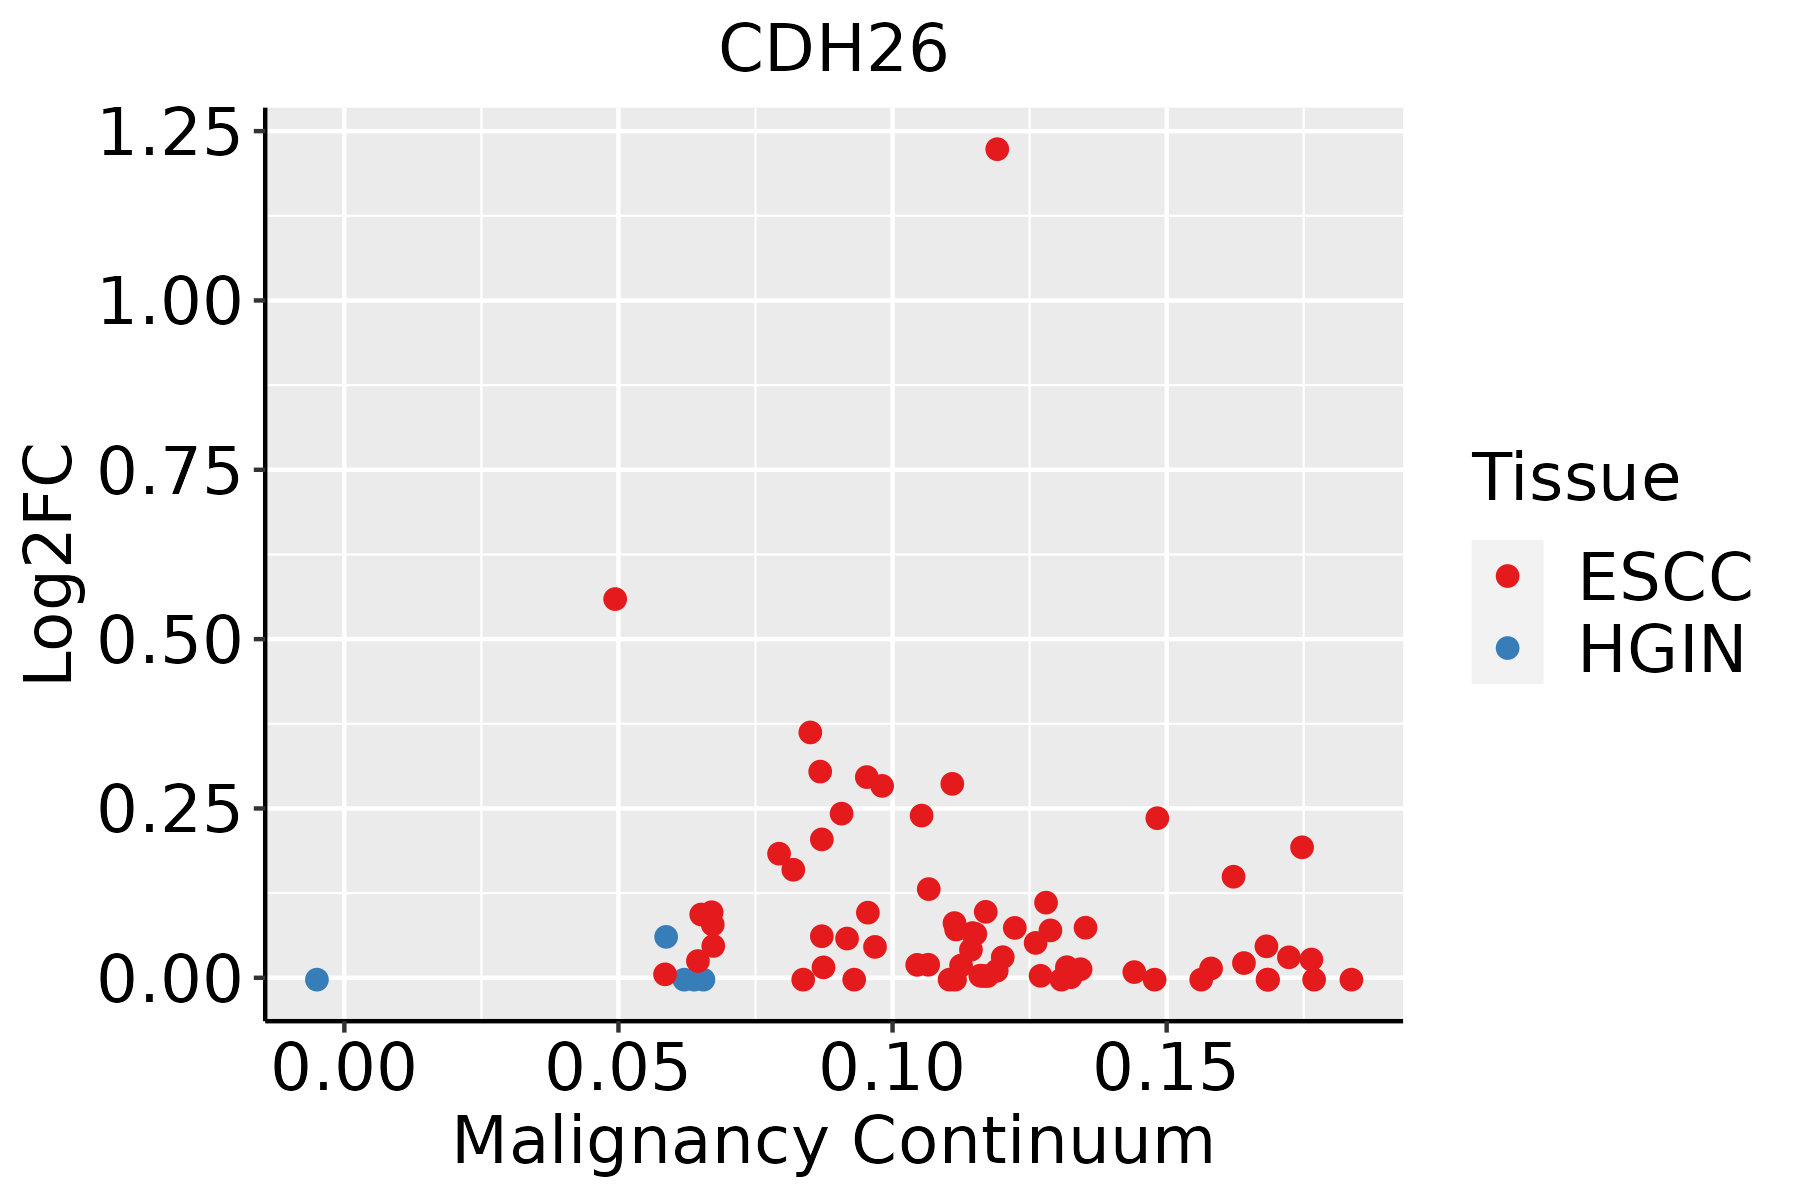 | ESCC: Esophageal squamous cell carcinoma |
| HGIN: High-grade intraepithelial neoplasias | ||
| LGIN: Low-grade intraepithelial neoplasias |
| ∗log2FC in expression of this searched gene in stem-like cells from each diseased tissue sample relative to stem-like cells in normal samples in each tissue plotted against the malignancy continuum. Samples are colored based on if they are from different disease stage. |
Top |
Malignant transformation related pathway analysis |
| Find out the enriched GO biological processes and KEGG pathways involved in transition from healthy to precancer to cancer |
| Tissue | Disease Stage | Enriched GO biological Processes |
| Colorectum | AD |  |
| Colorectum | SER |  |
| Colorectum | MSS |  |
| Colorectum | MSI-H |  |
| Colorectum | FAP |  |
| ∗Top 15 enriched GO BP terms are showed in the bar plot of each disease state in each tissue. Each row represents a significant GO biological process which is colored according to the -log10(p.adjust). |
| Page: 1 2 3 4 5 6 7 8 9 |
| GO ID | Tissue | Disease Stage | Description | Gene Ratio | Bg Ratio | pvalue | p.adjust | Count |
| GO:004211018 | Esophagus | ESCC | T cell activation | 256/8552 | 487/18723 | 1.18e-03 | 5.87e-03 | 256 |
| Page: 1 |
| Pathway ID | Tissue | Disease Stage | Description | Gene Ratio | Bg Ratio | pvalue | p.adjust | qvalue | Count |
| Page: 1 |
Top |
Cell-cell communication analysis |
| Identification of potential cell-cell interactions between two cell types and their ligand-receptor pairs for different disease states |
| Ligand | Receptor | LRpair | Pathway | Tissue | Disease Stage |
| Page: 1 |
Top |
Single-cell gene regulatory network inference analysis |
| Find out the significant the regulons (TFs) and the target genes of each regulon across cell types for different disease states |
| TF | Cell Type | Tissue | Disease Stage | Target Gene | RSS | Regulon Activity |
| ∗The dot plots of a searched regulon are shown for all cell subpopulations in each disease state of each tissue based on the regulon specific score inferred using pySCENIC and by calculating the average expression. |
| Page: 1 |
Top |
Somatic mutation of malignant transformation related genes |
| Annotation of somatic variants for genes involved in malignant transformation |
| Hugo Symbol | Variant Class | Variant Classification | dbSNP RS | HGVSc | HGVSp | HGVSp Short | SWISSPROT | BIOTYPE | SIFT | PolyPhen | Tumor Sample Barcode | Tissue | Histology | Sex | Age | Stage | Therapy Types | Drugs | Outcome |
| CDH26 | SNV | Missense_Mutation | novel | c.341N>A | p.Gly114Glu | p.G114E | Q8IXH8 | protein_coding | deleterious(0) | probably_damaging(0.999) | TCGA-A7-A13D-01 | Breast | breast invasive carcinoma | Female | <65 | I/II | Chemotherapy | cytoxan | SD |
| CDH26 | SNV | Missense_Mutation | novel | c.328N>C | p.Asp110His | p.D110H | Q8IXH8 | protein_coding | deleterious(0) | possibly_damaging(0.905) | TCGA-A7-A6VY-01 | Breast | breast invasive carcinoma | Female | <65 | I/II | Chemotherapy | cyclophosphamide | CR |
| CDH26 | SNV | Missense_Mutation | rs770366539 | c.359N>A | p.Arg120His | p.R120H | Q8IXH8 | protein_coding | deleterious(0) | probably_damaging(0.988) | TCGA-A8-A08S-01 | Breast | breast invasive carcinoma | Female | >=65 | I/II | Hormone Therapy | anastrozole | SD |
| CDH26 | SNV | Missense_Mutation | c.1782N>G | p.Ile594Met | p.I594M | Q8IXH8 | protein_coding | deleterious(0.01) | benign(0.391) | TCGA-BH-A0H7-01 | Breast | breast invasive carcinoma | Female | >=65 | III/IV | Chemotherapy | doxorubicin | SD | |
| CDH26 | SNV | Missense_Mutation | c.1038N>C | p.Glu346Asp | p.E346D | Q8IXH8 | protein_coding | tolerated(0.06) | probably_damaging(0.937) | TCGA-BH-A18L-01 | Breast | breast invasive carcinoma | Female | <65 | III/IV | Unknown | Unknown | SD | |
| CDH26 | SNV | Missense_Mutation | novel | c.1095C>G | p.Phe365Leu | p.F365L | Q8IXH8 | protein_coding | tolerated(0.66) | benign(0) | TCGA-OL-A5RW-01 | Breast | breast invasive carcinoma | Female | <65 | I/II | Chemotherapy | adriamycin | CR |
| CDH26 | insertion | Frame_Shift_Ins | novel | c.1477_1478insT | p.Asn494GlnfsTer2 | p.N494Qfs*2 | Q8IXH8 | protein_coding | TCGA-A8-A0A4-01 | Breast | breast invasive carcinoma | Female | >=65 | I/II | Hormone Therapy | tamoxiphen | CR | ||
| CDH26 | insertion | Frame_Shift_Ins | novel | c.1479_1480insACGCTGTTGATGATGGTGAGTGTTTACCCAA | p.Asn494ThrfsTer12 | p.N494Tfs*12 | Q8IXH8 | protein_coding | TCGA-A8-A0A4-01 | Breast | breast invasive carcinoma | Female | >=65 | I/II | Hormone Therapy | tamoxiphen | CR | ||
| CDH26 | insertion | Nonsense_Mutation | novel | c.2468_2469insGGGAGAAAGGAGCCCACAGCAAGAGGCCAGGTAAAGATG | p.Glu823_Ile824insGlyGluArgSerProGlnGlnGluAlaArgTerArgTer | p.E823_I824insGERSPQQEAR*R* | Q8IXH8 | protein_coding | TCGA-BH-A0HF-01 | Breast | breast invasive carcinoma | Female | >=65 | I/II | Hormone Therapy | arimidex | SD | ||
| CDH26 | deletion | Frame_Shift_Del | novel | c.1850delN | p.Leu618CysfsTer116 | p.L618Cfs*116 | Q8IXH8 | protein_coding | TCGA-D8-A27V-01 | Breast | breast invasive carcinoma | Female | <65 | I/II | Hormone Therapy | tamoxiphen | SD |
| Page: 1 2 3 4 5 6 7 8 9 10 11 12 |
Top |
Related drugs of malignant transformation related genes |
| Identification of chemicals and drugs interact with genes involved in malignant transfromation |
| (DGIdb 4.0) |
| Entrez ID | Symbol | Category | Interaction Types | Drug Claim Name | Drug Name | PMIDs |
| Page: 1 |

Copyright 2023-Present -The University of Texas Health Science Center at Houston |