
|
|||||
|
 | |
| |
| |
| |
| |
| |
|
Gene: CDH17 |
Gene summary for CDH17 |
| Gene information | Species | Human | Gene symbol | CDH17 | Gene ID | 1015 |
| Gene name | cadherin 17 | |
| Gene Alias | CDH16 | |
| Cytomap | 8q22.1 | |
| Gene Type | protein-coding | GO ID | GO:0001775 | UniProtAcc | Q12864 |
Top |
Malignant transformation analysis |
| Identification of the aberrant gene expression in precancerous and cancerous lesions by comparing the gene expression of stem-like cells in diseased tissues with normal stem cells |
| Entrez ID | Symbol | Replicates | Species | Organ | Tissue | Adj P-value | Log2FC | Malignancy |
| 1015 | CDH17 | HTA11_3410_2000001011 | Human | Colorectum | AD | 8.40e-11 | -4.06e-01 | 0.0155 |
| 1015 | CDH17 | HTA11_2487_2000001011 | Human | Colorectum | SER | 3.71e-06 | 7.00e-01 | -0.1808 |
| 1015 | CDH17 | HTA11_1938_2000001011 | Human | Colorectum | AD | 2.49e-20 | 1.13e+00 | -0.0811 |
| 1015 | CDH17 | HTA11_78_2000001011 | Human | Colorectum | AD | 1.69e-23 | 1.27e+00 | -0.1088 |
| 1015 | CDH17 | HTA11_347_2000001011 | Human | Colorectum | AD | 3.34e-52 | 1.49e+00 | -0.1954 |
| 1015 | CDH17 | HTA11_411_2000001011 | Human | Colorectum | SER | 4.89e-11 | 1.33e+00 | -0.2602 |
| 1015 | CDH17 | HTA11_2112_2000001011 | Human | Colorectum | SER | 3.02e-05 | 7.54e-01 | -0.2196 |
| 1015 | CDH17 | HTA11_83_2000001011 | Human | Colorectum | SER | 5.54e-14 | 8.53e-01 | -0.1526 |
| 1015 | CDH17 | HTA11_696_2000001011 | Human | Colorectum | AD | 2.22e-04 | 4.18e-01 | -0.1464 |
| 1015 | CDH17 | HTA11_1391_2000001011 | Human | Colorectum | AD | 4.03e-10 | 9.53e-01 | -0.059 |
| 1015 | CDH17 | HTA11_5212_2000001011 | Human | Colorectum | AD | 7.39e-05 | 6.64e-01 | -0.2061 |
| 1015 | CDH17 | HTA11_6801_2000001011 | Human | Colorectum | SER | 2.03e-02 | 7.06e-01 | 0.0171 |
| 1015 | CDH17 | HTA11_7469_2000001011 | Human | Colorectum | AD | 2.98e-04 | 7.17e-01 | -0.0124 |
| 1015 | CDH17 | HTA11_99999965104_69814 | Human | Colorectum | MSS | 9.40e-04 | 5.30e-01 | 0.281 |
| 1015 | CDH17 | HTA11_99999971662_82457 | Human | Colorectum | MSS | 5.63e-13 | 1.02e+00 | 0.3859 |
| 1015 | CDH17 | A001-C-207 | Human | Colorectum | FAP | 1.74e-02 | -8.95e-03 | 0.1278 |
| 1015 | CDH17 | A015-C-203 | Human | Colorectum | FAP | 8.99e-30 | -3.60e-01 | -0.1294 |
| 1015 | CDH17 | A015-C-204 | Human | Colorectum | FAP | 8.80e-07 | -5.47e-02 | -0.0228 |
| 1015 | CDH17 | A014-C-040 | Human | Colorectum | FAP | 8.37e-06 | -4.12e-01 | -0.1184 |
| 1015 | CDH17 | A002-C-201 | Human | Colorectum | FAP | 1.94e-10 | -1.93e-01 | 0.0324 |
| Page: 1 2 3 |
| Tissue | Expression Dynamics | Abbreviation |
| Colorectum (GSE201348) |  | FAP: Familial adenomatous polyposis |
| CRC: Colorectal cancer | ||
| Colorectum (HTA11) |  | AD: Adenomas |
| SER: Sessile serrated lesions | ||
| MSI-H: Microsatellite-high colorectal cancer | ||
| MSS: Microsatellite stable colorectal cancer | ||
| GC | 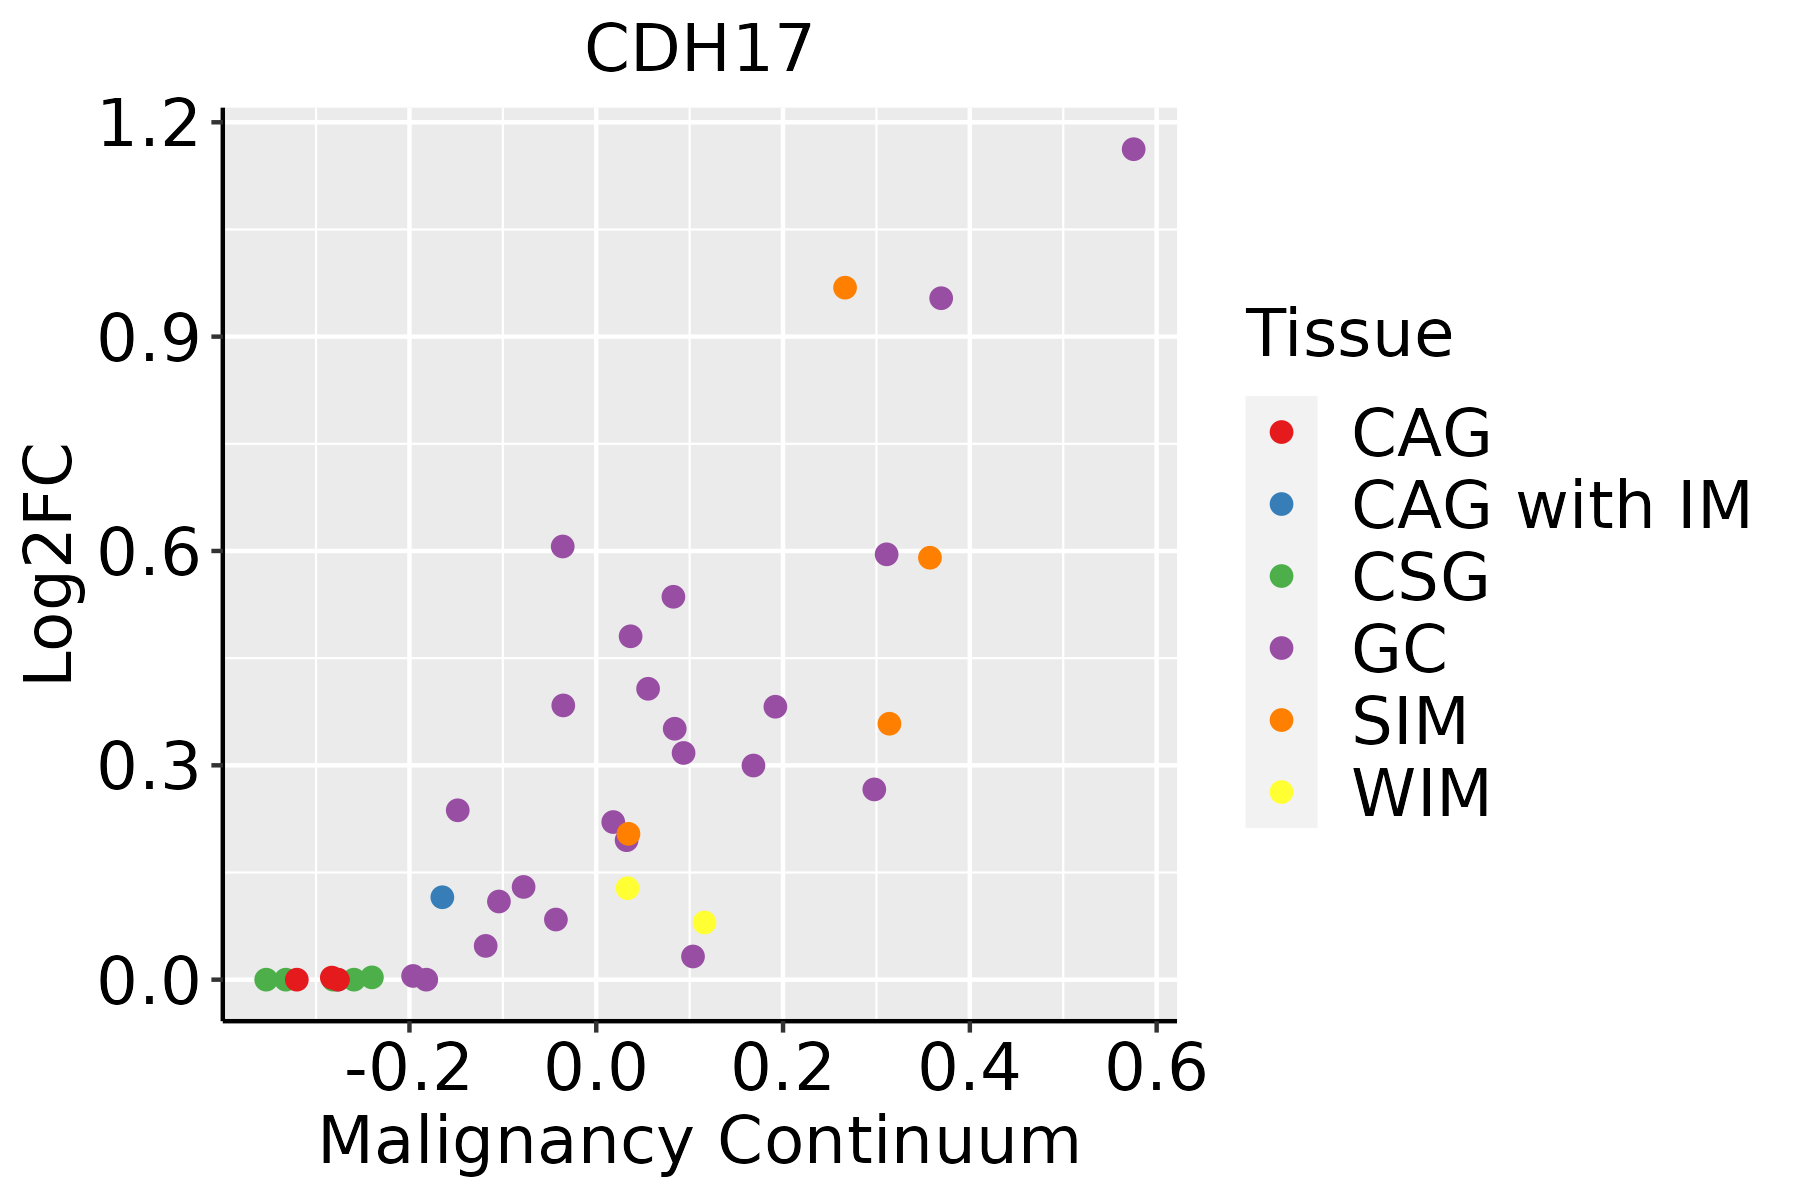 | CAG: Chronic atrophic gastritis |
| CAG with IM: Chronic atrophic gastritis with intestinal metaplasia | ||
| CSG: Chronic superficial gastritis | ||
| GC: Gastric cancer | ||
| SIM: Severe intestinal metaplasia | ||
| WIM: Wild intestinal metaplasia |
| ∗log2FC in expression of this searched gene in stem-like cells from each diseased tissue sample relative to stem-like cells in normal samples in each tissue plotted against the malignancy continuum. Samples are colored based on if they are from different disease stage. |
Top |
Malignant transformation related pathway analysis |
| Find out the enriched GO biological processes and KEGG pathways involved in transition from healthy to precancer to cancer |
| Tissue | Disease Stage | Enriched GO biological Processes |
| Colorectum | AD |  |
| Colorectum | SER |  |
| Colorectum | MSS |  |
| Colorectum | MSI-H |  |
| Colorectum | FAP |  |
| ∗Top 15 enriched GO BP terms are showed in the bar plot of each disease state in each tissue. Each row represents a significant GO biological process which is colored according to the -log10(p.adjust). |
| Page: 1 2 3 4 5 6 7 8 9 |
| GO ID | Tissue | Disease Stage | Description | Gene Ratio | Bg Ratio | pvalue | p.adjust | Count |
| GO:0043254 | Colorectum | AD | regulation of protein-containing complex assembly | 148/3918 | 428/18723 | 2.64e-11 | 3.18e-09 | 148 |
| GO:0031334 | Colorectum | AD | positive regulation of protein-containing complex assembly | 91/3918 | 237/18723 | 4.78e-10 | 3.99e-08 | 91 |
| GO:0015833 | Colorectum | AD | peptide transport | 77/3918 | 264/18723 | 8.90e-04 | 8.60e-03 | 77 |
| GO:0042886 | Colorectum | AD | amide transport | 83/3918 | 301/18723 | 3.37e-03 | 2.46e-02 | 83 |
| GO:00432541 | Colorectum | SER | regulation of protein-containing complex assembly | 119/2897 | 428/18723 | 3.34e-11 | 5.86e-09 | 119 |
| GO:00313341 | Colorectum | SER | positive regulation of protein-containing complex assembly | 73/2897 | 237/18723 | 1.89e-09 | 1.84e-07 | 73 |
| GO:00158331 | Colorectum | SER | peptide transport | 58/2897 | 264/18723 | 3.08e-03 | 2.70e-02 | 58 |
| GO:00432542 | Colorectum | MSS | regulation of protein-containing complex assembly | 130/3467 | 428/18723 | 1.38e-09 | 1.03e-07 | 130 |
| GO:00313342 | Colorectum | MSS | positive regulation of protein-containing complex assembly | 82/3467 | 237/18723 | 2.49e-09 | 1.75e-07 | 82 |
| GO:00158332 | Colorectum | MSS | peptide transport | 71/3467 | 264/18723 | 4.79e-04 | 5.60e-03 | 71 |
| GO:00428861 | Colorectum | MSS | amide transport | 76/3467 | 301/18723 | 2.14e-03 | 1.80e-02 | 76 |
| GO:00432544 | Colorectum | FAP | regulation of protein-containing complex assembly | 101/2622 | 428/18723 | 5.18e-08 | 4.07e-06 | 101 |
| GO:00313344 | Colorectum | FAP | positive regulation of protein-containing complex assembly | 62/2622 | 237/18723 | 5.03e-07 | 2.61e-05 | 62 |
| GO:0007229 | Colorectum | FAP | integrin-mediated signaling pathway | 30/2622 | 107/18723 | 1.10e-04 | 1.81e-03 | 30 |
| GO:00158333 | Colorectum | FAP | peptide transport | 58/2622 | 264/18723 | 2.71e-04 | 3.64e-03 | 58 |
| GO:00428862 | Colorectum | FAP | amide transport | 62/2622 | 301/18723 | 1.01e-03 | 9.93e-03 | 62 |
| GO:1903131 | Colorectum | FAP | mononuclear cell differentiation | 79/2622 | 426/18723 | 5.00e-03 | 3.33e-02 | 79 |
| GO:00432545 | Colorectum | CRC | regulation of protein-containing complex assembly | 87/2078 | 428/18723 | 1.38e-08 | 2.67e-06 | 87 |
| GO:00313345 | Colorectum | CRC | positive regulation of protein-containing complex assembly | 51/2078 | 237/18723 | 2.42e-06 | 1.15e-04 | 51 |
| GO:00072291 | Colorectum | CRC | integrin-mediated signaling pathway | 24/2078 | 107/18723 | 5.65e-04 | 7.79e-03 | 24 |
| Page: 1 2 |
| Pathway ID | Tissue | Disease Stage | Description | Gene Ratio | Bg Ratio | pvalue | p.adjust | qvalue | Count |
| Page: 1 |
Top |
Cell-cell communication analysis |
| Identification of potential cell-cell interactions between two cell types and their ligand-receptor pairs for different disease states |
| Ligand | Receptor | LRpair | Pathway | Tissue | Disease Stage |
| Page: 1 |
Top |
Single-cell gene regulatory network inference analysis |
| Find out the significant the regulons (TFs) and the target genes of each regulon across cell types for different disease states |
| TF | Cell Type | Tissue | Disease Stage | Target Gene | RSS | Regulon Activity |
| ∗The dot plots of a searched regulon are shown for all cell subpopulations in each disease state of each tissue based on the regulon specific score inferred using pySCENIC and by calculating the average expression. |
| Page: 1 |
Top |
Somatic mutation of malignant transformation related genes |
| Annotation of somatic variants for genes involved in malignant transformation |
| Hugo Symbol | Variant Class | Variant Classification | dbSNP RS | HGVSc | HGVSp | HGVSp Short | SWISSPROT | BIOTYPE | SIFT | PolyPhen | Tumor Sample Barcode | Tissue | Histology | Sex | Age | Stage | Therapy Types | Drugs | Outcome |
| CDH17 | SNV | Missense_Mutation | novel | c.655C>G | p.Gln219Glu | p.Q219E | Q12864 | protein_coding | tolerated(0.64) | benign(0.007) | TCGA-A2-A0CP-01 | Breast | breast invasive carcinoma | Female | <65 | I/II | Chemotherapy | cytoxan | SD |
| CDH17 | SNV | Missense_Mutation | novel | c.1492N>A | p.Gly498Arg | p.G498R | Q12864 | protein_coding | tolerated(0.09) | benign(0.304) | TCGA-BH-A0HF-01 | Breast | breast invasive carcinoma | Female | >=65 | I/II | Hormone Therapy | arimidex | SD |
| CDH17 | SNV | Missense_Mutation | novel | c.269N>G | p.Ser90Cys | p.S90C | Q12864 | protein_coding | deleterious(0.01) | benign(0.336) | TCGA-BH-A2L8-01 | Breast | breast invasive carcinoma | Female | <65 | I/II | Chemotherapy | cytoxan | CR |
| CDH17 | SNV | Missense_Mutation | novel | c.1012N>A | p.Pro338Thr | p.P338T | Q12864 | protein_coding | deleterious(0) | probably_damaging(0.989) | TCGA-C8-A12L-01 | Breast | breast invasive carcinoma | Female | >=65 | I/II | Unknown | Unknown | SD |
| CDH17 | SNV | Missense_Mutation | novel | c.1432G>A | p.Asp478Asn | p.D478N | Q12864 | protein_coding | deleterious(0) | probably_damaging(1) | TCGA-C8-A3M7-01 | Breast | breast invasive carcinoma | Female | <65 | III/IV | Unknown | Unknown | PD |
| CDH17 | SNV | Missense_Mutation | c.1311C>G | p.Ile437Met | p.I437M | Q12864 | protein_coding | deleterious(0) | probably_damaging(0.965) | TCGA-E2-A10C-01 | Breast | breast invasive carcinoma | Female | <65 | I/II | Chemotherapy | cytoxan | SD | |
| CDH17 | SNV | Missense_Mutation | novel | c.1656N>C | p.Lys552Asn | p.K552N | Q12864 | protein_coding | tolerated(0.3) | benign(0.124) | TCGA-PE-A5DC-01 | Breast | breast invasive carcinoma | Female | >=65 | III/IV | Unknown | Unknown | SD |
| CDH17 | insertion | Frame_Shift_Ins | rs749875970 | c.1932dupG | p.Ser645ValfsTer18 | p.S645Vfs*18 | Q12864 | protein_coding | TCGA-AO-A0JI-01 | Breast | breast invasive carcinoma | Female | <65 | I/II | Chemotherapy | cyclophosphamide | SD | ||
| CDH17 | insertion | Frame_Shift_Ins | novel | c.160_161insG | p.Asn54ArgfsTer8 | p.N54Rfs*8 | Q12864 | protein_coding | TCGA-AR-A0TY-01 | Breast | breast invasive carcinoma | Female | <65 | I/II | Unspecific | Paclitaxel | PD | ||
| CDH17 | insertion | Frame_Shift_Ins | novel | c.159_160insTACTATGGAAAAAAGAGTGAGATAAA | p.Asn54TyrfsTer14 | p.N54Yfs*14 | Q12864 | protein_coding | TCGA-AR-A0TY-01 | Breast | breast invasive carcinoma | Female | <65 | I/II | Unspecific | Paclitaxel | PD |
| Page: 1 2 3 4 5 6 7 8 9 10 11 |
Top |
Related drugs of malignant transformation related genes |
| Identification of chemicals and drugs interact with genes involved in malignant transfromation |
| (DGIdb 4.0) |
| Entrez ID | Symbol | Category | Interaction Types | Drug Claim Name | Drug Name | PMIDs |
| 1015 | CDH17 | TRANSPORTER, CELL SURFACE | TCDD | 12054747 | ||
| 1015 | CDH17 | TRANSPORTER, CELL SURFACE | DEXAMETHASONE | DEXAMETHASONE | 10760957 | |
| 1015 | CDH17 | TRANSPORTER, CELL SURFACE | SQUALAMINE | SQUALAMINE | 11297269 | |
| 1015 | CDH17 | TRANSPORTER, CELL SURFACE | HGF/SF | 10438566 | ||
| 1015 | CDH17 | TRANSPORTER, CELL SURFACE | CISPLATIN | CISPLATIN | 10381631 |
| Page: 1 |

Copyright 2023-Present -The University of Texas Health Science Center at Houston |