
|
|||||
|
 | |
| |
| |
| |
| |
| |
|
Gene: CDH11 |
Gene summary for CDH11 |
| Gene information | Species | Human | Gene symbol | CDH11 | Gene ID | 1009 |
| Gene name | cadherin 11 | |
| Gene Alias | CAD11 | |
| Cytomap | 16q21 | |
| Gene Type | protein-coding | GO ID | GO:0000902 | UniProtAcc | P55287 |
Top |
Malignant transformation analysis |
| Identification of the aberrant gene expression in precancerous and cancerous lesions by comparing the gene expression of stem-like cells in diseased tissues with normal stem cells |
| Entrez ID | Symbol | Replicates | Species | Organ | Tissue | Adj P-value | Log2FC | Malignancy |
| 1009 | CDH11 | AEH-subject1 | Human | Endometrium | AEH | 4.24e-22 | -5.47e-01 | -0.3059 |
| 1009 | CDH11 | AEH-subject2 | Human | Endometrium | AEH | 1.20e-30 | -5.98e-01 | -0.2525 |
| 1009 | CDH11 | AEH-subject3 | Human | Endometrium | AEH | 9.60e-17 | -5.30e-01 | -0.2576 |
| 1009 | CDH11 | AEH-subject4 | Human | Endometrium | AEH | 2.59e-03 | -1.78e-01 | -0.2657 |
| 1009 | CDH11 | AEH-subject5 | Human | Endometrium | AEH | 1.05e-14 | -5.18e-01 | -0.2953 |
| 1009 | CDH11 | EEC-subject1 | Human | Endometrium | EEC | 1.06e-28 | -5.72e-01 | -0.2682 |
| 1009 | CDH11 | EEC-subject2 | Human | Endometrium | EEC | 1.02e-23 | -5.78e-01 | -0.2607 |
| 1009 | CDH11 | EEC-subject3 | Human | Endometrium | EEC | 1.15e-28 | -5.43e-01 | -0.2525 |
| 1009 | CDH11 | EEC-subject4 | Human | Endometrium | EEC | 4.40e-20 | -5.19e-01 | -0.2571 |
| 1009 | CDH11 | EEC-subject5 | Human | Endometrium | EEC | 9.95e-29 | -5.88e-01 | -0.249 |
| 1009 | CDH11 | GSM5276935 | Human | Endometrium | EEC | 2.48e-30 | -5.91e-01 | -0.123 |
| 1009 | CDH11 | GSM5276937 | Human | Endometrium | EEC | 3.17e-02 | -2.93e-01 | -0.0897 |
| 1009 | CDH11 | GSM6177620_NYU_UCEC1_lib1_lib1 | Human | Endometrium | EEC | 9.29e-28 | -6.04e-01 | -0.1869 |
| 1009 | CDH11 | GSM6177620_NYU_UCEC1_lib2_lib2 | Human | Endometrium | EEC | 8.81e-25 | -6.04e-01 | -0.1875 |
| 1009 | CDH11 | GSM6177620_NYU_UCEC1_lib3_lib3 | Human | Endometrium | EEC | 1.03e-28 | -6.04e-01 | -0.1883 |
| 1009 | CDH11 | GSM6177621_NYU_UCEC2_lib1_lib1 | Human | Endometrium | EEC | 1.01e-22 | -4.93e-01 | -0.1934 |
| 1009 | CDH11 | GSM6177622_NYU_UCEC3_lib1_lib1 | Human | Endometrium | EEC | 4.04e-30 | -5.80e-01 | -0.1917 |
| 1009 | CDH11 | GSM6177622_NYU_UCEC3_lib2_lib2 | Human | Endometrium | EEC | 1.85e-34 | -5.92e-01 | -0.1916 |
| 1009 | CDH11 | GSM6177623_NYU_UCEC3_Vis | Human | Endometrium | EEC | 5.17e-08 | -3.58e-01 | -0.1269 |
| 1009 | CDH11 | P2T-E | Human | Esophagus | ESCC | 1.02e-41 | 8.54e-01 | 0.1177 |
| Page: 1 2 3 4 |
| Tissue | Expression Dynamics | Abbreviation |
| Endometrium |  | AEH: Atypical endometrial hyperplasia |
| EEC: Endometrioid Cancer | ||
| Esophagus | 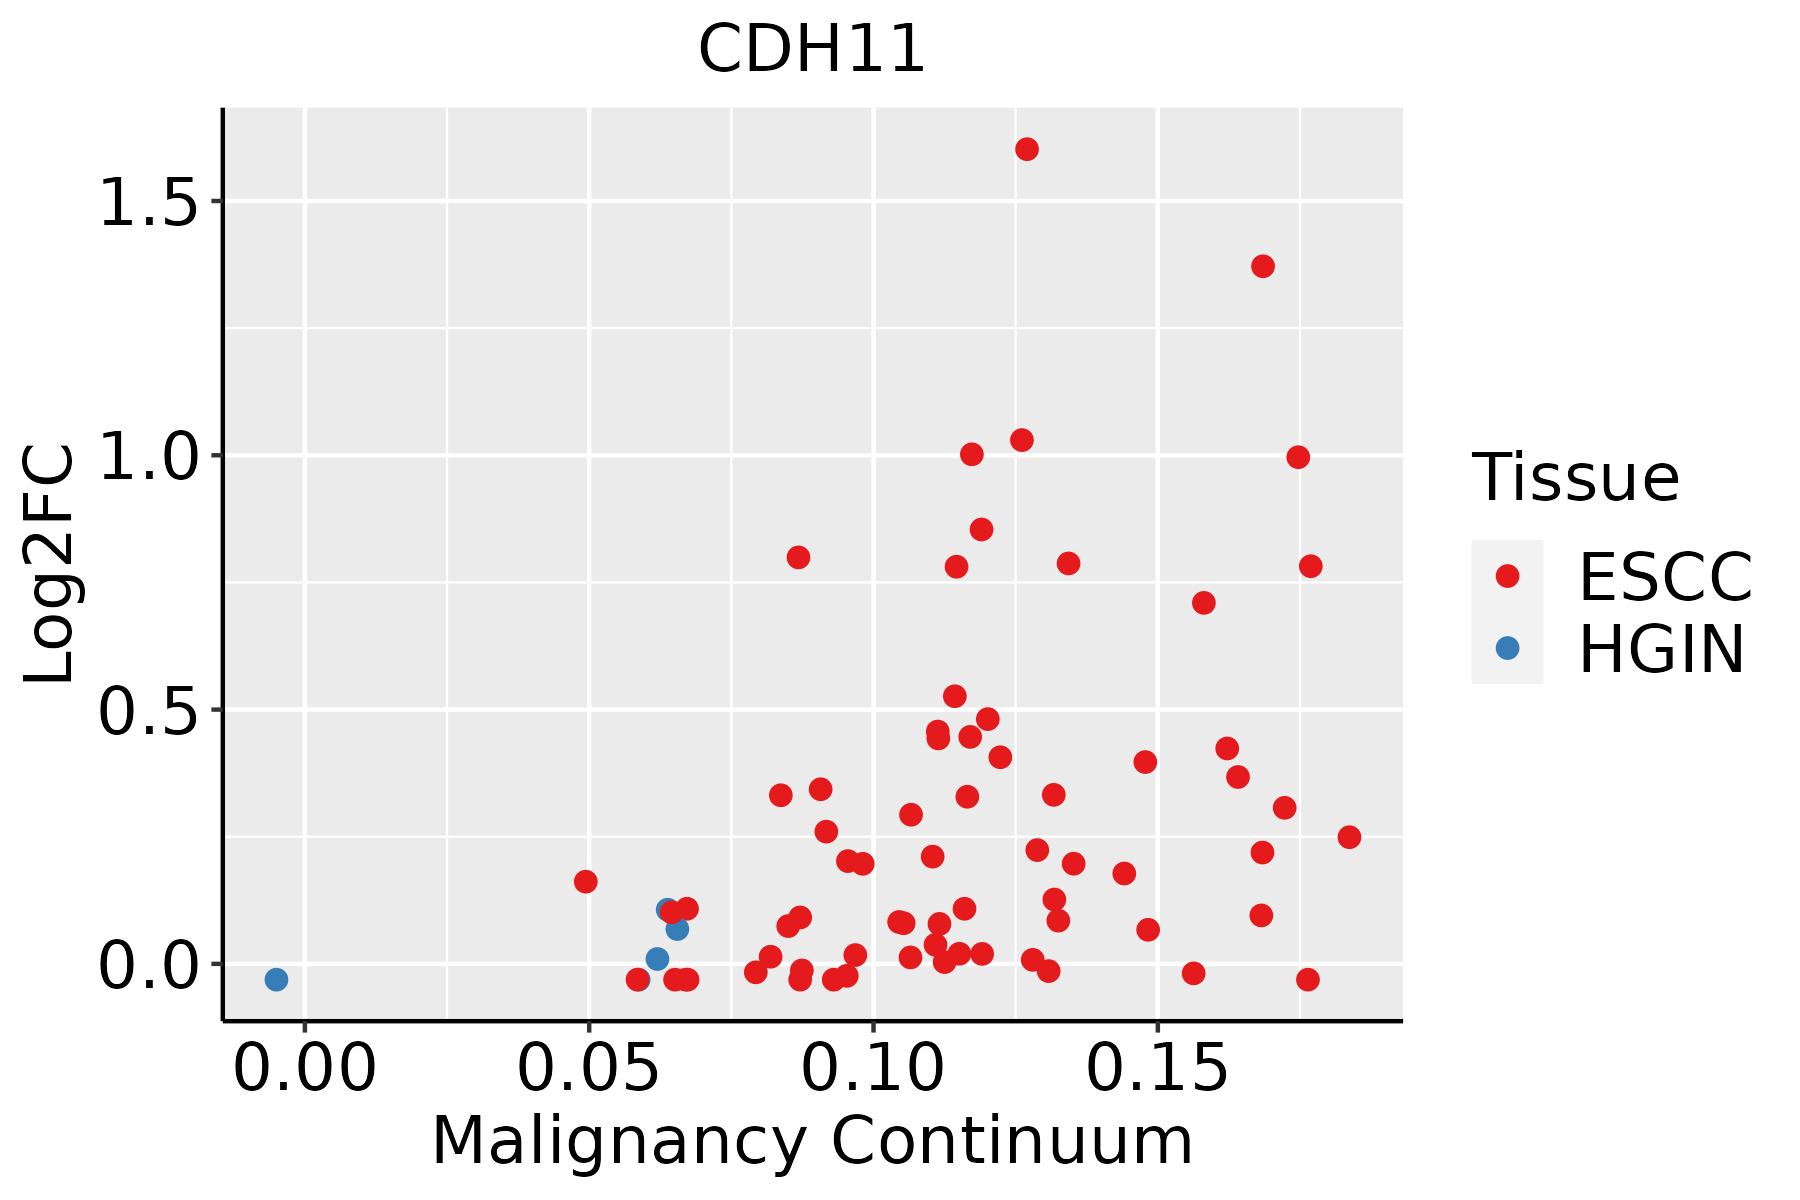 | ESCC: Esophageal squamous cell carcinoma |
| HGIN: High-grade intraepithelial neoplasias | ||
| LGIN: Low-grade intraepithelial neoplasias | ||
| Oral Cavity | 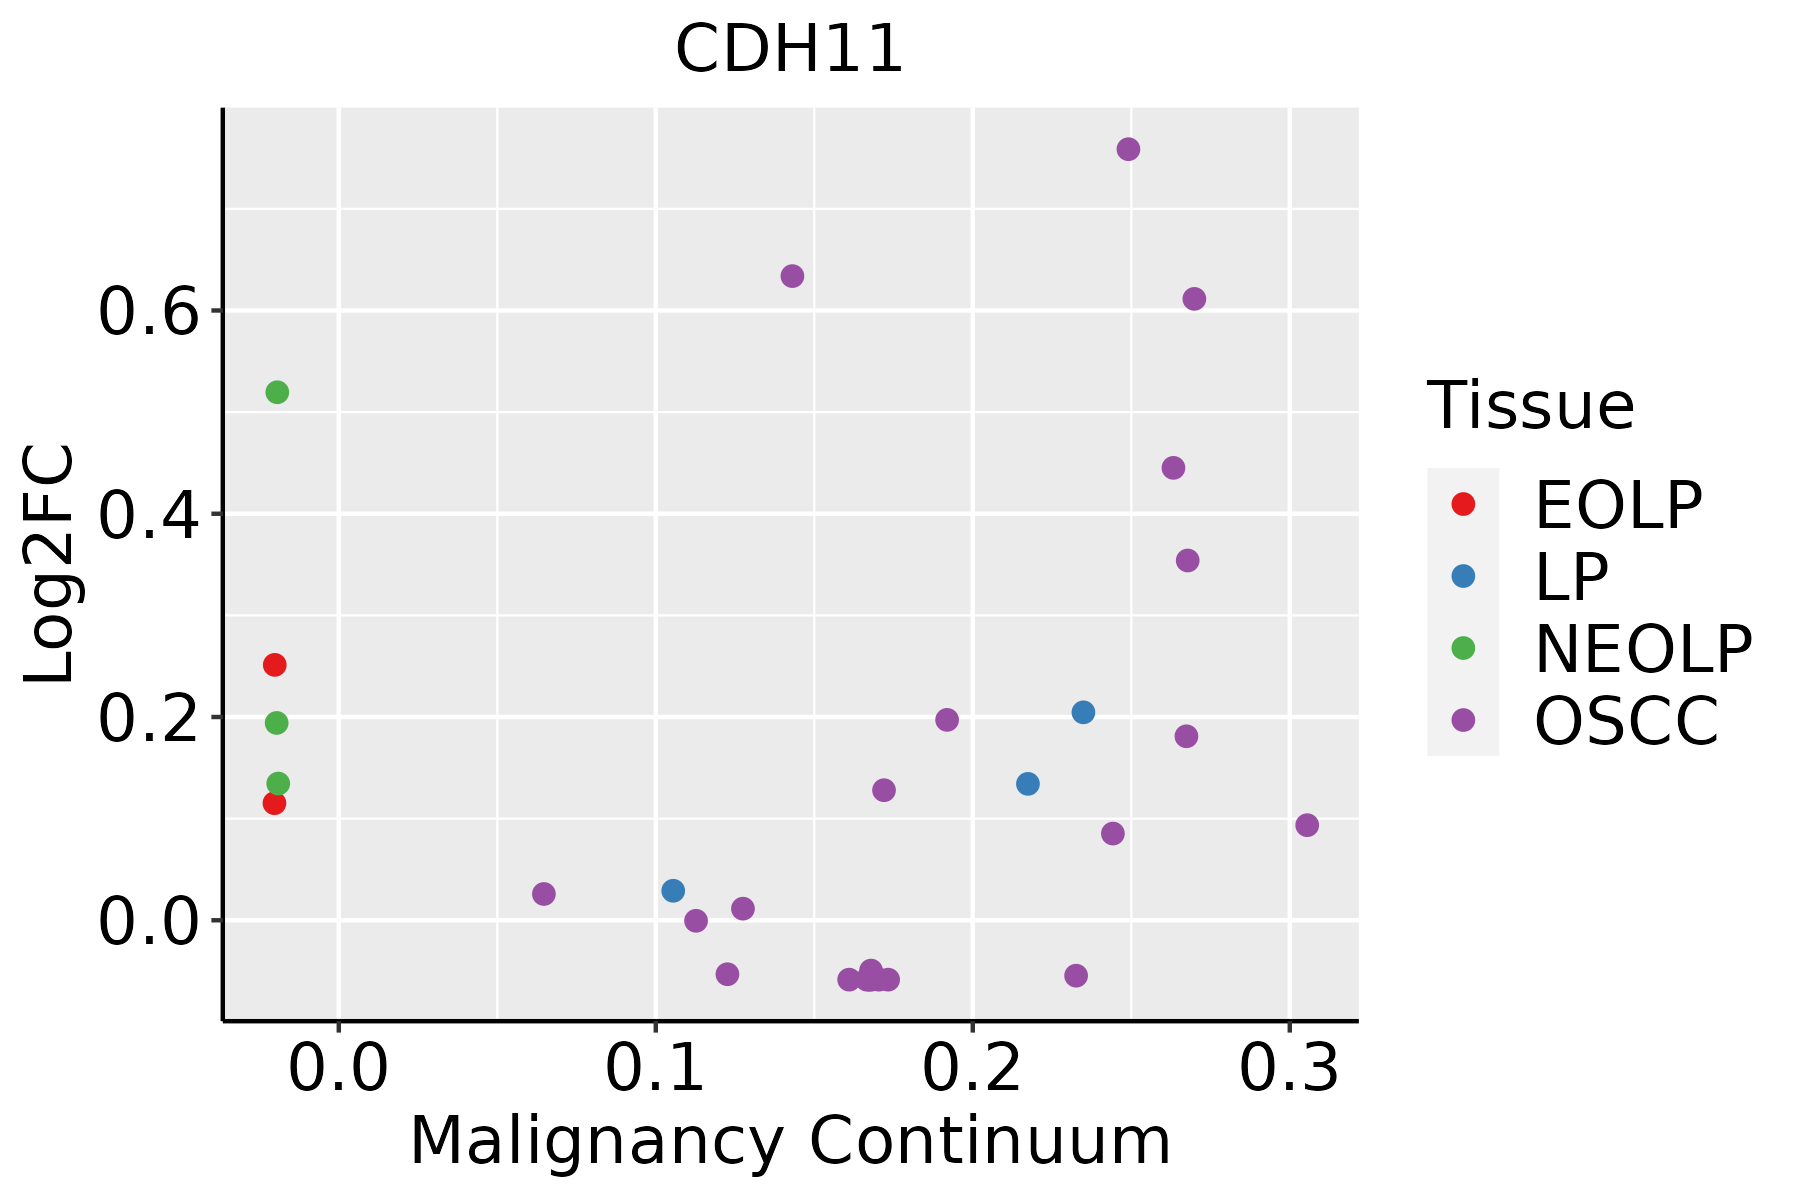 | EOLP: Erosive Oral lichen planus |
| LP: leukoplakia | ||
| NEOLP: Non-erosive oral lichen planus | ||
| OSCC: Oral squamous cell carcinoma | ||
| Thyroid | 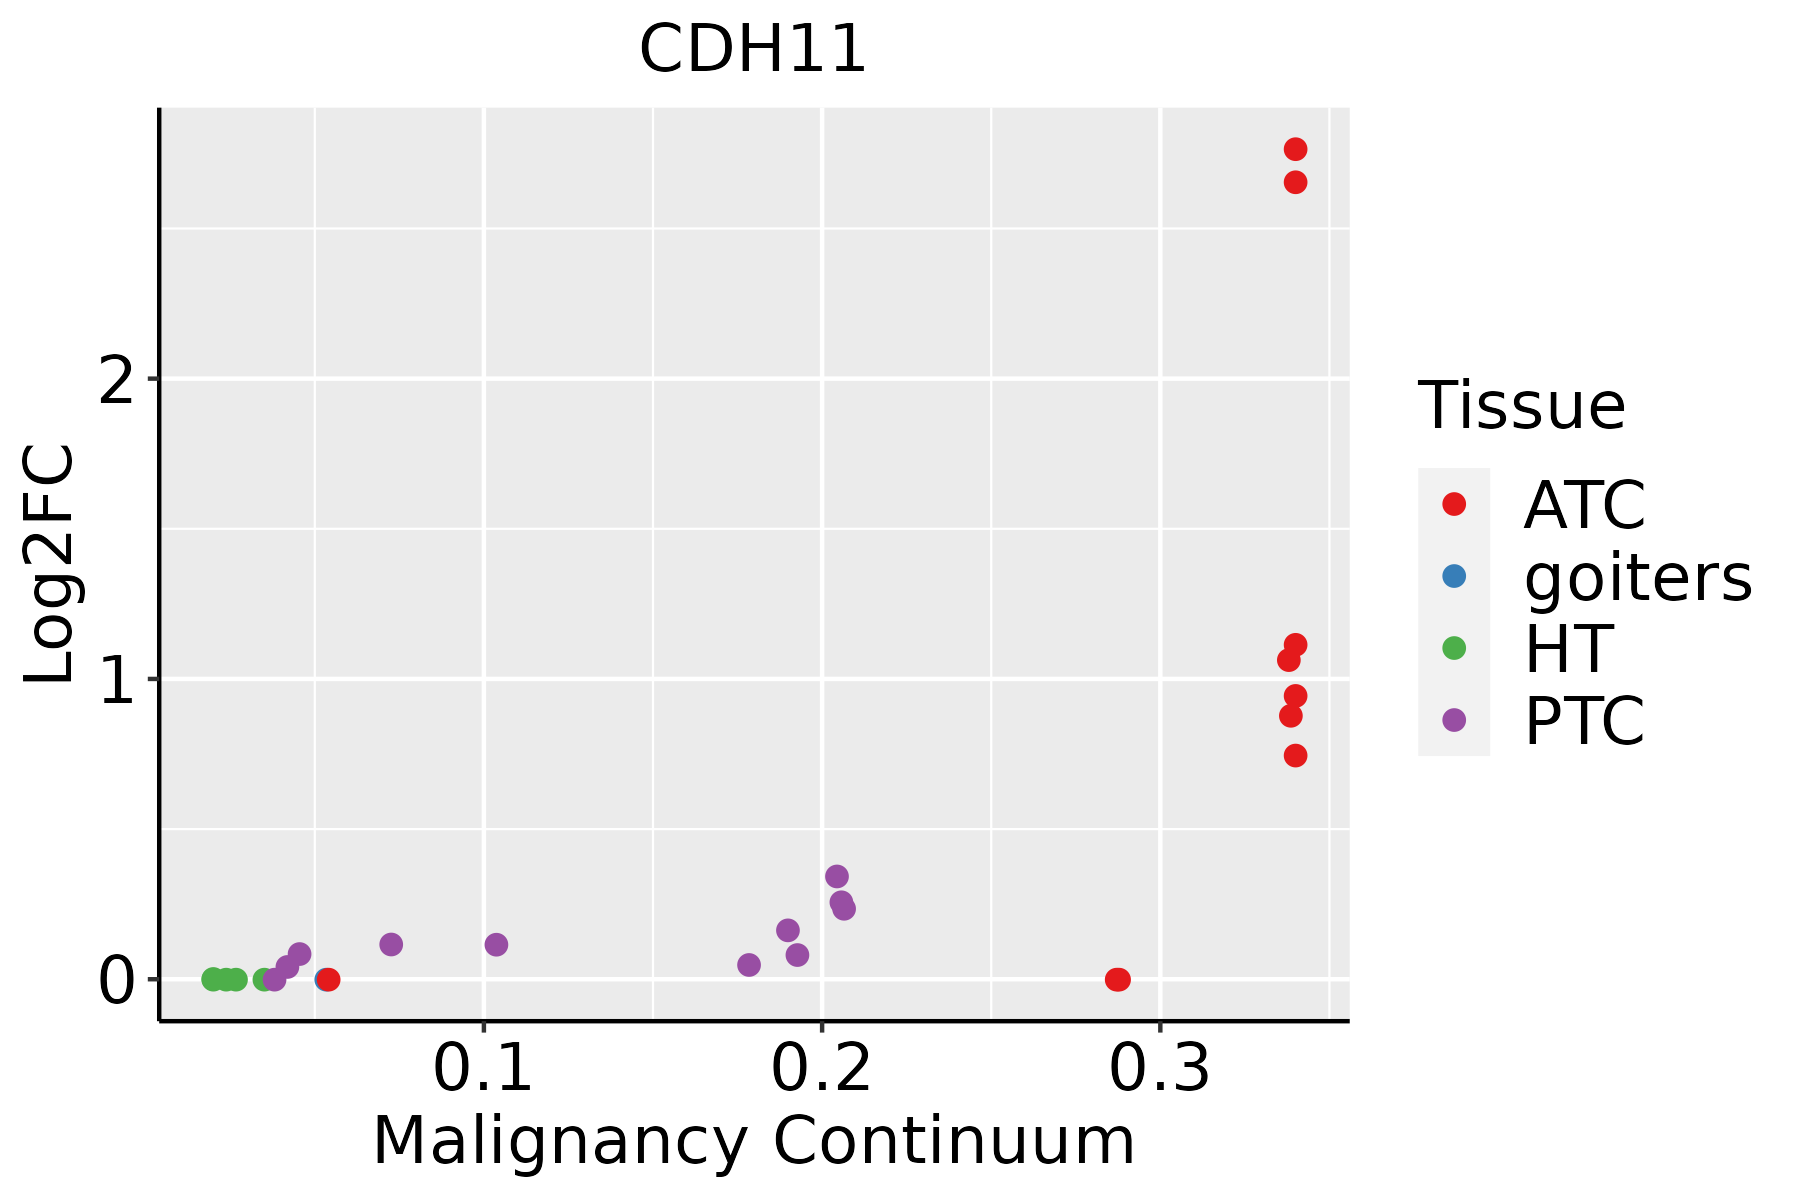 | ATC: Anaplastic thyroid cancer |
| HT: Hashimoto's thyroiditis | ||
| PTC: Papillary thyroid cancer |
| ∗log2FC in expression of this searched gene in stem-like cells from each diseased tissue sample relative to stem-like cells in normal samples in each tissue plotted against the malignancy continuum. Samples are colored based on if they are from different disease stage. |
Top |
Malignant transformation related pathway analysis |
| Find out the enriched GO biological processes and KEGG pathways involved in transition from healthy to precancer to cancer |
| Tissue | Disease Stage | Enriched GO biological Processes |
| Colorectum | AD |  |
| Colorectum | SER |  |
| Colorectum | MSS |  |
| Colorectum | MSI-H |  |
| Colorectum | FAP |  |
| ∗Top 15 enriched GO BP terms are showed in the bar plot of each disease state in each tissue. Each row represents a significant GO biological process which is colored according to the -log10(p.adjust). |
| Page: 1 2 3 4 5 6 7 8 9 |
| GO ID | Tissue | Disease Stage | Description | Gene Ratio | Bg Ratio | pvalue | p.adjust | Count |
| GO:00074098 | Endometrium | AEH | axonogenesis | 81/2100 | 418/18723 | 5.54e-07 | 2.12e-05 | 81 |
| GO:00615648 | Endometrium | AEH | axon development | 88/2100 | 467/18723 | 6.39e-07 | 2.38e-05 | 88 |
| GO:00015038 | Endometrium | AEH | ossification | 78/2100 | 408/18723 | 1.54e-06 | 4.85e-05 | 78 |
| GO:00343299 | Endometrium | AEH | cell junction assembly | 78/2100 | 420/18723 | 4.80e-06 | 1.24e-04 | 78 |
| GO:004521610 | Endometrium | AEH | cell-cell junction organization | 42/2100 | 200/18723 | 4.26e-05 | 7.20e-04 | 42 |
| GO:000704310 | Endometrium | AEH | cell-cell junction assembly | 30/2100 | 146/18723 | 7.29e-04 | 6.98e-03 | 30 |
| GO:00343327 | Endometrium | AEH | adherens junction organization | 12/2100 | 49/18723 | 6.75e-03 | 3.94e-02 | 12 |
| GO:006156412 | Endometrium | EEC | axon development | 93/2168 | 467/18723 | 9.60e-08 | 4.69e-06 | 93 |
| GO:000740912 | Endometrium | EEC | axonogenesis | 82/2168 | 418/18723 | 1.03e-06 | 3.49e-05 | 82 |
| GO:000150313 | Endometrium | EEC | ossification | 79/2168 | 408/18723 | 2.72e-06 | 7.67e-05 | 79 |
| GO:003432914 | Endometrium | EEC | cell junction assembly | 79/2168 | 420/18723 | 8.37e-06 | 1.85e-04 | 79 |
| GO:004521615 | Endometrium | EEC | cell-cell junction organization | 42/2168 | 200/18723 | 8.84e-05 | 1.25e-03 | 42 |
| GO:000704315 | Endometrium | EEC | cell-cell junction assembly | 31/2168 | 146/18723 | 5.74e-04 | 5.72e-03 | 31 |
| GO:000150317 | Esophagus | ESCC | ossification | 232/8552 | 408/18723 | 3.00e-06 | 3.40e-05 | 232 |
| GO:006156415 | Esophagus | ESCC | axon development | 251/8552 | 467/18723 | 2.41e-04 | 1.49e-03 | 251 |
| GO:003432918 | Esophagus | ESCC | cell junction assembly | 227/8552 | 420/18723 | 3.06e-04 | 1.83e-03 | 227 |
| GO:004521620 | Esophagus | ESCC | cell-cell junction organization | 114/8552 | 200/18723 | 8.04e-04 | 4.16e-03 | 114 |
| GO:000740915 | Esophagus | ESCC | axonogenesis | 219/8552 | 418/18723 | 3.14e-03 | 1.31e-02 | 219 |
| GO:000150310 | Oral cavity | OSCC | ossification | 203/7305 | 408/18723 | 5.54e-06 | 6.19e-05 | 203 |
| GO:004521618 | Oral cavity | OSCC | cell-cell junction organization | 97/7305 | 200/18723 | 3.83e-03 | 1.57e-02 | 97 |
| Page: 1 2 3 |
| Pathway ID | Tissue | Disease Stage | Description | Gene Ratio | Bg Ratio | pvalue | p.adjust | qvalue | Count |
| Page: 1 |
Top |
Cell-cell communication analysis |
| Identification of potential cell-cell interactions between two cell types and their ligand-receptor pairs for different disease states |
| Ligand | Receptor | LRpair | Pathway | Tissue | Disease Stage |
| ANGPTL4 | CDH11 | ANGPTL4_CDH11 | ANGPTL | Breast | DCIS |
| ANGPTL4 | CDH11 | ANGPTL4_CDH11 | ANGPTL | Breast | Healthy |
| ANGPTL4 | CDH11 | ANGPTL4_CDH11 | ANGPTL | Breast | IDC |
| ANGPTL4 | CDH11 | ANGPTL4_CDH11 | ANGPTL | Cervix | CC |
| ANGPTL4 | CDH11 | ANGPTL4_CDH11 | ANGPTL | Endometrium | AEH |
| ANGPTL4 | CDH11 | ANGPTL4_CDH11 | ANGPTL | Esophagus | ESCC |
| ANGPTL4 | CDH11 | ANGPTL4_CDH11 | ANGPTL | HNSCC | OSCC |
| ANGPTL4 | CDH11 | ANGPTL4_CDH11 | ANGPTL | HNSCC | Precancer |
| ANGPTL4 | CDH11 | ANGPTL4_CDH11 | ANGPTL | Liver | HCC |
| ANGPTL4 | CDH11 | ANGPTL4_CDH11 | ANGPTL | Prostate | Healthy |
| ANGPTL4 | CDH11 | ANGPTL4_CDH11 | ANGPTL | Skin | ADJ |
| ANGPTL4 | CDH11 | ANGPTL4_CDH11 | ANGPTL | Skin | Healthy |
| ANGPTL4 | CDH11 | ANGPTL4_CDH11 | ANGPTL | THCA | Cancer |
| ANGPTL4 | CDH11 | ANGPTL4_CDH11 | ANGPTL | THCA | Precancer |
| ANGPTL4 | CDH11 | ANGPTL4_CDH11 | ANGPTL | THCA | PTC |
| Page: 1 |
Top |
Single-cell gene regulatory network inference analysis |
| Find out the significant the regulons (TFs) and the target genes of each regulon across cell types for different disease states |
| TF | Cell Type | Tissue | Disease Stage | Target Gene | RSS | Regulon Activity |
| ∗The dot plots of a searched regulon are shown for all cell subpopulations in each disease state of each tissue based on the regulon specific score inferred using pySCENIC and by calculating the average expression. |
| Page: 1 |
Top |
Somatic mutation of malignant transformation related genes |
| Annotation of somatic variants for genes involved in malignant transformation |
| Hugo Symbol | Variant Class | Variant Classification | dbSNP RS | HGVSc | HGVSp | HGVSp Short | SWISSPROT | BIOTYPE | SIFT | PolyPhen | Tumor Sample Barcode | Tissue | Histology | Sex | Age | Stage | Therapy Types | Drugs | Outcome |
| CDH11 | SNV | Missense_Mutation | c.515C>A | p.Ser172Tyr | p.S172Y | P55287 | protein_coding | deleterious(0) | probably_damaging(0.993) | TCGA-A2-A0CM-01 | Breast | breast invasive carcinoma | Female | <65 | I/II | Chemotherapy | adriamycin | PD | |
| CDH11 | SNV | Missense_Mutation | novel | c.1493N>G | p.Glu498Gly | p.E498G | P55287 | protein_coding | deleterious(0) | probably_damaging(0.96) | TCGA-AC-A2QI-01 | Breast | breast invasive carcinoma | Female | >=65 | III/IV | Chemotherapy | cytoxan | CR |
| CDH11 | SNV | Missense_Mutation | c.149G>A | p.Arg50His | p.R50H | P55287 | protein_coding | deleterious(0) | probably_damaging(0.999) | TCGA-AC-A8OQ-01 | Breast | breast invasive carcinoma | Female | >=65 | I/II | Unknown | Unknown | SD | |
| CDH11 | SNV | Missense_Mutation | c.2128C>T | p.Pro710Ser | p.P710S | P55287 | protein_coding | tolerated(0.43) | benign(0.101) | TCGA-AN-A046-01 | Breast | breast invasive carcinoma | Female | >=65 | I/II | Unknown | Unknown | SD | |
| CDH11 | SNV | Missense_Mutation | c.502N>A | p.Val168Met | p.V168M | P55287 | protein_coding | deleterious(0) | probably_damaging(0.999) | TCGA-AO-A0JI-01 | Breast | breast invasive carcinoma | Female | <65 | I/II | Chemotherapy | cyclophosphamide | SD | |
| CDH11 | SNV | Missense_Mutation | c.400G>A | p.Asp134Asn | p.D134N | P55287 | protein_coding | tolerated(0.62) | benign(0.001) | TCGA-D8-A1XQ-01 | Breast | breast invasive carcinoma | Female | >=65 | I/II | Unknown | Unknown | SD | |
| CDH11 | SNV | Missense_Mutation | c.699N>G | p.His233Gln | p.H233Q | P55287 | protein_coding | tolerated(0.94) | benign(0.013) | TCGA-E2-A14R-01 | Breast | breast invasive carcinoma | Female | <65 | I/II | Chemotherapy | doxorubicin | PD | |
| CDH11 | insertion | Frame_Shift_Ins | novel | c.934_935insAATGTGAGCTATTTGTGAGTGAGTTTGT | p.Gly312GlufsTer15 | p.G312Efs*15 | P55287 | protein_coding | TCGA-AO-A128-01 | Breast | breast invasive carcinoma | Female | <65 | I/II | Chemotherapy | doxorubicin | SD | ||
| CDH11 | insertion | In_Frame_Ins | novel | c.1110_1111insTTTTTA | p.Val370_Lys371insPheLeu | p.V370_K371insFL | P55287 | protein_coding | TCGA-BH-A0HX-01 | Breast | breast invasive carcinoma | Female | <65 | I/II | Chemotherapy | adrimycin | SD | ||
| CDH11 | insertion | Nonsense_Mutation | novel | c.1108_1109insAGGTTCATACATGTTGCAGAGTGCATCACTAATTCATT | p.Val370GlufsTer11 | p.V370Efs*11 | P55287 | protein_coding | TCGA-BH-A0HX-01 | Breast | breast invasive carcinoma | Female | <65 | I/II | Chemotherapy | adrimycin | SD |
| Page: 1 2 3 4 5 6 7 8 9 10 11 12 13 14 15 16 17 18 19 20 21 22 23 |
Top |
Related drugs of malignant transformation related genes |
| Identification of chemicals and drugs interact with genes involved in malignant transfromation |
| (DGIdb 4.0) |
| Entrez ID | Symbol | Category | Interaction Types | Drug Claim Name | Drug Name | PMIDs |
| 1009 | CDH11 | CLINICALLY ACTIONABLE | RG6125 |
| Page: 1 |

Copyright 2023-Present -The University of Texas Health Science Center at Houston |