
|
|||||
|
 | |
| |
| |
| |
| |
| |
|
Gene: CDCA7L |
Gene summary for CDCA7L |
| Gene information | Species | Human | Gene symbol | CDCA7L | Gene ID | 55536 |
| Gene name | cell division cycle associated 7 like | |
| Gene Alias | JPO2 | |
| Cytomap | 7p15.3 | |
| Gene Type | protein-coding | GO ID | GO:0006139 | UniProtAcc | Q96GN5 |
Top |
Malignant transformation analysis |
| Identification of the aberrant gene expression in precancerous and cancerous lesions by comparing the gene expression of stem-like cells in diseased tissues with normal stem cells |
| Entrez ID | Symbol | Replicates | Species | Organ | Tissue | Adj P-value | Log2FC | Malignancy |
| 55536 | CDCA7L | LZE2T | Human | Esophagus | ESCC | 3.88e-03 | 3.51e-01 | 0.082 |
| 55536 | CDCA7L | LZE4T | Human | Esophagus | ESCC | 5.79e-09 | 1.97e-01 | 0.0811 |
| 55536 | CDCA7L | LZE5T | Human | Esophagus | ESCC | 1.57e-02 | 1.87e-01 | 0.0514 |
| 55536 | CDCA7L | LZE7T | Human | Esophagus | ESCC | 6.70e-04 | 3.66e-01 | 0.0667 |
| 55536 | CDCA7L | LZE8T | Human | Esophagus | ESCC | 2.60e-05 | 1.47e-01 | 0.067 |
| 55536 | CDCA7L | LZE24T | Human | Esophagus | ESCC | 3.65e-12 | 3.45e-01 | 0.0596 |
| 55536 | CDCA7L | LZE21T | Human | Esophagus | ESCC | 4.63e-04 | 3.65e-01 | 0.0655 |
| 55536 | CDCA7L | LZE6T | Human | Esophagus | ESCC | 4.70e-07 | 3.04e-01 | 0.0845 |
| 55536 | CDCA7L | P1T-E | Human | Esophagus | ESCC | 4.64e-10 | 5.92e-01 | 0.0875 |
| 55536 | CDCA7L | P2T-E | Human | Esophagus | ESCC | 3.77e-37 | 7.50e-01 | 0.1177 |
| 55536 | CDCA7L | P4T-E | Human | Esophagus | ESCC | 1.64e-13 | 4.06e-01 | 0.1323 |
| 55536 | CDCA7L | P5T-E | Human | Esophagus | ESCC | 7.19e-18 | 4.18e-01 | 0.1327 |
| 55536 | CDCA7L | P8T-E | Human | Esophagus | ESCC | 4.66e-38 | 6.75e-01 | 0.0889 |
| 55536 | CDCA7L | P9T-E | Human | Esophagus | ESCC | 2.82e-12 | 3.77e-01 | 0.1131 |
| 55536 | CDCA7L | P10T-E | Human | Esophagus | ESCC | 3.76e-58 | 1.10e+00 | 0.116 |
| 55536 | CDCA7L | P11T-E | Human | Esophagus | ESCC | 8.22e-12 | 6.10e-01 | 0.1426 |
| 55536 | CDCA7L | P12T-E | Human | Esophagus | ESCC | 4.50e-29 | 5.68e-01 | 0.1122 |
| 55536 | CDCA7L | P15T-E | Human | Esophagus | ESCC | 6.53e-31 | 6.88e-01 | 0.1149 |
| 55536 | CDCA7L | P16T-E | Human | Esophagus | ESCC | 3.00e-42 | 5.72e-01 | 0.1153 |
| 55536 | CDCA7L | P17T-E | Human | Esophagus | ESCC | 2.68e-18 | 3.92e-01 | 0.1278 |
| Page: 1 2 3 4 5 6 |
| Tissue | Expression Dynamics | Abbreviation |
| Esophagus |  | ESCC: Esophageal squamous cell carcinoma |
| HGIN: High-grade intraepithelial neoplasias | ||
| LGIN: Low-grade intraepithelial neoplasias | ||
| Liver | 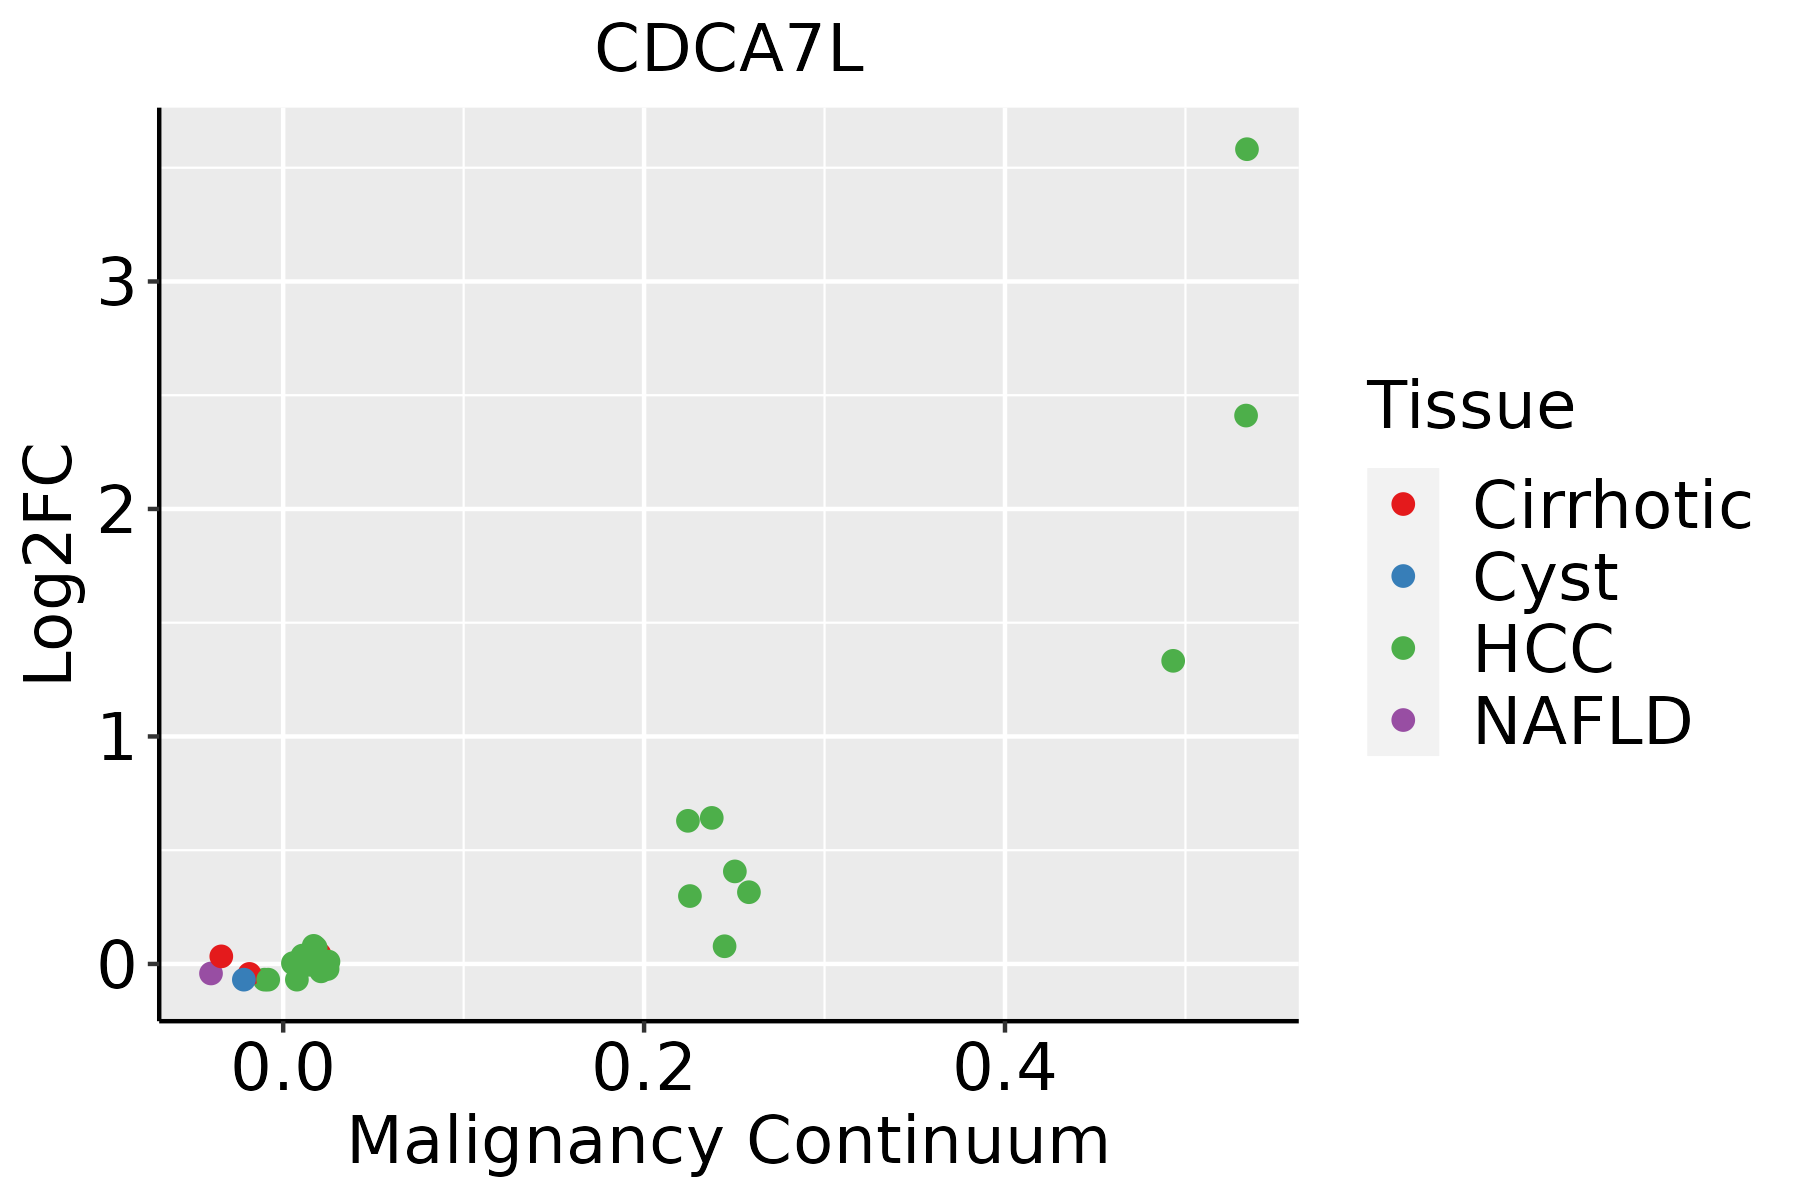 | HCC: Hepatocellular carcinoma |
| NAFLD: Non-alcoholic fatty liver disease | ||
| Oral Cavity |  | EOLP: Erosive Oral lichen planus |
| LP: leukoplakia | ||
| NEOLP: Non-erosive oral lichen planus | ||
| OSCC: Oral squamous cell carcinoma | ||
| Prostate |  | BPH: Benign Prostatic Hyperplasia |
| Skin | 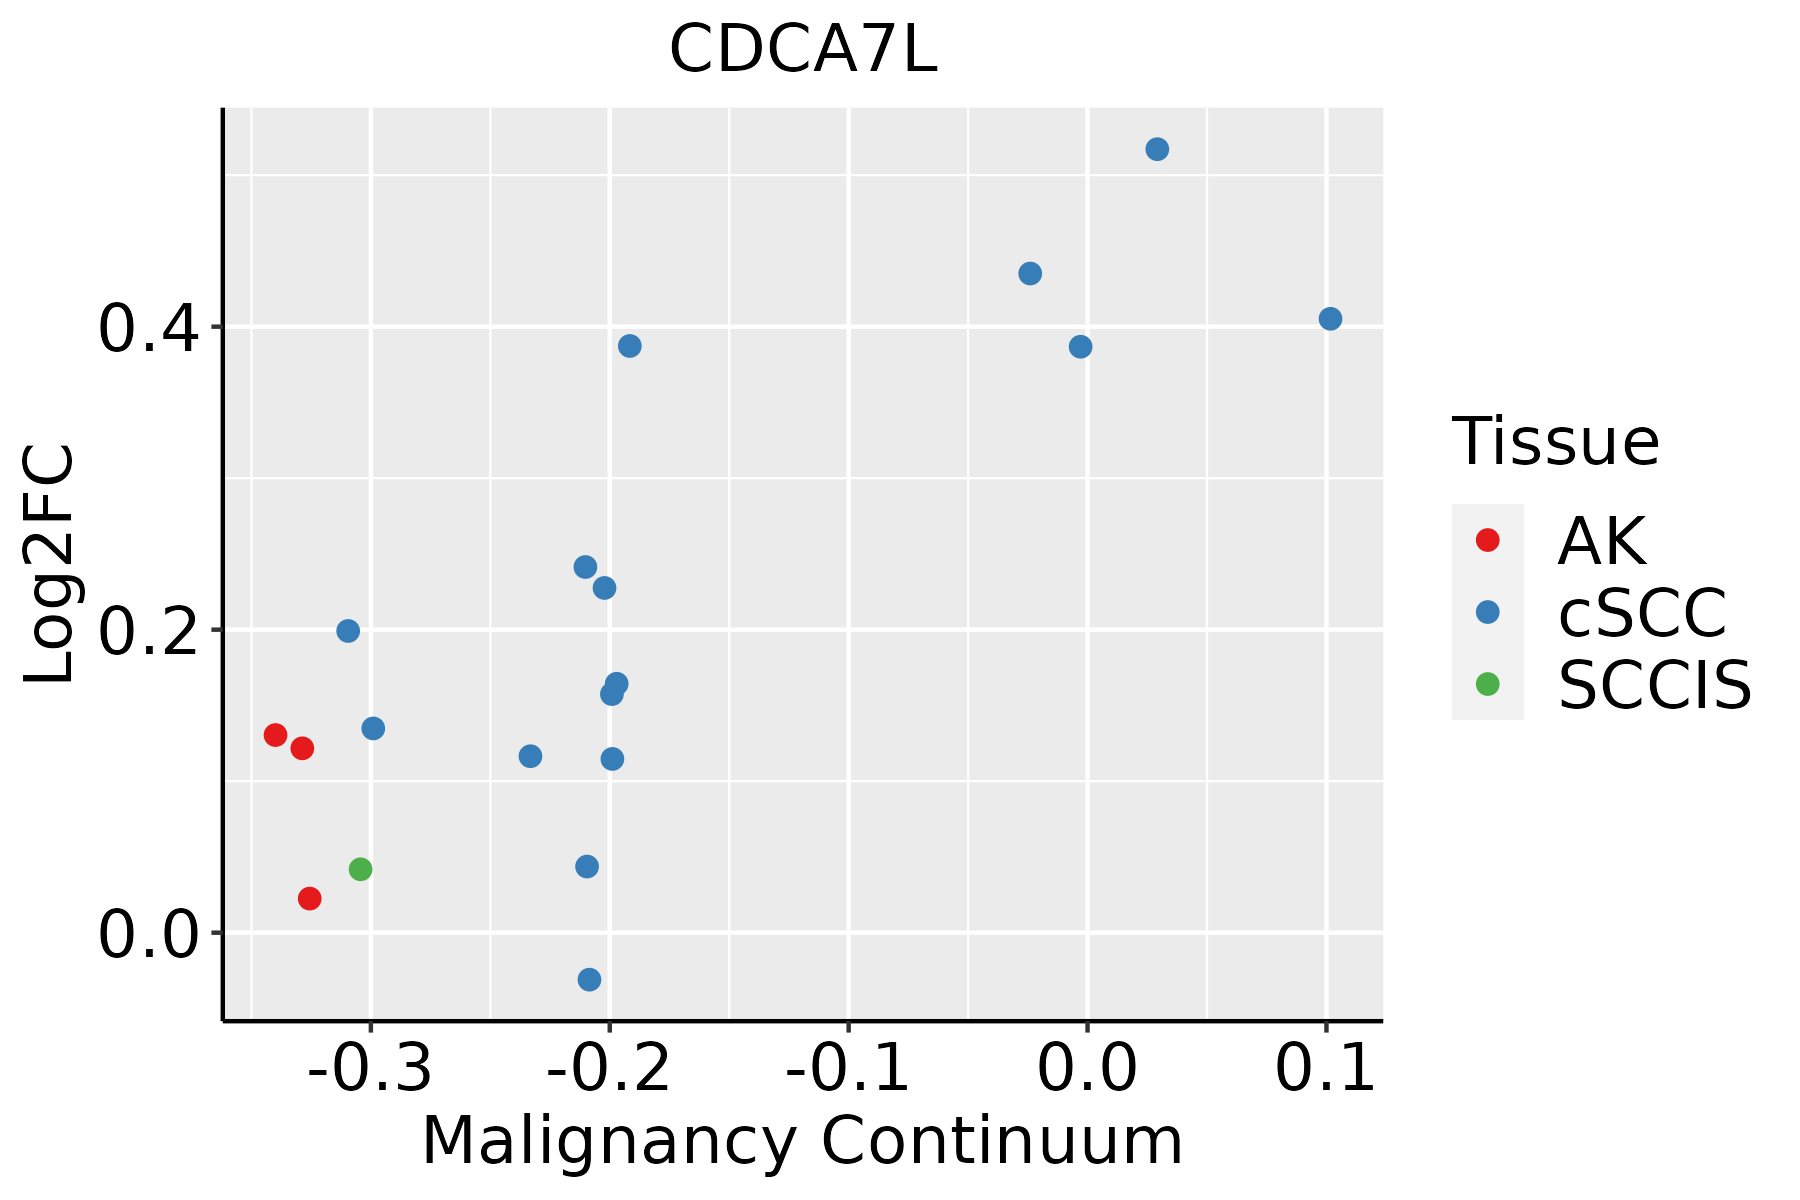 | AK: Actinic keratosis |
| cSCC: Cutaneous squamous cell carcinoma | ||
| SCCIS:squamous cell carcinoma in situ | ||
| Thyroid |  | ATC: Anaplastic thyroid cancer |
| HT: Hashimoto's thyroiditis | ||
| PTC: Papillary thyroid cancer |
| ∗log2FC in expression of this searched gene in stem-like cells from each diseased tissue sample relative to stem-like cells in normal samples in each tissue plotted against the malignancy continuum. Samples are colored based on if they are from different disease stage. |
Top |
Malignant transformation related pathway analysis |
| Find out the enriched GO biological processes and KEGG pathways involved in transition from healthy to precancer to cancer |
| Tissue | Disease Stage | Enriched GO biological Processes |
| Colorectum | AD |  |
| Colorectum | SER |  |
| Colorectum | MSS |  |
| Colorectum | MSI-H |  |
| Colorectum | FAP |  |
| ∗Top 15 enriched GO BP terms are showed in the bar plot of each disease state in each tissue. Each row represents a significant GO biological process which is colored according to the -log10(p.adjust). |
| Page: 1 2 3 4 5 6 7 8 9 |
| GO ID | Tissue | Disease Stage | Description | Gene Ratio | Bg Ratio | pvalue | p.adjust | Count |
| Page: 1 |
| Pathway ID | Tissue | Disease Stage | Description | Gene Ratio | Bg Ratio | pvalue | p.adjust | qvalue | Count |
| Page: 1 |
Top |
Cell-cell communication analysis |
| Identification of potential cell-cell interactions between two cell types and their ligand-receptor pairs for different disease states |
| Ligand | Receptor | LRpair | Pathway | Tissue | Disease Stage |
| Page: 1 |
Top |
Single-cell gene regulatory network inference analysis |
| Find out the significant the regulons (TFs) and the target genes of each regulon across cell types for different disease states |
| TF | Cell Type | Tissue | Disease Stage | Target Gene | RSS | Regulon Activity |
| ∗The dot plots of a searched regulon are shown for all cell subpopulations in each disease state of each tissue based on the regulon specific score inferred using pySCENIC and by calculating the average expression. |
| Page: 1 |
Top |
Somatic mutation of malignant transformation related genes |
| Annotation of somatic variants for genes involved in malignant transformation |
| Hugo Symbol | Variant Class | Variant Classification | dbSNP RS | HGVSc | HGVSp | HGVSp Short | SWISSPROT | BIOTYPE | SIFT | PolyPhen | Tumor Sample Barcode | Tissue | Histology | Sex | Age | Stage | Therapy Types | Drugs | Outcome |
| CDCA7L | SNV | Missense_Mutation | c.622N>A | p.Gln208Lys | p.Q208K | Q96GN5 | protein_coding | deleterious(0.01) | benign(0.095) | TCGA-A8-A09A-01 | Breast | breast invasive carcinoma | Female | <65 | I/II | Hormone Therapy | tamoxiphen | SD | |
| CDCA7L | SNV | Missense_Mutation | c.1216N>A | p.Cys406Ser | p.C406S | Q96GN5 | protein_coding | deleterious(0) | probably_damaging(0.999) | TCGA-AO-A0J2-01 | Breast | breast invasive carcinoma | Female | <65 | I/II | Chemotherapy | cyclophosphamide | SD | |
| CDCA7L | SNV | Missense_Mutation | c.818G>A | p.Arg273Gln | p.R273Q | Q96GN5 | protein_coding | deleterious(0.01) | probably_damaging(0.996) | TCGA-E2-A14V-01 | Breast | breast invasive carcinoma | Female | <65 | I/II | Chemotherapy | cyclophosphamide | SD | |
| CDCA7L | deletion | Frame_Shift_Del | novel | c.1075_1076delNN | p.Lys359AspfsTer60 | p.K359Dfs*60 | Q96GN5 | protein_coding | TCGA-AR-A1AY-01 | Breast | breast invasive carcinoma | Female | >=65 | I/II | Unspecific | Doxorubicin | SD | ||
| CDCA7L | SNV | Missense_Mutation | c.866N>T | p.Ser289Leu | p.S289L | Q96GN5 | protein_coding | tolerated(0.08) | probably_damaging(0.994) | TCGA-EK-A2PG-01 | Cervix | cervical & endocervical cancer | Female | >=65 | I/II | Unknown | Unknown | SD | |
| CDCA7L | SNV | Missense_Mutation | rs749525504 | c.55G>A | p.Ala19Thr | p.A19T | Q96GN5 | protein_coding | tolerated(0.1) | possibly_damaging(0.683) | TCGA-AA-3492-01 | Colorectum | colon adenocarcinoma | Female | >=65 | I/II | Unknown | Unknown | SD |
| CDCA7L | SNV | Missense_Mutation | c.976N>A | p.Glu326Lys | p.E326K | Q96GN5 | protein_coding | tolerated(0.09) | benign(0.009) | TCGA-AA-3663-01 | Colorectum | colon adenocarcinoma | Male | <65 | I/II | Unknown | Unknown | SD | |
| CDCA7L | SNV | Missense_Mutation | c.376G>T | p.Asp126Tyr | p.D126Y | Q96GN5 | protein_coding | deleterious(0.03) | benign(0.04) | TCGA-AA-3977-01 | Colorectum | colon adenocarcinoma | Male | >=65 | I/II | Unknown | Unknown | SD | |
| CDCA7L | SNV | Missense_Mutation | rs770755131 | c.710N>T | p.Ser237Leu | p.S237L | Q96GN5 | protein_coding | deleterious(0) | probably_damaging(0.996) | TCGA-AA-A00N-01 | Colorectum | colon adenocarcinoma | Male | >=65 | I/II | Unknown | Unknown | PD |
| CDCA7L | SNV | Missense_Mutation | rs770218756 | c.538N>A | p.Leu180Ile | p.L180I | Q96GN5 | protein_coding | tolerated(0.13) | benign(0.005) | TCGA-AA-A010-01 | Colorectum | colon adenocarcinoma | Female | <65 | I/II | Chemotherapy | folinic | CR |
| Page: 1 2 3 4 5 6 7 |
Top |
Related drugs of malignant transformation related genes |
| Identification of chemicals and drugs interact with genes involved in malignant transfromation |
| (DGIdb 4.0) |
| Entrez ID | Symbol | Category | Interaction Types | Drug Claim Name | Drug Name | PMIDs |
| Page: 1 |

Copyright 2023-Present -The University of Texas Health Science Center at Houston |