
|
|||||
|
 | |
| |
| |
| |
| |
| |
|
Gene: CDCA7 |
Gene summary for CDCA7 |
| Gene information | Species | Human | Gene symbol | CDCA7 | Gene ID | 83879 |
| Gene name | cell division cycle associated 7 | |
| Gene Alias | ICF3 | |
| Cytomap | 2q31.1 | |
| Gene Type | protein-coding | GO ID | GO:0006139 | UniProtAcc | Q9BWT1 |
Top |
Malignant transformation analysis |
| Identification of the aberrant gene expression in precancerous and cancerous lesions by comparing the gene expression of stem-like cells in diseased tissues with normal stem cells |
| Entrez ID | Symbol | Replicates | Species | Organ | Tissue | Adj P-value | Log2FC | Malignancy |
| 83879 | CDCA7 | HTA11_866_2000001011 | Human | Colorectum | AD | 2.45e-04 | -2.34e-01 | -0.1001 |
| 83879 | CDCA7 | HTA11_866_3004761011 | Human | Colorectum | AD | 1.06e-02 | 3.85e-01 | 0.096 |
| 83879 | CDCA7 | HTA11_6801_2000001011 | Human | Colorectum | SER | 1.27e-02 | 6.75e-01 | 0.0171 |
| 83879 | CDCA7 | HTA11_99999970781_79442 | Human | Colorectum | MSS | 9.06e-15 | 8.11e-01 | 0.294 |
| 83879 | CDCA7 | HTA11_99999965104_69814 | Human | Colorectum | MSS | 6.65e-13 | 9.29e-01 | 0.281 |
| 83879 | CDCA7 | HTA11_99999971662_82457 | Human | Colorectum | MSS | 2.43e-13 | 8.14e-01 | 0.3859 |
| 83879 | CDCA7 | F007 | Human | Colorectum | FAP | 4.53e-02 | -2.10e-01 | 0.1176 |
| 83879 | CDCA7 | A015-C-203 | Human | Colorectum | FAP | 3.77e-12 | -1.83e-01 | -0.1294 |
| 83879 | CDCA7 | A002-C-201 | Human | Colorectum | FAP | 2.60e-08 | -2.88e-01 | 0.0324 |
| 83879 | CDCA7 | A001-C-108 | Human | Colorectum | FAP | 2.13e-07 | -1.77e-02 | -0.0272 |
| 83879 | CDCA7 | A002-C-205 | Human | Colorectum | FAP | 3.14e-06 | -1.38e-01 | -0.1236 |
| 83879 | CDCA7 | A015-C-006 | Human | Colorectum | FAP | 1.19e-03 | -6.92e-02 | -0.0994 |
| 83879 | CDCA7 | A002-C-114 | Human | Colorectum | FAP | 5.62e-07 | -2.57e-01 | -0.1561 |
| 83879 | CDCA7 | A015-C-104 | Human | Colorectum | FAP | 3.15e-14 | -1.35e-01 | -0.1899 |
| 83879 | CDCA7 | A001-C-014 | Human | Colorectum | FAP | 1.59e-08 | -1.70e-01 | 0.0135 |
| 83879 | CDCA7 | A002-C-016 | Human | Colorectum | FAP | 7.04e-11 | -2.60e-01 | 0.0521 |
| 83879 | CDCA7 | A015-C-002 | Human | Colorectum | FAP | 3.78e-02 | -3.31e-02 | -0.0763 |
| 83879 | CDCA7 | A001-C-203 | Human | Colorectum | FAP | 3.24e-05 | -1.10e-01 | -0.0481 |
| 83879 | CDCA7 | A002-C-116 | Human | Colorectum | FAP | 4.01e-15 | -2.64e-01 | -0.0452 |
| 83879 | CDCA7 | A014-C-008 | Human | Colorectum | FAP | 3.08e-04 | -1.81e-01 | -0.191 |
| Page: 1 2 3 4 5 6 |
| Tissue | Expression Dynamics | Abbreviation |
| Colorectum (GSE201348) |  | FAP: Familial adenomatous polyposis |
| CRC: Colorectal cancer | ||
| Colorectum (HTA11) |  | AD: Adenomas |
| SER: Sessile serrated lesions | ||
| MSI-H: Microsatellite-high colorectal cancer | ||
| MSS: Microsatellite stable colorectal cancer | ||
| Esophagus | 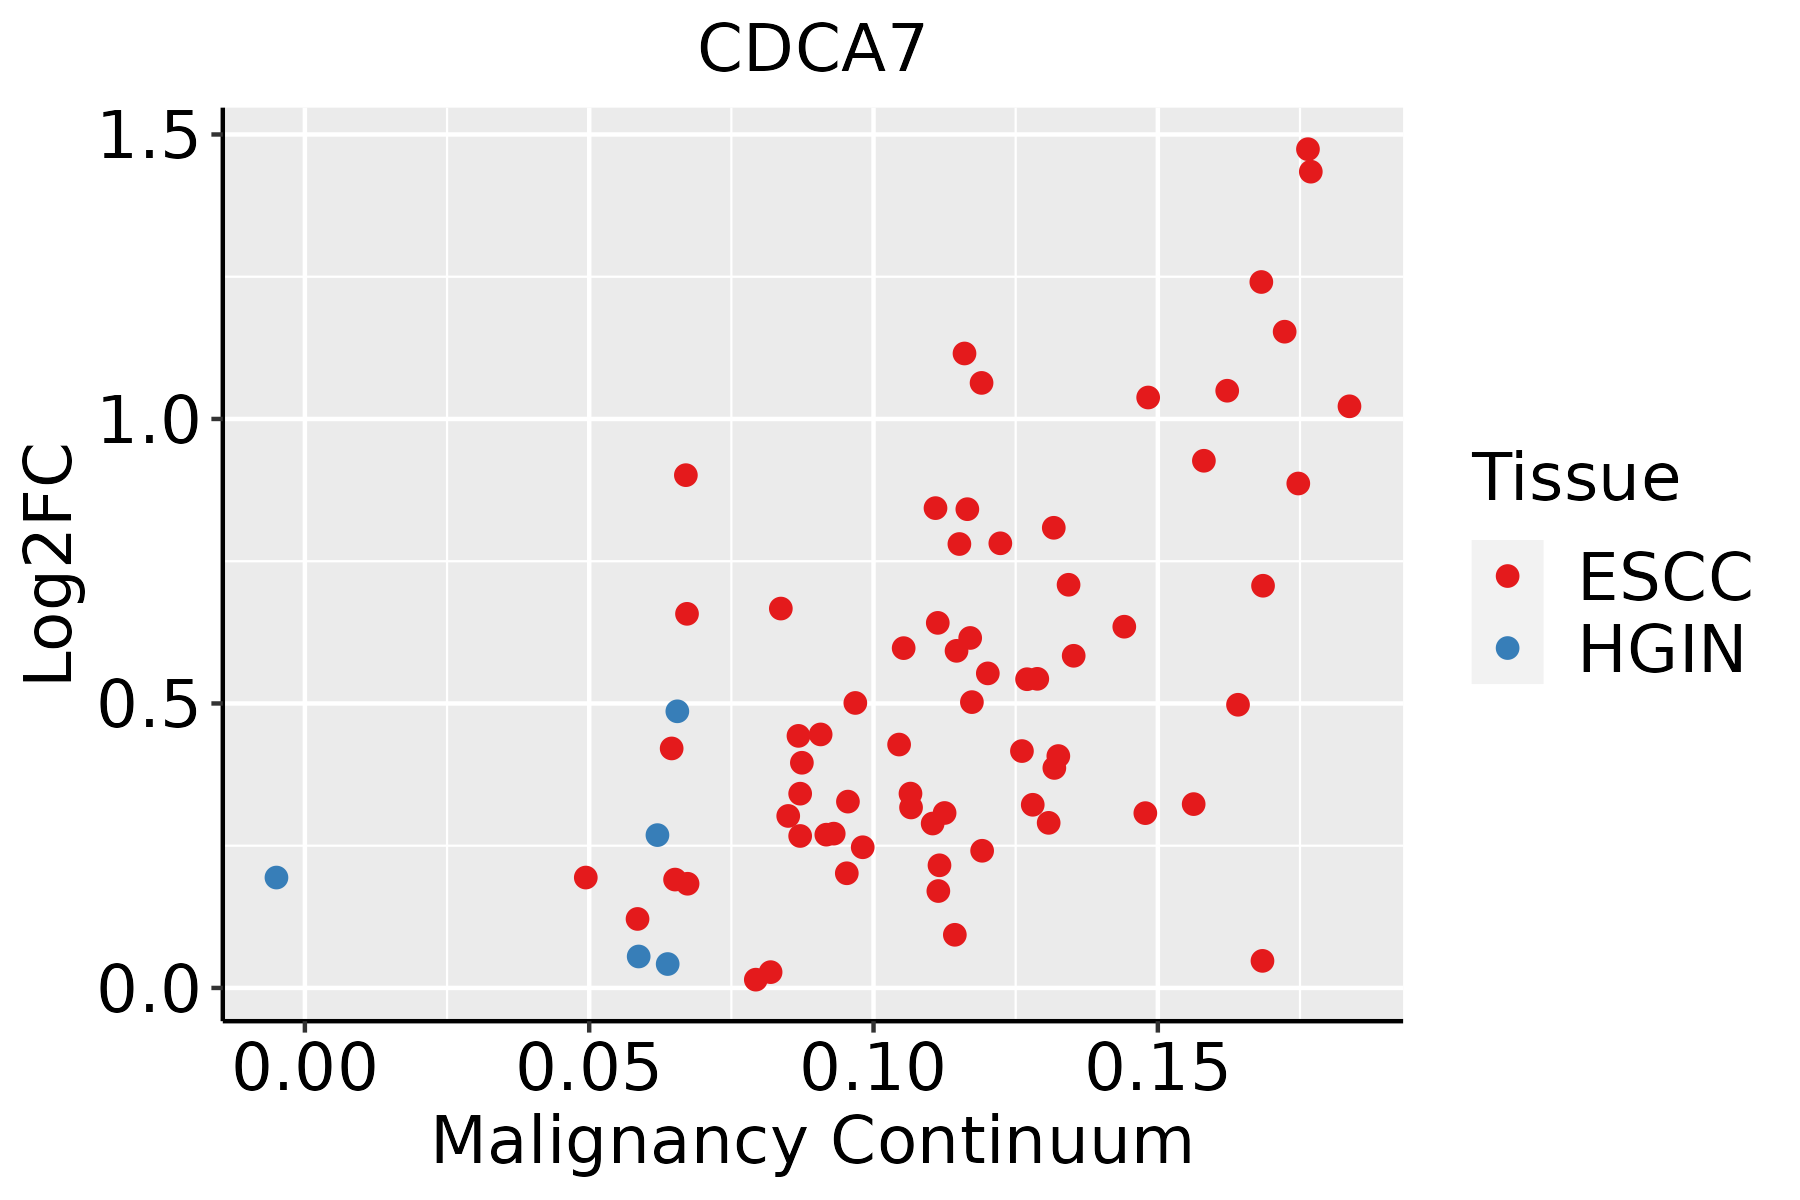 | ESCC: Esophageal squamous cell carcinoma |
| HGIN: High-grade intraepithelial neoplasias | ||
| LGIN: Low-grade intraepithelial neoplasias | ||
| Liver |  | HCC: Hepatocellular carcinoma |
| NAFLD: Non-alcoholic fatty liver disease | ||
| Oral Cavity |  | EOLP: Erosive Oral lichen planus |
| LP: leukoplakia | ||
| NEOLP: Non-erosive oral lichen planus | ||
| OSCC: Oral squamous cell carcinoma | ||
| Skin |  | AK: Actinic keratosis |
| cSCC: Cutaneous squamous cell carcinoma | ||
| SCCIS:squamous cell carcinoma in situ |
| ∗log2FC in expression of this searched gene in stem-like cells from each diseased tissue sample relative to stem-like cells in normal samples in each tissue plotted against the malignancy continuum. Samples are colored based on if they are from different disease stage. |
Top |
Malignant transformation related pathway analysis |
| Find out the enriched GO biological processes and KEGG pathways involved in transition from healthy to precancer to cancer |
| Tissue | Disease Stage | Enriched GO biological Processes |
| Colorectum | AD |  |
| Colorectum | SER |  |
| Colorectum | MSS |  |
| Colorectum | MSI-H |  |
| Colorectum | FAP |  |
| ∗Top 15 enriched GO BP terms are showed in the bar plot of each disease state in each tissue. Each row represents a significant GO biological process which is colored according to the -log10(p.adjust). |
| Page: 1 2 3 4 5 6 7 8 9 |
| GO ID | Tissue | Disease Stage | Description | Gene Ratio | Bg Ratio | pvalue | p.adjust | Count |
| Page: 1 |
| Pathway ID | Tissue | Disease Stage | Description | Gene Ratio | Bg Ratio | pvalue | p.adjust | qvalue | Count |
| Page: 1 |
Top |
Cell-cell communication analysis |
| Identification of potential cell-cell interactions between two cell types and their ligand-receptor pairs for different disease states |
| Ligand | Receptor | LRpair | Pathway | Tissue | Disease Stage |
| Page: 1 |
Top |
Single-cell gene regulatory network inference analysis |
| Find out the significant the regulons (TFs) and the target genes of each regulon across cell types for different disease states |
| TF | Cell Type | Tissue | Disease Stage | Target Gene | RSS | Regulon Activity |
| ∗The dot plots of a searched regulon are shown for all cell subpopulations in each disease state of each tissue based on the regulon specific score inferred using pySCENIC and by calculating the average expression. |
| Page: 1 |
Top |
Somatic mutation of malignant transformation related genes |
| Annotation of somatic variants for genes involved in malignant transformation |
| Hugo Symbol | Variant Class | Variant Classification | dbSNP RS | HGVSc | HGVSp | HGVSp Short | SWISSPROT | BIOTYPE | SIFT | PolyPhen | Tumor Sample Barcode | Tissue | Histology | Sex | Age | Stage | Therapy Types | Drugs | Outcome |
| CDCA7 | SNV | Missense_Mutation | rs771816691 | c.304N>A | p.Glu102Lys | p.E102K | Q9BWT1 | protein_coding | tolerated(0.11) | possibly_damaging(0.864) | TCGA-AN-A046-01 | Breast | breast invasive carcinoma | Female | >=65 | I/II | Unknown | Unknown | SD |
| CDCA7 | SNV | Missense_Mutation | c.226G>T | p.Gly76Cys | p.G76C | Q9BWT1 | protein_coding | deleterious(0) | probably_damaging(0.969) | TCGA-AN-A0FS-01 | Breast | breast invasive carcinoma | Female | <65 | I/II | Unknown | Unknown | SD | |
| CDCA7 | SNV | Missense_Mutation | c.988N>A | p.Glu330Lys | p.E330K | Q9BWT1 | protein_coding | tolerated(0.05) | benign(0.005) | TCGA-B6-A0IN-01 | Breast | breast invasive carcinoma | Female | <65 | I/II | Unknown | Unknown | PD | |
| CDCA7 | SNV | Missense_Mutation | c.631N>T | p.Leu211Phe | p.L211F | Q9BWT1 | protein_coding | deleterious(0) | probably_damaging(0.992) | TCGA-BH-A0HF-01 | Breast | breast invasive carcinoma | Female | >=65 | I/II | Hormone Therapy | arimidex | SD | |
| CDCA7 | insertion | Nonsense_Mutation | novel | c.821_822insATAGTCAATTTTGGAATAACTTTATGACCCCAAAAAATGA | p.Met275Ter | p.M275* | Q9BWT1 | protein_coding | TCGA-AR-A0TY-01 | Breast | breast invasive carcinoma | Female | <65 | I/II | Unspecific | Paclitaxel | PD | ||
| CDCA7 | SNV | Missense_Mutation | rs771816691 | c.304G>A | p.Glu102Lys | p.E102K | Q9BWT1 | protein_coding | tolerated(0.11) | possibly_damaging(0.864) | TCGA-AA-3984-01 | Colorectum | colon adenocarcinoma | Female | <65 | I/II | Unknown | Unknown | SD |
| CDCA7 | SNV | Missense_Mutation | c.1075N>G | p.Thr359Ala | p.T359A | Q9BWT1 | protein_coding | deleterious(0) | probably_damaging(0.94) | TCGA-AA-A010-01 | Colorectum | colon adenocarcinoma | Female | <65 | I/II | Chemotherapy | folinic | CR | |
| CDCA7 | SNV | Missense_Mutation | c.226G>T | p.Gly76Cys | p.G76C | Q9BWT1 | protein_coding | deleterious(0) | probably_damaging(0.969) | TCGA-AA-A024-01 | Colorectum | colon adenocarcinoma | Male | >=65 | I/II | Unknown | Unknown | SD | |
| CDCA7 | SNV | Missense_Mutation | rs145479884 | c.760C>T | p.Arg254Trp | p.R254W | Q9BWT1 | protein_coding | deleterious(0.05) | benign(0.429) | TCGA-AD-5900-01 | Colorectum | colon adenocarcinoma | Male | >=65 | I/II | Unknown | Unknown | SD |
| CDCA7 | SNV | Missense_Mutation | rs534928780 | c.722N>A | p.Arg241His | p.R241H | Q9BWT1 | protein_coding | tolerated(0.1) | probably_damaging(0.967) | TCGA-G4-6628-01 | Colorectum | colon adenocarcinoma | Male | >=65 | I/II | Unknown | Unknown | SD |
| Page: 1 2 3 4 5 6 |
Top |
Related drugs of malignant transformation related genes |
| Identification of chemicals and drugs interact with genes involved in malignant transfromation |
| (DGIdb 4.0) |
| Entrez ID | Symbol | Category | Interaction Types | Drug Claim Name | Drug Name | PMIDs |
| Page: 1 |

Copyright 2023-Present -The University of Texas Health Science Center at Houston |