
|
|||||
|
 | |
| |
| |
| |
| |
| |
|
Gene: CDCA4 |
Gene summary for CDCA4 |
| Gene information | Species | Human | Gene symbol | CDCA4 | Gene ID | 55038 |
| Gene name | cell division cycle associated 4 | |
| Gene Alias | HEPP | |
| Cytomap | 14q32.33 | |
| Gene Type | protein-coding | GO ID | GO:0006139 | UniProtAcc | A0A024R6P3 |
Top |
Malignant transformation analysis |
| Identification of the aberrant gene expression in precancerous and cancerous lesions by comparing the gene expression of stem-like cells in diseased tissues with normal stem cells |
| Entrez ID | Symbol | Replicates | Species | Organ | Tissue | Adj P-value | Log2FC | Malignancy |
| 55038 | CDCA4 | LZE2T | Human | Esophagus | ESCC | 2.88e-04 | 4.60e-01 | 0.082 |
| 55038 | CDCA4 | LZE4T | Human | Esophagus | ESCC | 3.54e-03 | 2.44e-01 | 0.0811 |
| 55038 | CDCA4 | LZE20T | Human | Esophagus | ESCC | 1.75e-06 | 2.77e-01 | 0.0662 |
| 55038 | CDCA4 | LZE24T | Human | Esophagus | ESCC | 7.65e-13 | 3.89e-01 | 0.0596 |
| 55038 | CDCA4 | LZE21T | Human | Esophagus | ESCC | 4.24e-02 | 4.73e-01 | 0.0655 |
| 55038 | CDCA4 | LZE6T | Human | Esophagus | ESCC | 7.36e-04 | 3.28e-01 | 0.0845 |
| 55038 | CDCA4 | P2T-E | Human | Esophagus | ESCC | 5.35e-23 | 6.57e-01 | 0.1177 |
| 55038 | CDCA4 | P4T-E | Human | Esophagus | ESCC | 1.17e-25 | 7.44e-01 | 0.1323 |
| 55038 | CDCA4 | P5T-E | Human | Esophagus | ESCC | 3.19e-40 | 8.88e-01 | 0.1327 |
| 55038 | CDCA4 | P8T-E | Human | Esophagus | ESCC | 4.70e-10 | 3.37e-01 | 0.0889 |
| 55038 | CDCA4 | P9T-E | Human | Esophagus | ESCC | 2.50e-07 | 2.47e-01 | 0.1131 |
| 55038 | CDCA4 | P10T-E | Human | Esophagus | ESCC | 9.00e-38 | 8.87e-01 | 0.116 |
| 55038 | CDCA4 | P11T-E | Human | Esophagus | ESCC | 1.10e-09 | 5.07e-01 | 0.1426 |
| 55038 | CDCA4 | P12T-E | Human | Esophagus | ESCC | 9.98e-33 | 6.85e-01 | 0.1122 |
| 55038 | CDCA4 | P15T-E | Human | Esophagus | ESCC | 4.13e-23 | 7.50e-01 | 0.1149 |
| 55038 | CDCA4 | P16T-E | Human | Esophagus | ESCC | 1.75e-17 | 3.80e-01 | 0.1153 |
| 55038 | CDCA4 | P17T-E | Human | Esophagus | ESCC | 4.17e-06 | 5.42e-01 | 0.1278 |
| 55038 | CDCA4 | P19T-E | Human | Esophagus | ESCC | 7.42e-05 | 5.43e-01 | 0.1662 |
| 55038 | CDCA4 | P20T-E | Human | Esophagus | ESCC | 2.46e-19 | 5.21e-01 | 0.1124 |
| 55038 | CDCA4 | P21T-E | Human | Esophagus | ESCC | 4.00e-22 | 6.01e-01 | 0.1617 |
| Page: 1 2 3 4 5 |
| Tissue | Expression Dynamics | Abbreviation |
| Esophagus | 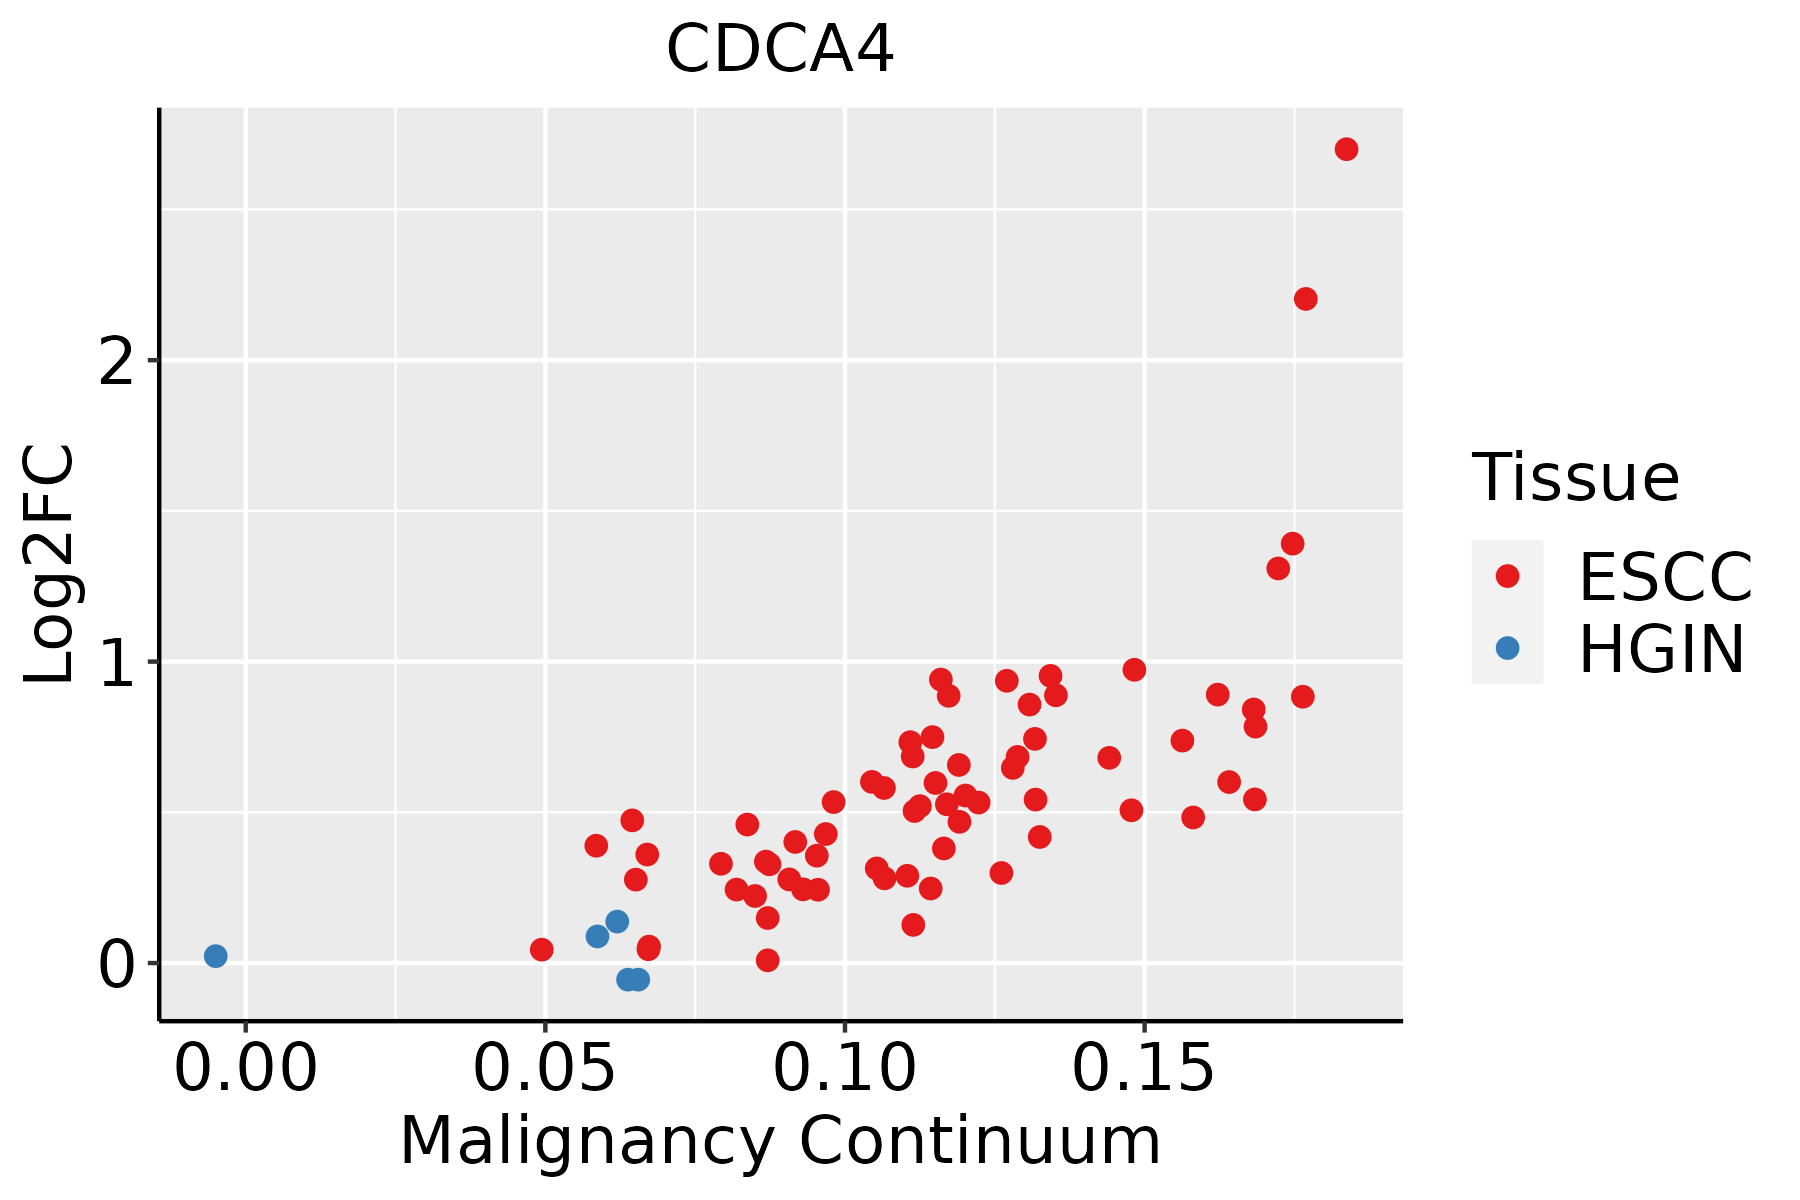 | ESCC: Esophageal squamous cell carcinoma |
| HGIN: High-grade intraepithelial neoplasias | ||
| LGIN: Low-grade intraepithelial neoplasias | ||
| Oral Cavity |  | EOLP: Erosive Oral lichen planus |
| LP: leukoplakia | ||
| NEOLP: Non-erosive oral lichen planus | ||
| OSCC: Oral squamous cell carcinoma | ||
| Skin |  | AK: Actinic keratosis |
| cSCC: Cutaneous squamous cell carcinoma | ||
| SCCIS:squamous cell carcinoma in situ | ||
| Thyroid | 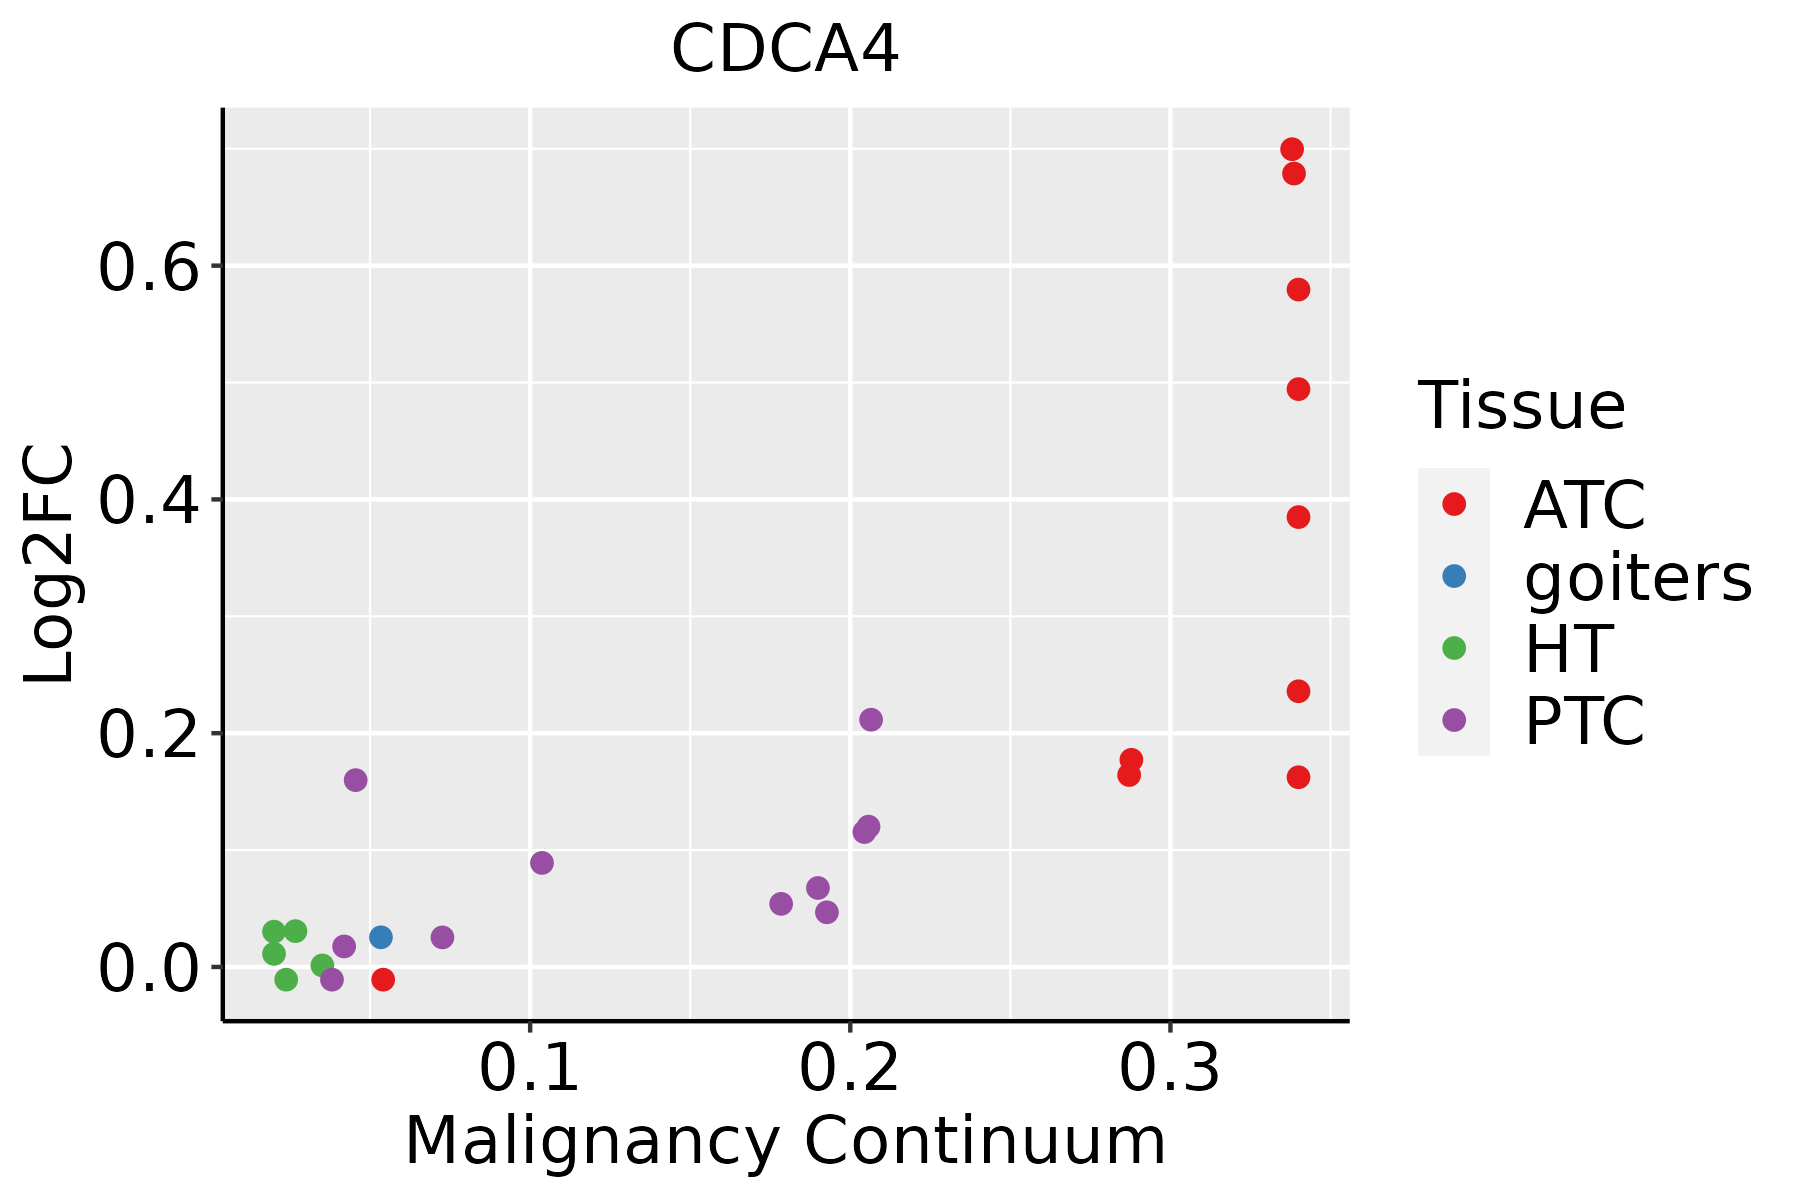 | ATC: Anaplastic thyroid cancer |
| HT: Hashimoto's thyroiditis | ||
| PTC: Papillary thyroid cancer |
| ∗log2FC in expression of this searched gene in stem-like cells from each diseased tissue sample relative to stem-like cells in normal samples in each tissue plotted against the malignancy continuum. Samples are colored based on if they are from different disease stage. |
Top |
Malignant transformation related pathway analysis |
| Find out the enriched GO biological processes and KEGG pathways involved in transition from healthy to precancer to cancer |
| Tissue | Disease Stage | Enriched GO biological Processes |
| Colorectum | AD |  |
| Colorectum | SER |  |
| Colorectum | MSS |  |
| Colorectum | MSI-H |  |
| Colorectum | FAP |  |
| ∗Top 15 enriched GO BP terms are showed in the bar plot of each disease state in each tissue. Each row represents a significant GO biological process which is colored according to the -log10(p.adjust). |
| Page: 1 2 3 4 5 6 7 8 9 |
| GO ID | Tissue | Disease Stage | Description | Gene Ratio | Bg Ratio | pvalue | p.adjust | Count |
| GO:000635414 | Esophagus | ESCC | DNA-templated transcription, elongation | 76/8552 | 91/18723 | 8.35e-14 | 4.11e-12 | 76 |
| GO:000636814 | Esophagus | ESCC | transcription elongation from RNA polymerase II promoter | 56/8552 | 69/18723 | 1.40e-09 | 3.30e-08 | 56 |
| GO:00400295 | Esophagus | ESCC | regulation of gene expression, epigenetic | 74/8552 | 105/18723 | 2.24e-07 | 3.42e-06 | 74 |
| GO:00480962 | Esophagus | ESCC | chromatin-mediated maintenance of transcription | 11/8552 | 11/18723 | 1.80e-04 | 1.16e-03 | 11 |
| GO:0045815 | Esophagus | ESCC | positive regulation of gene expression, epigenetic | 13/8552 | 17/18723 | 1.00e-02 | 3.42e-02 | 13 |
| GO:00063547 | Oral cavity | OSCC | DNA-templated transcription, elongation | 63/7305 | 91/18723 | 4.86e-09 | 1.07e-07 | 63 |
| GO:00063686 | Oral cavity | OSCC | transcription elongation from RNA polymerase II promoter | 48/7305 | 69/18723 | 2.60e-07 | 4.05e-06 | 48 |
| GO:00400294 | Oral cavity | OSCC | regulation of gene expression, epigenetic | 59/7305 | 105/18723 | 2.62e-04 | 1.68e-03 | 59 |
| GO:000635413 | Oral cavity | LP | DNA-templated transcription, elongation | 39/4623 | 91/18723 | 1.08e-04 | 1.31e-03 | 39 |
| GO:000636813 | Oral cavity | LP | transcription elongation from RNA polymerase II promoter | 31/4623 | 69/18723 | 1.92e-04 | 2.11e-03 | 31 |
| GO:004002911 | Oral cavity | LP | regulation of gene expression, epigenetic | 39/4623 | 105/18723 | 3.00e-03 | 2.05e-02 | 39 |
| GO:00480961 | Oral cavity | LP | chromatin-mediated maintenance of transcription | 7/4623 | 11/18723 | 7.01e-03 | 3.96e-02 | 7 |
| GO:000635415 | Skin | cSCC | DNA-templated transcription, elongation | 48/4864 | 91/18723 | 4.58e-08 | 1.19e-06 | 48 |
| GO:000636815 | Skin | cSCC | transcription elongation from RNA polymerase II promoter | 39/4864 | 69/18723 | 7.15e-08 | 1.78e-06 | 39 |
| GO:004002912 | Skin | cSCC | regulation of gene expression, epigenetic | 39/4864 | 105/18723 | 7.56e-03 | 3.53e-02 | 39 |
| GO:00480963 | Skin | cSCC | chromatin-mediated maintenance of transcription | 7/4864 | 11/18723 | 9.45e-03 | 4.25e-02 | 7 |
| GO:000635416 | Thyroid | PTC | DNA-templated transcription, elongation | 62/5968 | 91/18723 | 1.30e-12 | 5.91e-11 | 62 |
| GO:000636816 | Thyroid | PTC | transcription elongation from RNA polymerase II promoter | 48/5968 | 69/18723 | 1.43e-10 | 4.81e-09 | 48 |
| GO:00400297 | Thyroid | PTC | regulation of gene expression, epigenetic | 57/5968 | 105/18723 | 1.60e-06 | 2.25e-05 | 57 |
| GO:004809611 | Thyroid | PTC | chromatin-mediated maintenance of transcription | 9/5968 | 11/18723 | 9.49e-04 | 5.70e-03 | 9 |
| Page: 1 2 |
| Pathway ID | Tissue | Disease Stage | Description | Gene Ratio | Bg Ratio | pvalue | p.adjust | qvalue | Count |
| Page: 1 |
Top |
Cell-cell communication analysis |
| Identification of potential cell-cell interactions between two cell types and their ligand-receptor pairs for different disease states |
| Ligand | Receptor | LRpair | Pathway | Tissue | Disease Stage |
| Page: 1 |
Top |
Single-cell gene regulatory network inference analysis |
| Find out the significant the regulons (TFs) and the target genes of each regulon across cell types for different disease states |
| TF | Cell Type | Tissue | Disease Stage | Target Gene | RSS | Regulon Activity |
| ∗The dot plots of a searched regulon are shown for all cell subpopulations in each disease state of each tissue based on the regulon specific score inferred using pySCENIC and by calculating the average expression. |
| Page: 1 |
Top |
Somatic mutation of malignant transformation related genes |
| Annotation of somatic variants for genes involved in malignant transformation |
| Hugo Symbol | Variant Class | Variant Classification | dbSNP RS | HGVSc | HGVSp | HGVSp Short | SWISSPROT | BIOTYPE | SIFT | PolyPhen | Tumor Sample Barcode | Tissue | Histology | Sex | Age | Stage | Therapy Types | Drugs | Outcome |
| CDCA4 | SNV | Missense_Mutation | novel | c.715G>A | p.Val239Met | p.V239M | Q9BXL8 | protein_coding | deleterious(0) | probably_damaging(0.998) | TCGA-AC-A4ZE-01 | Breast | breast invasive carcinoma | Female | <65 | I/II | Unknown | Unknown | SD |
| CDCA4 | SNV | Missense_Mutation | c.176N>T | p.Ser59Leu | p.S59L | Q9BXL8 | protein_coding | deleterious(0) | benign(0.167) | TCGA-BH-A0HP-01 | Breast | breast invasive carcinoma | Female | >=65 | III/IV | Chemotherapy | doxorubicin | SD | |
| CDCA4 | SNV | Missense_Mutation | c.401N>T | p.Ser134Leu | p.S134L | Q9BXL8 | protein_coding | tolerated(0.18) | benign(0.084) | TCGA-EK-A2PG-01 | Cervix | cervical & endocervical cancer | Female | >=65 | I/II | Unknown | Unknown | SD | |
| CDCA4 | SNV | Missense_Mutation | c.547G>C | p.Asp183His | p.D183H | Q9BXL8 | protein_coding | deleterious(0) | possibly_damaging(0.888) | TCGA-IR-A3LK-01 | Cervix | cervical & endocervical cancer | Female | >=65 | I/II | Chemotherapy | cisplatin | PD | |
| CDCA4 | SNV | Missense_Mutation | c.219G>A | p.Met73Ile | p.M73I | Q9BXL8 | protein_coding | deleterious(0) | probably_damaging(0.995) | TCGA-IR-A3LK-01 | Cervix | cervical & endocervical cancer | Female | >=65 | I/II | Chemotherapy | cisplatin | PD | |
| CDCA4 | SNV | Missense_Mutation | novel | c.530N>C | p.Met177Thr | p.M177T | Q9BXL8 | protein_coding | deleterious(0.05) | benign(0.021) | TCGA-A6-2672-01 | Colorectum | colon adenocarcinoma | Female | >=65 | III/IV | Unknown | Unknown | SD |
| CDCA4 | SNV | Missense_Mutation | c.605N>T | p.Ala202Val | p.A202V | Q9BXL8 | protein_coding | tolerated(0.12) | benign(0.122) | TCGA-A6-6781-01 | Colorectum | colon adenocarcinoma | Male | <65 | III/IV | Chemotherapy | oxaliplatin | SD | |
| CDCA4 | SNV | Missense_Mutation | rs768754038 | c.67N>A | p.Gly23Ser | p.G23S | Q9BXL8 | protein_coding | tolerated(0.11) | benign(0.206) | TCGA-CM-6162-01 | Colorectum | colon adenocarcinoma | Female | <65 | III/IV | Chemotherapy | oxaliplatin | SD |
| CDCA4 | SNV | Missense_Mutation | rs372232233 | c.266N>A | p.Arg89Gln | p.R89Q | Q9BXL8 | protein_coding | tolerated(0.91) | benign(0) | TCGA-D5-6930-01 | Colorectum | colon adenocarcinoma | Male | >=65 | I/II | Unknown | Unknown | SD |
| CDCA4 | insertion | Frame_Shift_Ins | novel | c.674_675insA | p.Ser226ValfsTer31 | p.S226Vfs*31 | Q9BXL8 | protein_coding | TCGA-CK-5916-01 | Colorectum | colon adenocarcinoma | Female | >=65 | I/II | Unknown | Unknown | PD |
| Page: 1 2 3 |
Top |
Related drugs of malignant transformation related genes |
| Identification of chemicals and drugs interact with genes involved in malignant transfromation |
| (DGIdb 4.0) |
| Entrez ID | Symbol | Category | Interaction Types | Drug Claim Name | Drug Name | PMIDs |
| Page: 1 |

Copyright 2023-Present -The University of Texas Health Science Center at Houston |