
|
|||||
|
 | |
| |
| |
| |
| |
| |
|
Gene: CDCA3 |
Gene summary for CDCA3 |
| Gene information | Species | Human | Gene symbol | CDCA3 | Gene ID | 83461 |
| Gene name | cell division cycle associated 3 | |
| Gene Alias | GRCC8 | |
| Cytomap | 12p13.31 | |
| Gene Type | protein-coding | GO ID | GO:0006464 | UniProtAcc | J3KMY0 |
Top |
Malignant transformation analysis |
| Identification of the aberrant gene expression in precancerous and cancerous lesions by comparing the gene expression of stem-like cells in diseased tissues with normal stem cells |
| Entrez ID | Symbol | Replicates | Species | Organ | Tissue | Adj P-value | Log2FC | Malignancy |
| 83461 | CDCA3 | P2T-E | Human | Esophagus | ESCC | 2.02e-06 | 4.84e-01 | 0.1177 |
| 83461 | CDCA3 | P4T-E | Human | Esophagus | ESCC | 1.60e-12 | 6.36e-01 | 0.1323 |
| 83461 | CDCA3 | P5T-E | Human | Esophagus | ESCC | 1.62e-13 | 4.30e-01 | 0.1327 |
| 83461 | CDCA3 | P9T-E | Human | Esophagus | ESCC | 1.56e-02 | 1.73e-01 | 0.1131 |
| 83461 | CDCA3 | P10T-E | Human | Esophagus | ESCC | 9.44e-07 | 2.39e-01 | 0.116 |
| 83461 | CDCA3 | P16T-E | Human | Esophagus | ESCC | 4.30e-10 | 3.84e-01 | 0.1153 |
| 83461 | CDCA3 | P17T-E | Human | Esophagus | ESCC | 6.72e-05 | 6.42e-01 | 0.1278 |
| 83461 | CDCA3 | P19T-E | Human | Esophagus | ESCC | 4.08e-02 | 5.16e-01 | 0.1662 |
| 83461 | CDCA3 | P21T-E | Human | Esophagus | ESCC | 9.56e-08 | 2.39e-01 | 0.1617 |
| 83461 | CDCA3 | P22T-E | Human | Esophagus | ESCC | 3.75e-03 | 2.46e-01 | 0.1236 |
| 83461 | CDCA3 | P24T-E | Human | Esophagus | ESCC | 1.53e-19 | 6.83e-01 | 0.1287 |
| 83461 | CDCA3 | P27T-E | Human | Esophagus | ESCC | 7.90e-03 | 1.61e-01 | 0.1055 |
| 83461 | CDCA3 | P28T-E | Human | Esophagus | ESCC | 1.66e-02 | 1.45e-01 | 0.1149 |
| 83461 | CDCA3 | P31T-E | Human | Esophagus | ESCC | 9.56e-08 | 3.16e-01 | 0.1251 |
| 83461 | CDCA3 | P32T-E | Human | Esophagus | ESCC | 2.56e-16 | 4.30e-01 | 0.1666 |
| 83461 | CDCA3 | P37T-E | Human | Esophagus | ESCC | 1.67e-06 | 2.95e-01 | 0.1371 |
| 83461 | CDCA3 | P38T-E | Human | Esophagus | ESCC | 4.73e-08 | 5.18e-01 | 0.127 |
| 83461 | CDCA3 | P44T-E | Human | Esophagus | ESCC | 5.45e-03 | 2.62e-01 | 0.1096 |
| 83461 | CDCA3 | P47T-E | Human | Esophagus | ESCC | 8.84e-05 | 1.47e-01 | 0.1067 |
| 83461 | CDCA3 | P52T-E | Human | Esophagus | ESCC | 2.93e-15 | 5.00e-01 | 0.1555 |
| Page: 1 2 3 |
| Tissue | Expression Dynamics | Abbreviation |
| Esophagus |  | ESCC: Esophageal squamous cell carcinoma |
| HGIN: High-grade intraepithelial neoplasias | ||
| LGIN: Low-grade intraepithelial neoplasias | ||
| Liver | 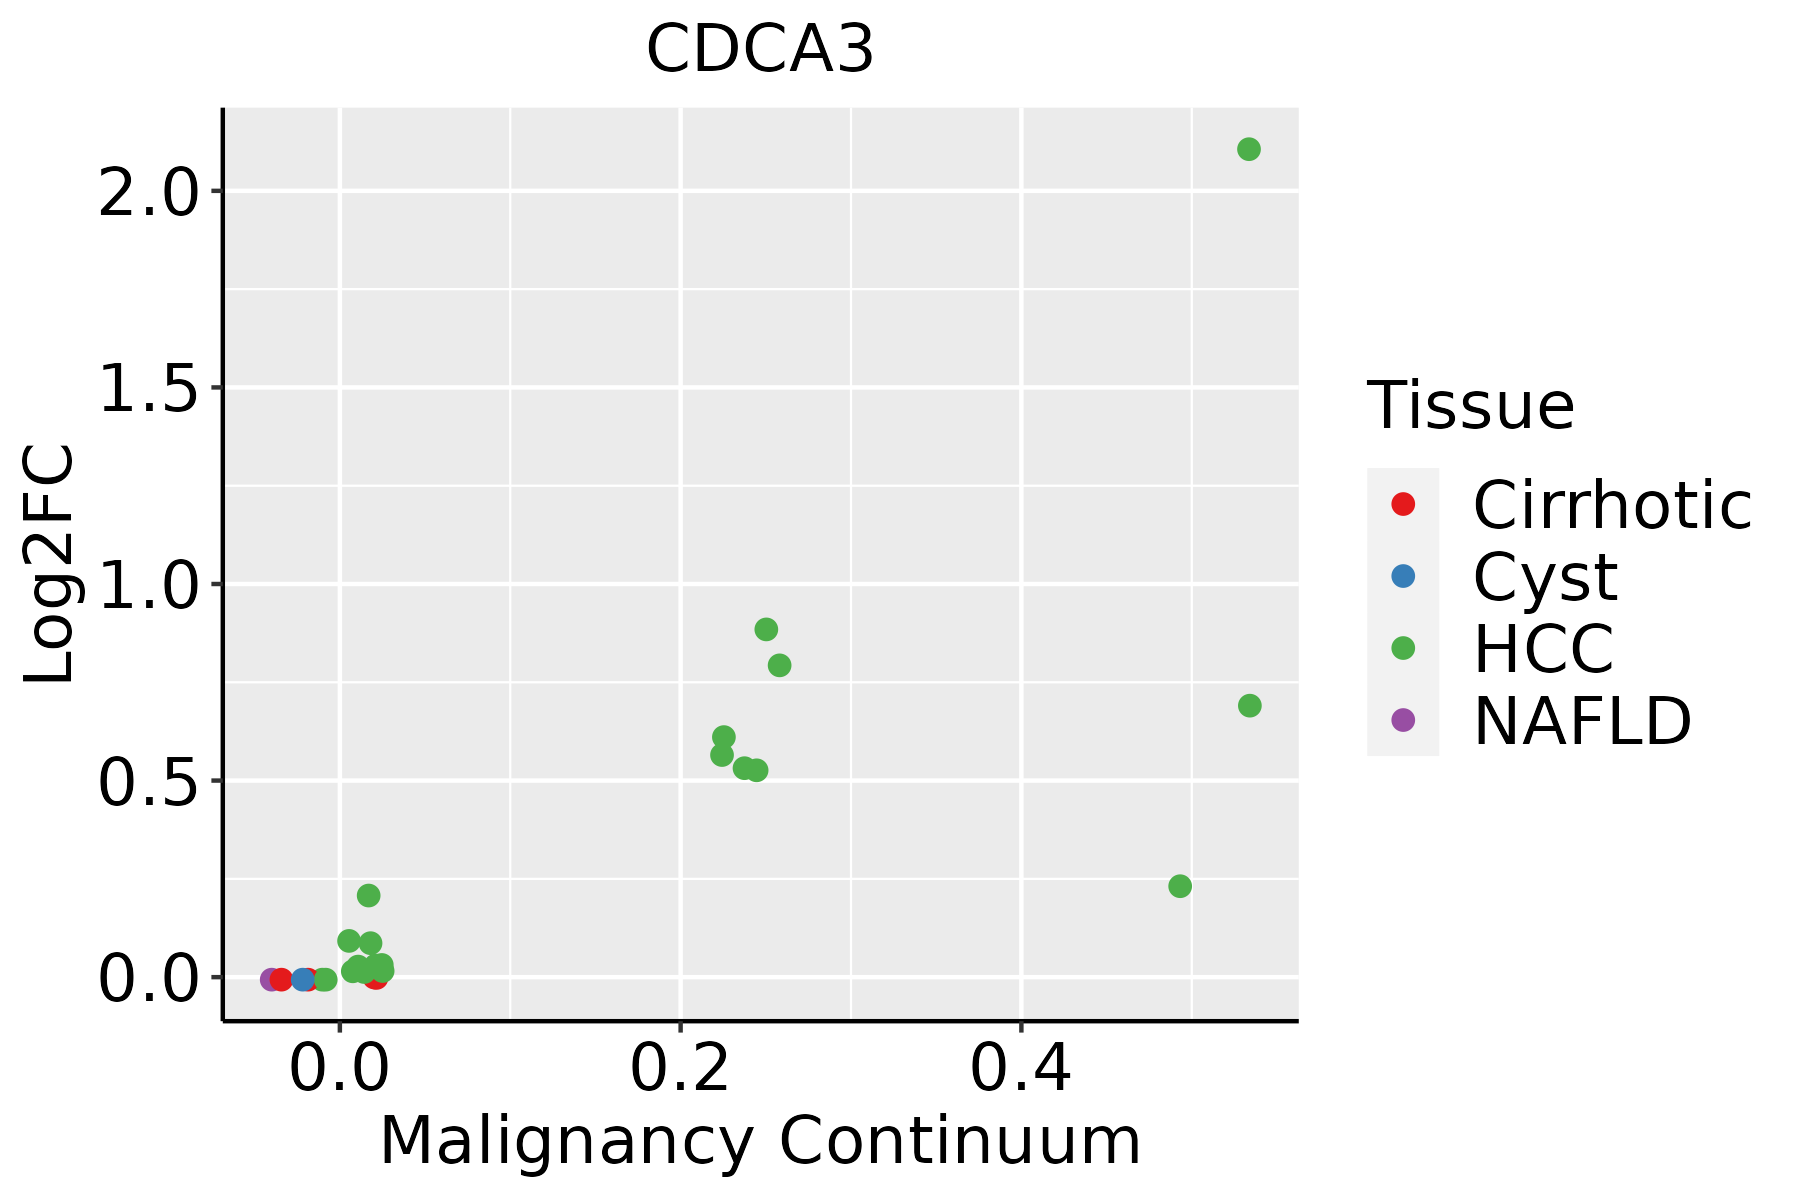 | HCC: Hepatocellular carcinoma |
| NAFLD: Non-alcoholic fatty liver disease | ||
| Oral Cavity | 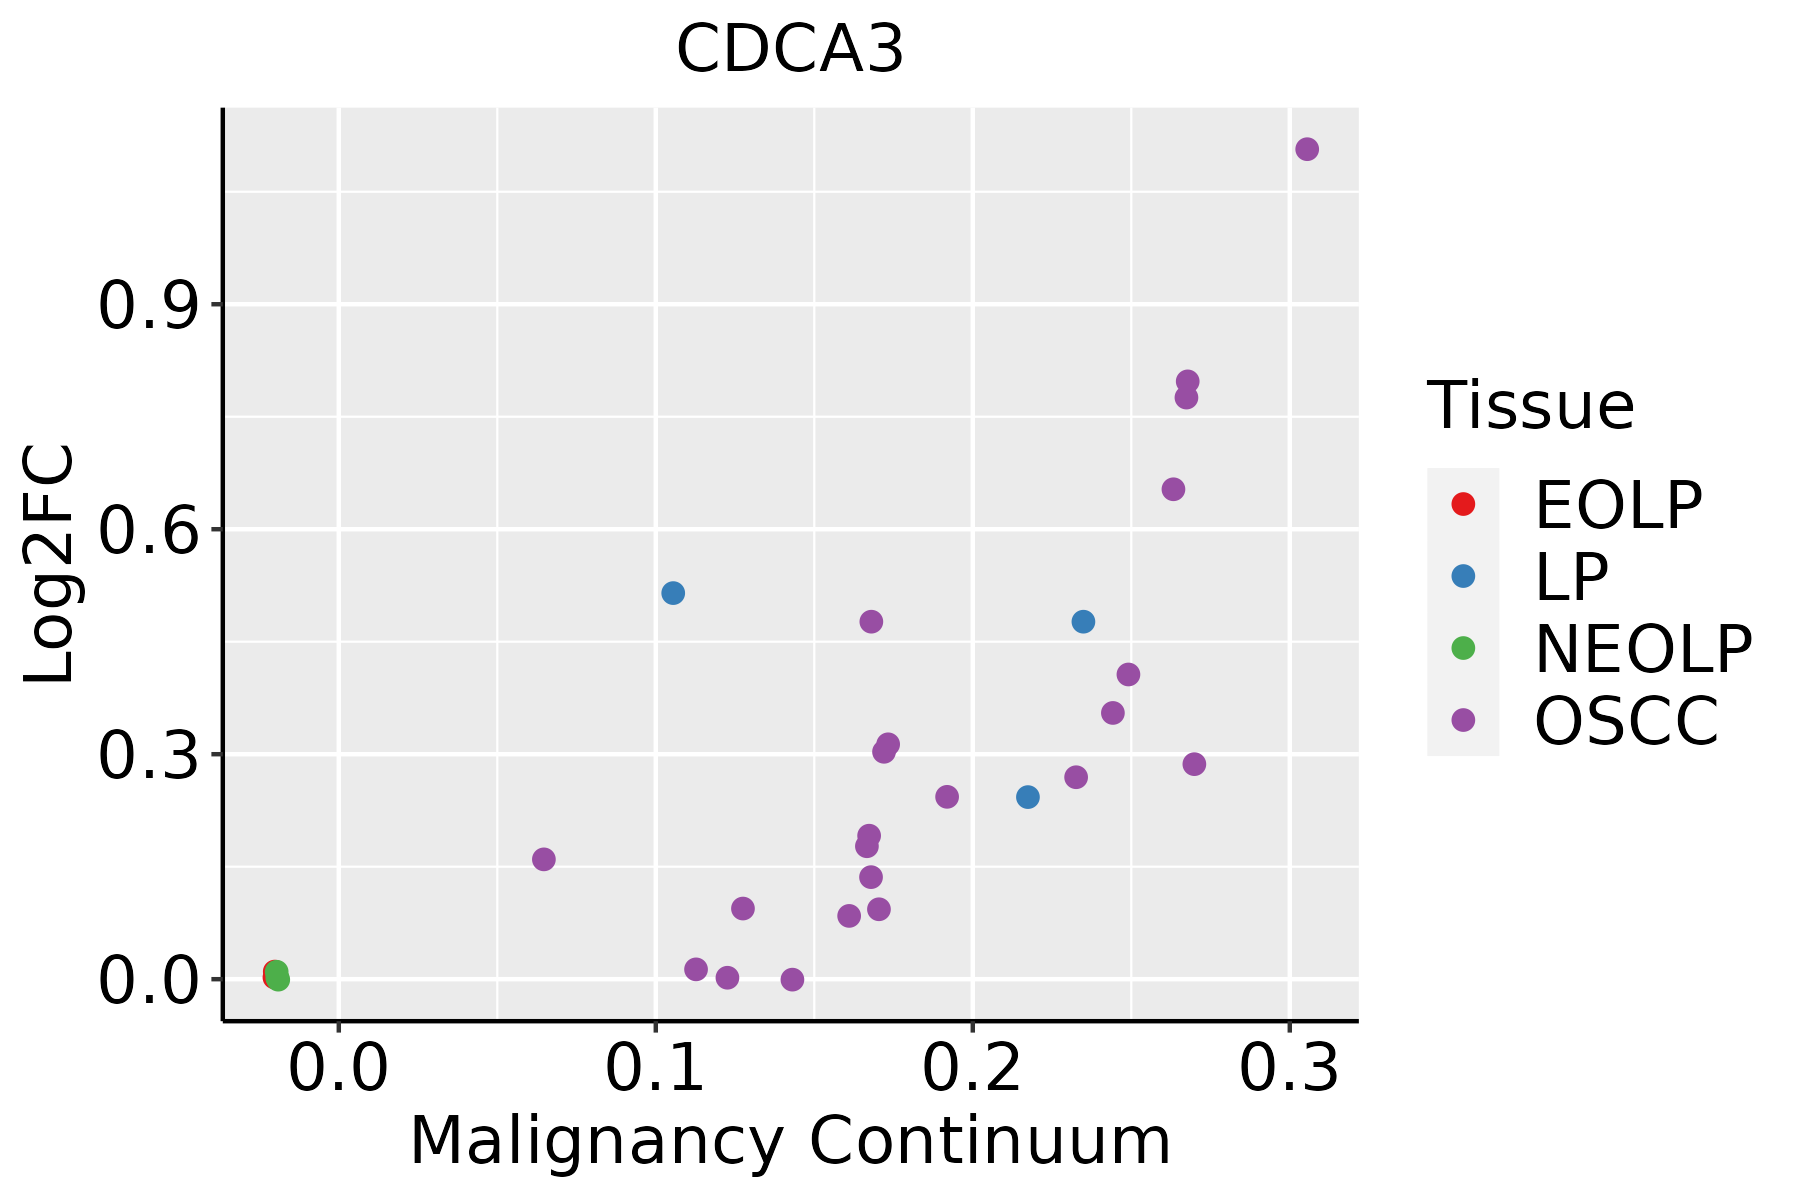 | EOLP: Erosive Oral lichen planus |
| LP: leukoplakia | ||
| NEOLP: Non-erosive oral lichen planus | ||
| OSCC: Oral squamous cell carcinoma | ||
| Skin |  | AK: Actinic keratosis |
| cSCC: Cutaneous squamous cell carcinoma | ||
| SCCIS:squamous cell carcinoma in situ | ||
| Thyroid | 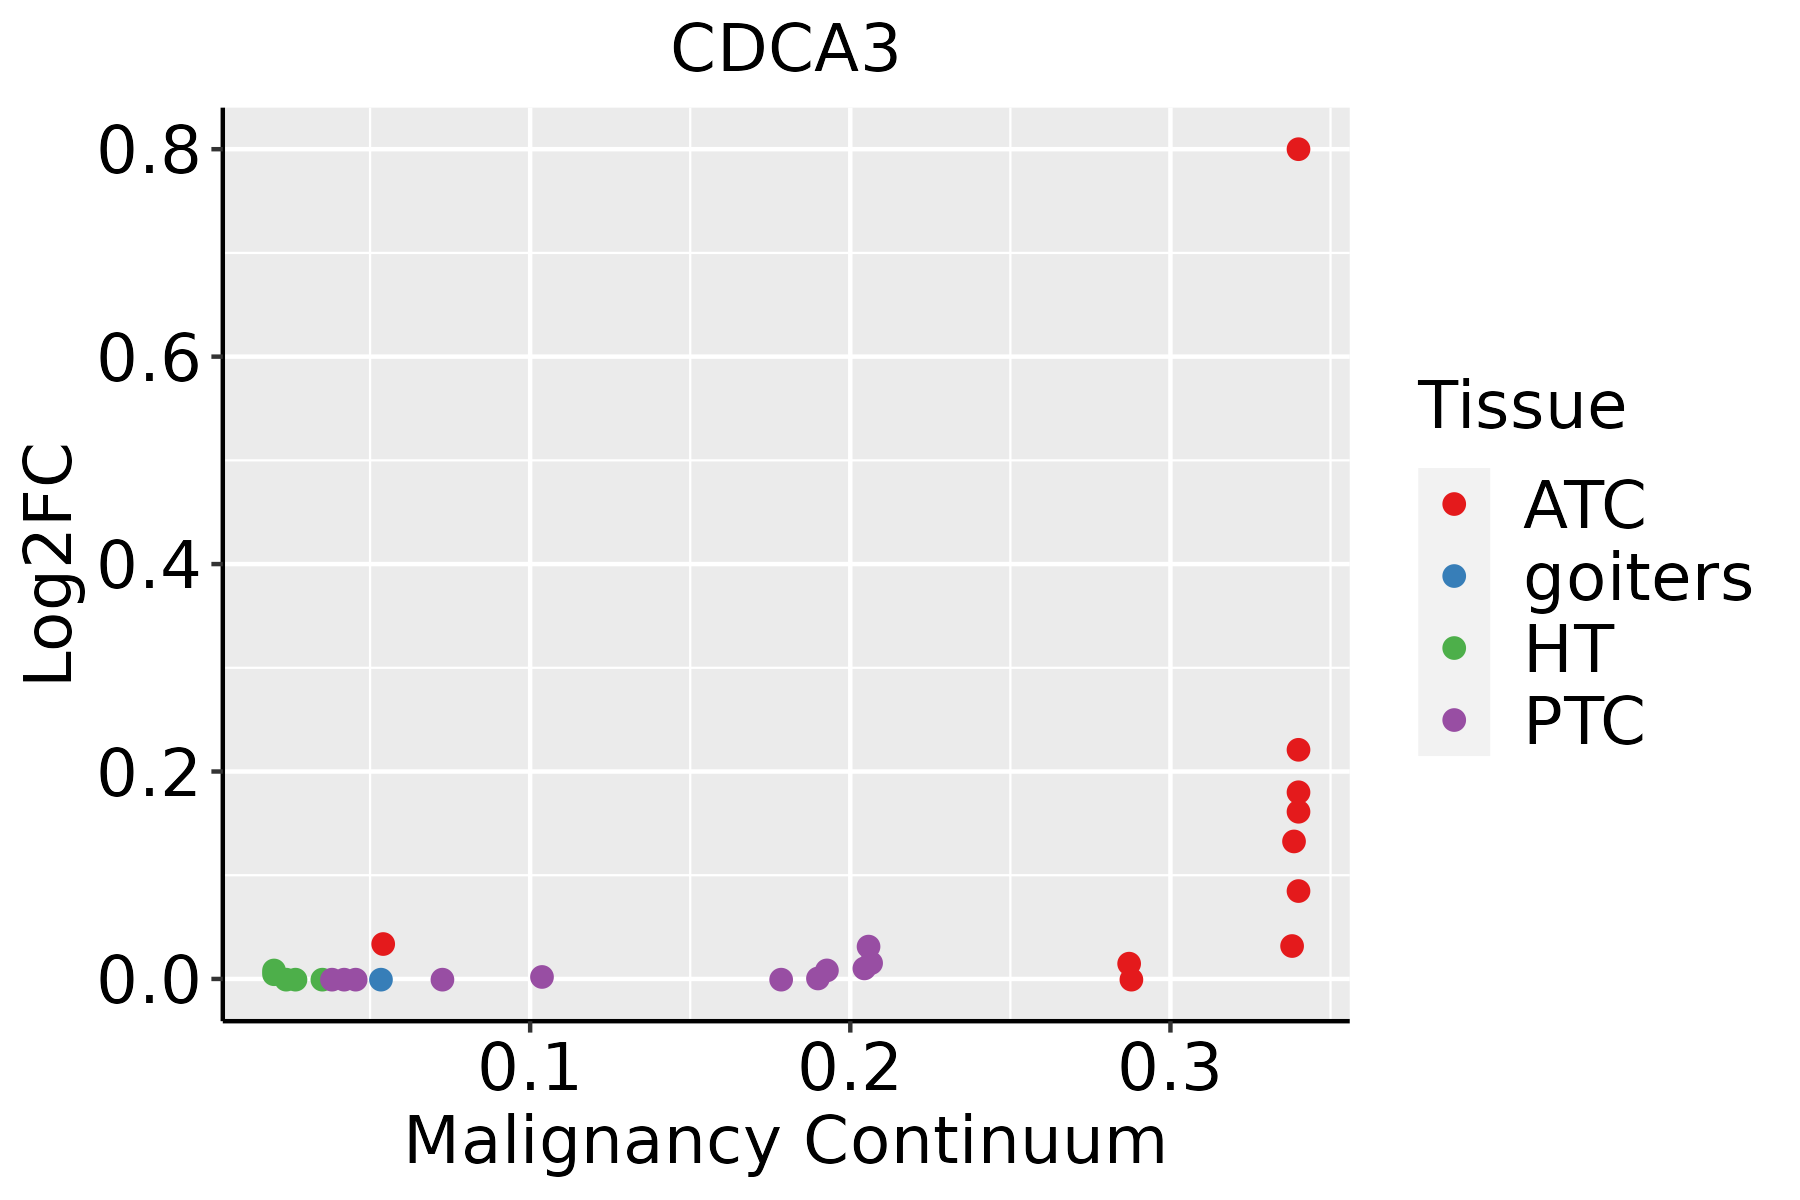 | ATC: Anaplastic thyroid cancer |
| HT: Hashimoto's thyroiditis | ||
| PTC: Papillary thyroid cancer |
| ∗log2FC in expression of this searched gene in stem-like cells from each diseased tissue sample relative to stem-like cells in normal samples in each tissue plotted against the malignancy continuum. Samples are colored based on if they are from different disease stage. |
Top |
Malignant transformation related pathway analysis |
| Find out the enriched GO biological processes and KEGG pathways involved in transition from healthy to precancer to cancer |
| Tissue | Disease Stage | Enriched GO biological Processes |
| Colorectum | AD |  |
| Colorectum | SER |  |
| Colorectum | MSS |  |
| Colorectum | MSI-H |  |
| Colorectum | FAP |  |
| ∗Top 15 enriched GO BP terms are showed in the bar plot of each disease state in each tissue. Each row represents a significant GO biological process which is colored according to the -log10(p.adjust). |
| Page: 1 2 3 4 5 6 7 8 9 |
| GO ID | Tissue | Disease Stage | Description | Gene Ratio | Bg Ratio | pvalue | p.adjust | Count |
| Page: 1 |
| Pathway ID | Tissue | Disease Stage | Description | Gene Ratio | Bg Ratio | pvalue | p.adjust | qvalue | Count |
| Page: 1 |
Top |
Cell-cell communication analysis |
| Identification of potential cell-cell interactions between two cell types and their ligand-receptor pairs for different disease states |
| Ligand | Receptor | LRpair | Pathway | Tissue | Disease Stage |
| Page: 1 |
Top |
Single-cell gene regulatory network inference analysis |
| Find out the significant the regulons (TFs) and the target genes of each regulon across cell types for different disease states |
| TF | Cell Type | Tissue | Disease Stage | Target Gene | RSS | Regulon Activity |
| ∗The dot plots of a searched regulon are shown for all cell subpopulations in each disease state of each tissue based on the regulon specific score inferred using pySCENIC and by calculating the average expression. |
| Page: 1 |
Top |
Somatic mutation of malignant transformation related genes |
| Annotation of somatic variants for genes involved in malignant transformation |
| Hugo Symbol | Variant Class | Variant Classification | dbSNP RS | HGVSc | HGVSp | HGVSp Short | SWISSPROT | BIOTYPE | SIFT | PolyPhen | Tumor Sample Barcode | Tissue | Histology | Sex | Age | Stage | Therapy Types | Drugs | Outcome |
| CDCA3 | SNV | Missense_Mutation | c.515N>T | p.Ser172Leu | p.S172L | Q99618 | protein_coding | tolerated(0.9) | benign(0) | TCGA-A8-A094-01 | Breast | breast invasive carcinoma | Female | >=65 | I/II | Unknown | Unknown | SD | |
| CDCA3 | SNV | Missense_Mutation | rs78438445 | c.376N>A | p.Leu126Met | p.L126M | Q99618 | protein_coding | tolerated(0.15) | benign(0.392) | TCGA-B6-A0RE-01 | Breast | breast invasive carcinoma | Female | <65 | I/II | Unknown | Unknown | SD |
| CDCA3 | SNV | Missense_Mutation | novel | c.491C>A | p.Ala164Asp | p.A164D | Q99618 | protein_coding | deleterious(0.01) | possibly_damaging(0.553) | TCGA-OL-A6VQ-01 | Breast | breast invasive carcinoma | Female | <65 | I/II | Unknown | Unknown | SD |
| CDCA3 | insertion | Nonsense_Mutation | novel | c.373_374insTTTAACGCCTTACCCACCCCAGGTT | p.Pro125LeufsTer2 | p.P125Lfs*2 | Q99618 | protein_coding | TCGA-B6-A0RE-01 | Breast | breast invasive carcinoma | Female | <65 | I/II | Unknown | Unknown | SD | ||
| CDCA3 | SNV | Missense_Mutation | novel | c.544N>T | p.Gly182Cys | p.G182C | Q99618 | protein_coding | deleterious(0) | probably_damaging(0.99) | TCGA-2W-A8YY-01 | Cervix | cervical & endocervical cancer | Female | <65 | I/II | Chemotherapy | cisplatin | CR |
| CDCA3 | SNV | Missense_Mutation | c.254N>A | p.Pro85His | p.P85H | Q99618 | protein_coding | deleterious(0.02) | possibly_damaging(0.789) | TCGA-AA-3811-01 | Colorectum | colon adenocarcinoma | Female | >=65 | III/IV | Unknown | Unknown | PD | |
| CDCA3 | SNV | Missense_Mutation | rs148172476 | c.658N>T | p.Arg220Trp | p.R220W | Q99618 | protein_coding | deleterious(0.02) | benign(0.02) | TCGA-AA-3864-01 | Colorectum | colon adenocarcinoma | Male | >=65 | I/II | Unknown | Unknown | SD |
| CDCA3 | SNV | Missense_Mutation | c.427N>C | p.Glu143Gln | p.E143Q | Q99618 | protein_coding | tolerated(0.06) | benign(0.081) | TCGA-AG-3881-01 | Colorectum | rectum adenocarcinoma | Female | >=65 | I/II | Unknown | Unknown | SD | |
| CDCA3 | SNV | Missense_Mutation | c.748N>C | p.Trp250Arg | p.W250R | Q99618 | protein_coding | tolerated(0.1) | benign(0.04) | TCGA-AG-A036-01 | Colorectum | rectum adenocarcinoma | Male | >=65 | III/IV | Chemotherapy | 5-fluorouracil | CR | |
| CDCA3 | SNV | Missense_Mutation | novel | c.786N>A | p.His262Gln | p.H262Q | Q99618 | protein_coding | tolerated(0.27) | possibly_damaging(0.696) | TCGA-AX-A1CE-01 | Endometrium | uterine corpus endometrioid carcinoma | Female | <65 | I/II | Unspecific | Paclitaxel | SD |
| Page: 1 2 3 |
Top |
Related drugs of malignant transformation related genes |
| Identification of chemicals and drugs interact with genes involved in malignant transfromation |
| (DGIdb 4.0) |
| Entrez ID | Symbol | Category | Interaction Types | Drug Claim Name | Drug Name | PMIDs |
| Page: 1 |

Copyright 2023-Present -The University of Texas Health Science Center at Houston |