
|
|||||
|
 | |
| |
| |
| |
| |
| |
|
Gene: CDCA2 |
Gene summary for CDCA2 |
| Gene information | Species | Human | Gene symbol | CDCA2 | Gene ID | 157313 |
| Gene name | cell division cycle associated 2 | |
| Gene Alias | PPP1R81 | |
| Cytomap | 8p21.2 | |
| Gene Type | protein-coding | GO ID | GO:0000278 | UniProtAcc | A8K8Z0 |
Top |
Malignant transformation analysis |
| Identification of the aberrant gene expression in precancerous and cancerous lesions by comparing the gene expression of stem-like cells in diseased tissues with normal stem cells |
| Entrez ID | Symbol | Replicates | Species | Organ | Tissue | Adj P-value | Log2FC | Malignancy |
| 157313 | CDCA2 | P2T-E | Human | Esophagus | ESCC | 4.30e-10 | 4.50e-01 | 0.1177 |
| 157313 | CDCA2 | P4T-E | Human | Esophagus | ESCC | 1.49e-09 | 3.91e-01 | 0.1323 |
| 157313 | CDCA2 | P5T-E | Human | Esophagus | ESCC | 9.35e-10 | 2.36e-01 | 0.1327 |
| 157313 | CDCA2 | P10T-E | Human | Esophagus | ESCC | 3.89e-12 | 3.07e-01 | 0.116 |
| 157313 | CDCA2 | P16T-E | Human | Esophagus | ESCC | 8.40e-04 | 1.60e-01 | 0.1153 |
| 157313 | CDCA2 | P20T-E | Human | Esophagus | ESCC | 2.18e-03 | 2.07e-01 | 0.1124 |
| 157313 | CDCA2 | P21T-E | Human | Esophagus | ESCC | 4.17e-05 | 1.72e-01 | 0.1617 |
| 157313 | CDCA2 | P24T-E | Human | Esophagus | ESCC | 9.53e-09 | 3.31e-01 | 0.1287 |
| 157313 | CDCA2 | P28T-E | Human | Esophagus | ESCC | 3.60e-13 | 2.77e-01 | 0.1149 |
| 157313 | CDCA2 | P31T-E | Human | Esophagus | ESCC | 3.75e-03 | 1.28e-01 | 0.1251 |
| 157313 | CDCA2 | P32T-E | Human | Esophagus | ESCC | 8.40e-04 | 1.26e-01 | 0.1666 |
| 157313 | CDCA2 | P36T-E | Human | Esophagus | ESCC | 2.98e-06 | 2.73e-01 | 0.1187 |
| 157313 | CDCA2 | P37T-E | Human | Esophagus | ESCC | 1.83e-06 | 2.03e-01 | 0.1371 |
| 157313 | CDCA2 | P38T-E | Human | Esophagus | ESCC | 1.30e-06 | 3.71e-01 | 0.127 |
| 157313 | CDCA2 | P49T-E | Human | Esophagus | ESCC | 7.48e-03 | 4.04e-01 | 0.1768 |
| 157313 | CDCA2 | P52T-E | Human | Esophagus | ESCC | 4.41e-07 | 1.91e-01 | 0.1555 |
| 157313 | CDCA2 | P54T-E | Human | Esophagus | ESCC | 9.92e-04 | 1.42e-01 | 0.0975 |
| 157313 | CDCA2 | P61T-E | Human | Esophagus | ESCC | 9.78e-04 | 1.49e-01 | 0.099 |
| 157313 | CDCA2 | P74T-E | Human | Esophagus | ESCC | 2.03e-13 | 4.99e-01 | 0.1479 |
| 157313 | CDCA2 | P75T-E | Human | Esophagus | ESCC | 1.66e-02 | 1.45e-01 | 0.1125 |
| Page: 1 2 |
| Tissue | Expression Dynamics | Abbreviation |
| Esophagus | 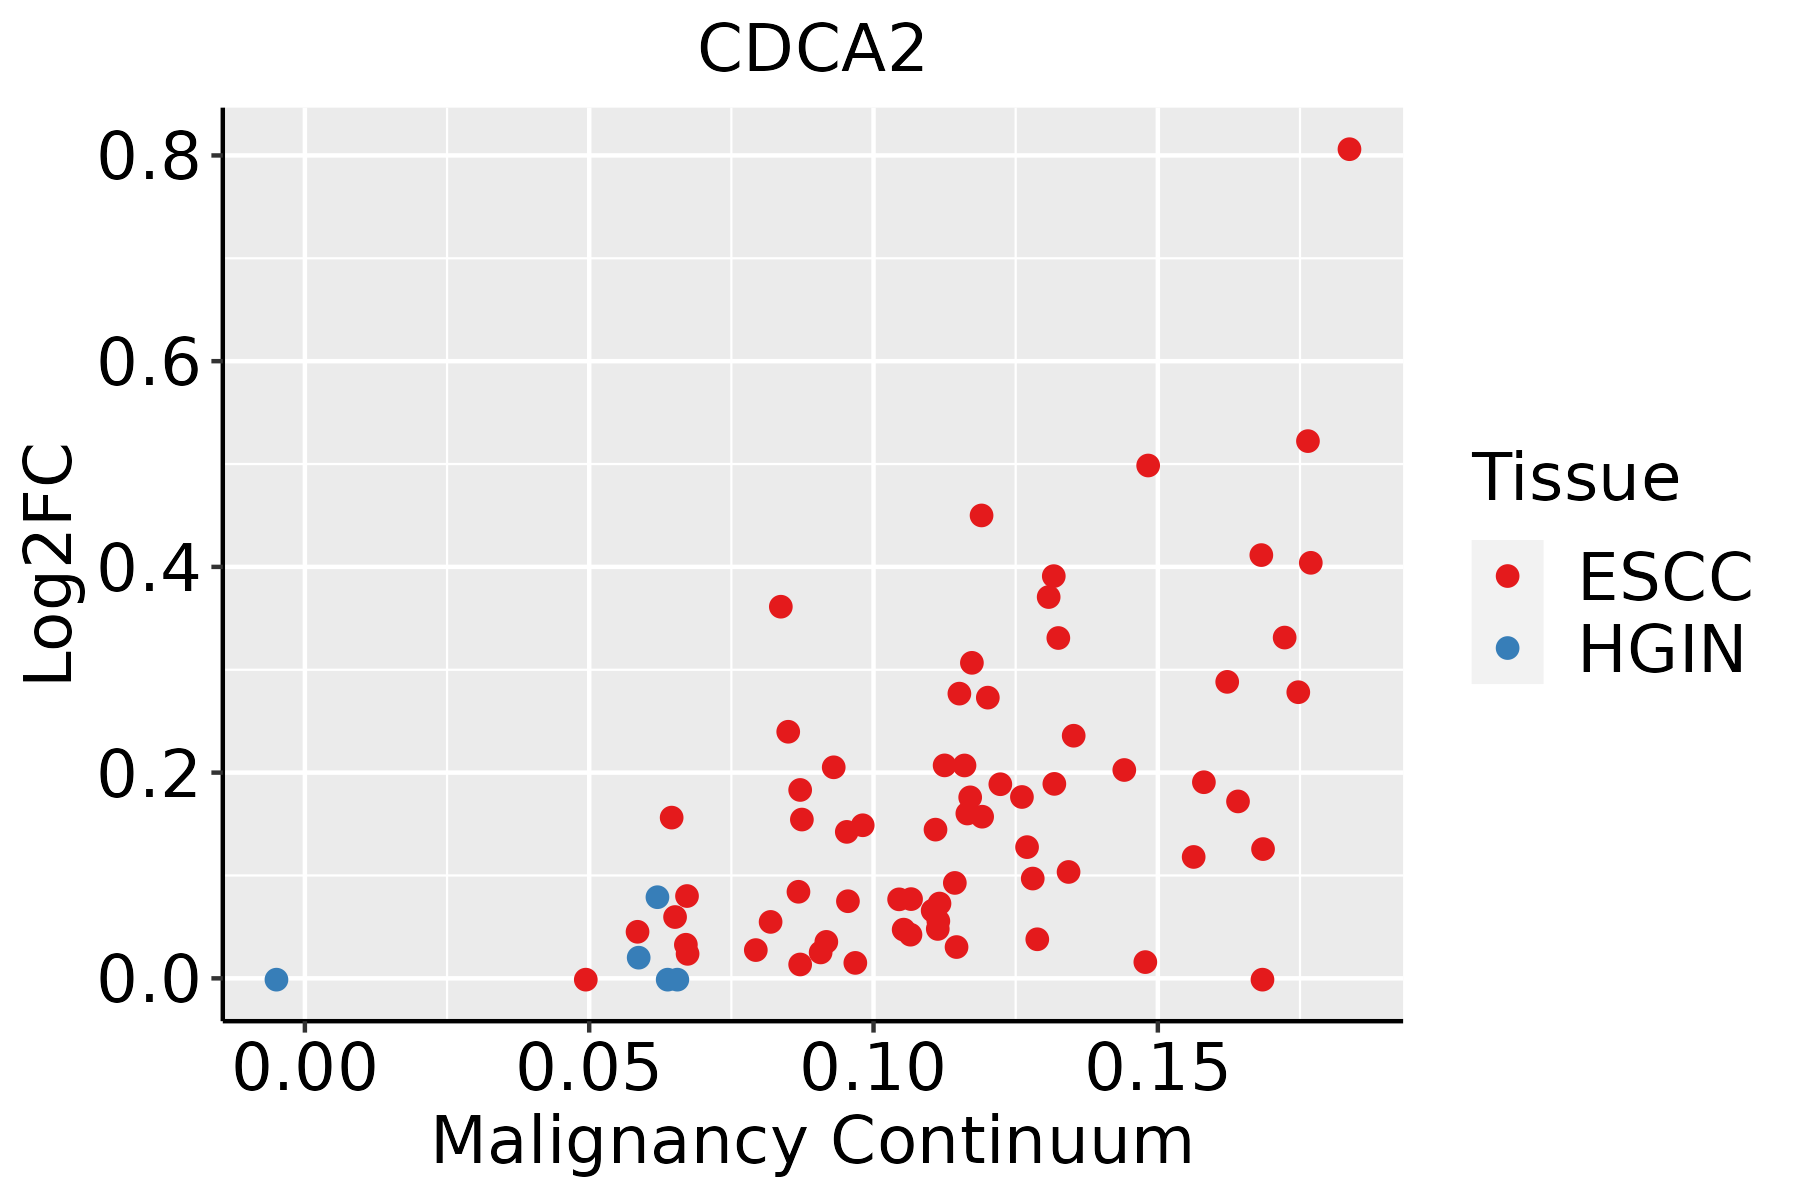 | ESCC: Esophageal squamous cell carcinoma |
| HGIN: High-grade intraepithelial neoplasias | ||
| LGIN: Low-grade intraepithelial neoplasias |
| ∗log2FC in expression of this searched gene in stem-like cells from each diseased tissue sample relative to stem-like cells in normal samples in each tissue plotted against the malignancy continuum. Samples are colored based on if they are from different disease stage. |
Top |
Malignant transformation related pathway analysis |
| Find out the enriched GO biological processes and KEGG pathways involved in transition from healthy to precancer to cancer |
| Tissue | Disease Stage | Enriched GO biological Processes |
| Colorectum | AD |  |
| Colorectum | SER |  |
| Colorectum | MSS |  |
| Colorectum | MSI-H |  |
| Colorectum | FAP |  |
| ∗Top 15 enriched GO BP terms are showed in the bar plot of each disease state in each tissue. Each row represents a significant GO biological process which is colored according to the -log10(p.adjust). |
| Page: 1 2 3 4 5 6 7 8 9 |
| GO ID | Tissue | Disease Stage | Description | Gene Ratio | Bg Ratio | pvalue | p.adjust | Count |
| GO:014001414 | Esophagus | ESCC | mitotic nuclear division | 218/8552 | 287/18723 | 6.17e-26 | 1.78e-23 | 218 |
| GO:000705911 | Esophagus | ESCC | chromosome segregation | 238/8552 | 346/18723 | 1.72e-18 | 1.82e-16 | 238 |
| GO:000734615 | Esophagus | ESCC | regulation of mitotic cell cycle | 293/8552 | 457/18723 | 8.00e-16 | 5.64e-14 | 293 |
| GO:00482853 | Esophagus | ESCC | organelle fission | 301/8552 | 488/18723 | 4.64e-13 | 2.12e-11 | 301 |
| GO:00002802 | Esophagus | ESCC | nuclear division | 270/8552 | 439/18723 | 1.17e-11 | 4.24e-10 | 270 |
| GO:001631110 | Esophagus | ESCC | dephosphorylation | 251/8552 | 417/18723 | 1.26e-09 | 2.99e-08 | 251 |
| GO:000647018 | Esophagus | ESCC | protein dephosphorylation | 177/8552 | 281/18723 | 3.13e-09 | 6.72e-08 | 177 |
| GO:00519833 | Esophagus | ESCC | regulation of chromosome segregation | 67/8552 | 91/18723 | 5.42e-08 | 9.66e-07 | 67 |
| GO:00070883 | Esophagus | ESCC | regulation of mitotic nuclear division | 78/8552 | 110/18723 | 6.96e-08 | 1.21e-06 | 78 |
| GO:0035304111 | Esophagus | ESCC | regulation of protein dephosphorylation | 66/8552 | 90/18723 | 8.82e-08 | 1.48e-06 | 66 |
| GO:0035303111 | Esophagus | ESCC | regulation of dephosphorylation | 88/8552 | 128/18723 | 1.04e-07 | 1.71e-06 | 88 |
| GO:00517831 | Esophagus | ESCC | regulation of nuclear division | 90/8552 | 139/18723 | 4.30e-06 | 4.60e-05 | 90 |
| GO:00353074 | Esophagus | ESCC | positive regulation of protein dephosphorylation | 31/8552 | 45/18723 | 1.40e-03 | 6.62e-03 | 31 |
| GO:00353066 | Esophagus | ESCC | positive regulation of dephosphorylation | 38/8552 | 59/18723 | 2.86e-03 | 1.21e-02 | 38 |
| Page: 1 |
| Pathway ID | Tissue | Disease Stage | Description | Gene Ratio | Bg Ratio | pvalue | p.adjust | qvalue | Count |
| Page: 1 |
Top |
Cell-cell communication analysis |
| Identification of potential cell-cell interactions between two cell types and their ligand-receptor pairs for different disease states |
| Ligand | Receptor | LRpair | Pathway | Tissue | Disease Stage |
| Page: 1 |
Top |
Single-cell gene regulatory network inference analysis |
| Find out the significant the regulons (TFs) and the target genes of each regulon across cell types for different disease states |
| TF | Cell Type | Tissue | Disease Stage | Target Gene | RSS | Regulon Activity |
| ∗The dot plots of a searched regulon are shown for all cell subpopulations in each disease state of each tissue based on the regulon specific score inferred using pySCENIC and by calculating the average expression. |
| Page: 1 |
Top |
Somatic mutation of malignant transformation related genes |
| Annotation of somatic variants for genes involved in malignant transformation |
| Hugo Symbol | Variant Class | Variant Classification | dbSNP RS | HGVSc | HGVSp | HGVSp Short | SWISSPROT | BIOTYPE | SIFT | PolyPhen | Tumor Sample Barcode | Tissue | Histology | Sex | Age | Stage | Therapy Types | Drugs | Outcome |
| CDCA2 | SNV | Missense_Mutation | c.2731N>T | p.Pro911Ser | p.P911S | Q69YH5 | protein_coding | deleterious(0.01) | possibly_damaging(0.833) | TCGA-A1-A0SH-01 | Breast | breast invasive carcinoma | Female | <65 | I/II | Chemotherapy | tc | SD | |
| CDCA2 | SNV | Missense_Mutation | c.373N>C | p.Asp125His | p.D125H | Q69YH5 | protein_coding | deleterious(0.03) | possibly_damaging(0.465) | TCGA-A2-A0CX-01 | Breast | breast invasive carcinoma | Female | <65 | I/II | Chemotherapy | adriamycin | SD | |
| CDCA2 | SNV | Missense_Mutation | c.577N>C | p.Phe193Leu | p.F193L | Q69YH5 | protein_coding | tolerated(0.21) | benign(0.009) | TCGA-AN-A0XO-01 | Breast | breast invasive carcinoma | Female | <65 | III/IV | Unknown | Unknown | SD | |
| CDCA2 | SNV | Missense_Mutation | c.2869N>G | p.Pro957Ala | p.P957A | Q69YH5 | protein_coding | tolerated(0.3) | benign(0.001) | TCGA-AR-A0TS-01 | Breast | breast invasive carcinoma | Female | <65 | I/II | Chemotherapy | doxorubicin | SD | |
| CDCA2 | SNV | Missense_Mutation | rs770182441 | c.700N>A | p.Ala234Thr | p.A234T | Q69YH5 | protein_coding | tolerated(0.91) | benign(0) | TCGA-BH-A0HF-01 | Breast | breast invasive carcinoma | Female | >=65 | I/II | Hormone Therapy | arimidex | SD |
| CDCA2 | SNV | Missense_Mutation | rs748745545 | c.239N>T | p.Ser80Leu | p.S80L | Q69YH5 | protein_coding | deleterious(0.02) | possibly_damaging(0.646) | TCGA-D8-A27V-01 | Breast | breast invasive carcinoma | Female | <65 | I/II | Hormone Therapy | tamoxiphen | SD |
| CDCA2 | SNV | Missense_Mutation | c.1159A>G | p.Met387Val | p.M387V | Q69YH5 | protein_coding | tolerated(1) | benign(0) | TCGA-E9-A1N5-01 | Breast | breast invasive carcinoma | Female | <65 | I/II | Chemotherapy | doxorubicin | SD | |
| CDCA2 | insertion | Frame_Shift_Ins | novel | c.366_367insTTACTAA | p.Ala123LeufsTer19 | p.A123Lfs*19 | Q69YH5 | protein_coding | TCGA-AR-A0TY-01 | Breast | breast invasive carcinoma | Female | <65 | I/II | Unspecific | Paclitaxel | PD | ||
| CDCA2 | insertion | Nonsense_Mutation | novel | c.367_368insTGTTCACTGAATGAATGAATGAATGAATGATGAATTAAT | p.Ala123delinsValPheThrGluTerMetAsnGluTerMetMetAsnTerSer | p.A123delinsVFTE*MNE*MMN*S | Q69YH5 | protein_coding | TCGA-AR-A0TY-01 | Breast | breast invasive carcinoma | Female | <65 | I/II | Unspecific | Paclitaxel | PD | ||
| CDCA2 | insertion | Frame_Shift_Ins | novel | c.1586_1587insATACATATATTACCCAATTATA | p.Gln530TyrfsTer11 | p.Q530Yfs*11 | Q69YH5 | protein_coding | TCGA-AR-A0U0-01 | Breast | breast invasive carcinoma | Female | >=65 | I/II | Unknown | Unknown | SD |
| Page: 1 2 3 4 5 6 7 8 9 10 11 |
Top |
Related drugs of malignant transformation related genes |
| Identification of chemicals and drugs interact with genes involved in malignant transfromation |
| (DGIdb 4.0) |
| Entrez ID | Symbol | Category | Interaction Types | Drug Claim Name | Drug Name | PMIDs |
| Page: 1 |

Copyright 2023-Present -The University of Texas Health Science Center at Houston |