
|
|||||
|
 | |
| |
| |
| |
| |
| |
|
Gene: CDC6 |
Gene summary for CDC6 |
| Gene information | Species | Human | Gene symbol | CDC6 | Gene ID | 990 |
| Gene name | cell division cycle 6 | |
| Gene Alias | CDC18L | |
| Cytomap | 17q21.2 | |
| Gene Type | protein-coding | GO ID | GO:0000070 | UniProtAcc | A0A024R1S2 |
Top |
Malignant transformation analysis |
| Identification of the aberrant gene expression in precancerous and cancerous lesions by comparing the gene expression of stem-like cells in diseased tissues with normal stem cells |
| Entrez ID | Symbol | Replicates | Species | Organ | Tissue | Adj P-value | Log2FC | Malignancy |
| 990 | CDC6 | LZE6T | Human | Esophagus | ESCC | 7.44e-03 | 1.94e-01 | 0.0845 |
| 990 | CDC6 | P2T-E | Human | Esophagus | ESCC | 4.64e-07 | 3.67e-01 | 0.1177 |
| 990 | CDC6 | P4T-E | Human | Esophagus | ESCC | 8.08e-06 | 2.76e-01 | 0.1323 |
| 990 | CDC6 | P5T-E | Human | Esophagus | ESCC | 1.15e-17 | 3.77e-01 | 0.1327 |
| 990 | CDC6 | P16T-E | Human | Esophagus | ESCC | 4.56e-06 | 2.54e-01 | 0.1153 |
| 990 | CDC6 | P17T-E | Human | Esophagus | ESCC | 4.22e-02 | 3.63e-01 | 0.1278 |
| 990 | CDC6 | P21T-E | Human | Esophagus | ESCC | 6.75e-05 | 2.33e-01 | 0.1617 |
| 990 | CDC6 | P22T-E | Human | Esophagus | ESCC | 2.93e-03 | 1.35e-01 | 0.1236 |
| 990 | CDC6 | P23T-E | Human | Esophagus | ESCC | 1.74e-02 | 2.05e-01 | 0.108 |
| 990 | CDC6 | P24T-E | Human | Esophagus | ESCC | 1.32e-04 | 2.01e-01 | 0.1287 |
| 990 | CDC6 | P27T-E | Human | Esophagus | ESCC | 6.22e-04 | 1.50e-01 | 0.1055 |
| 990 | CDC6 | P28T-E | Human | Esophagus | ESCC | 4.38e-07 | 2.61e-01 | 0.1149 |
| 990 | CDC6 | P31T-E | Human | Esophagus | ESCC | 1.77e-13 | 4.69e-01 | 0.1251 |
| 990 | CDC6 | P32T-E | Human | Esophagus | ESCC | 7.53e-12 | 3.82e-01 | 0.1666 |
| 990 | CDC6 | P36T-E | Human | Esophagus | ESCC | 3.01e-06 | 3.89e-01 | 0.1187 |
| 990 | CDC6 | P37T-E | Human | Esophagus | ESCC | 1.60e-09 | 3.51e-01 | 0.1371 |
| 990 | CDC6 | P38T-E | Human | Esophagus | ESCC | 3.86e-05 | 3.09e-01 | 0.127 |
| 990 | CDC6 | P39T-E | Human | Esophagus | ESCC | 2.76e-03 | 1.56e-01 | 0.0894 |
| 990 | CDC6 | P47T-E | Human | Esophagus | ESCC | 2.17e-02 | 3.16e-02 | 0.1067 |
| 990 | CDC6 | P52T-E | Human | Esophagus | ESCC | 1.02e-20 | 5.25e-01 | 0.1555 |
| Page: 1 2 3 |
| Tissue | Expression Dynamics | Abbreviation |
| Esophagus |  | ESCC: Esophageal squamous cell carcinoma |
| HGIN: High-grade intraepithelial neoplasias | ||
| LGIN: Low-grade intraepithelial neoplasias | ||
| Oral Cavity | 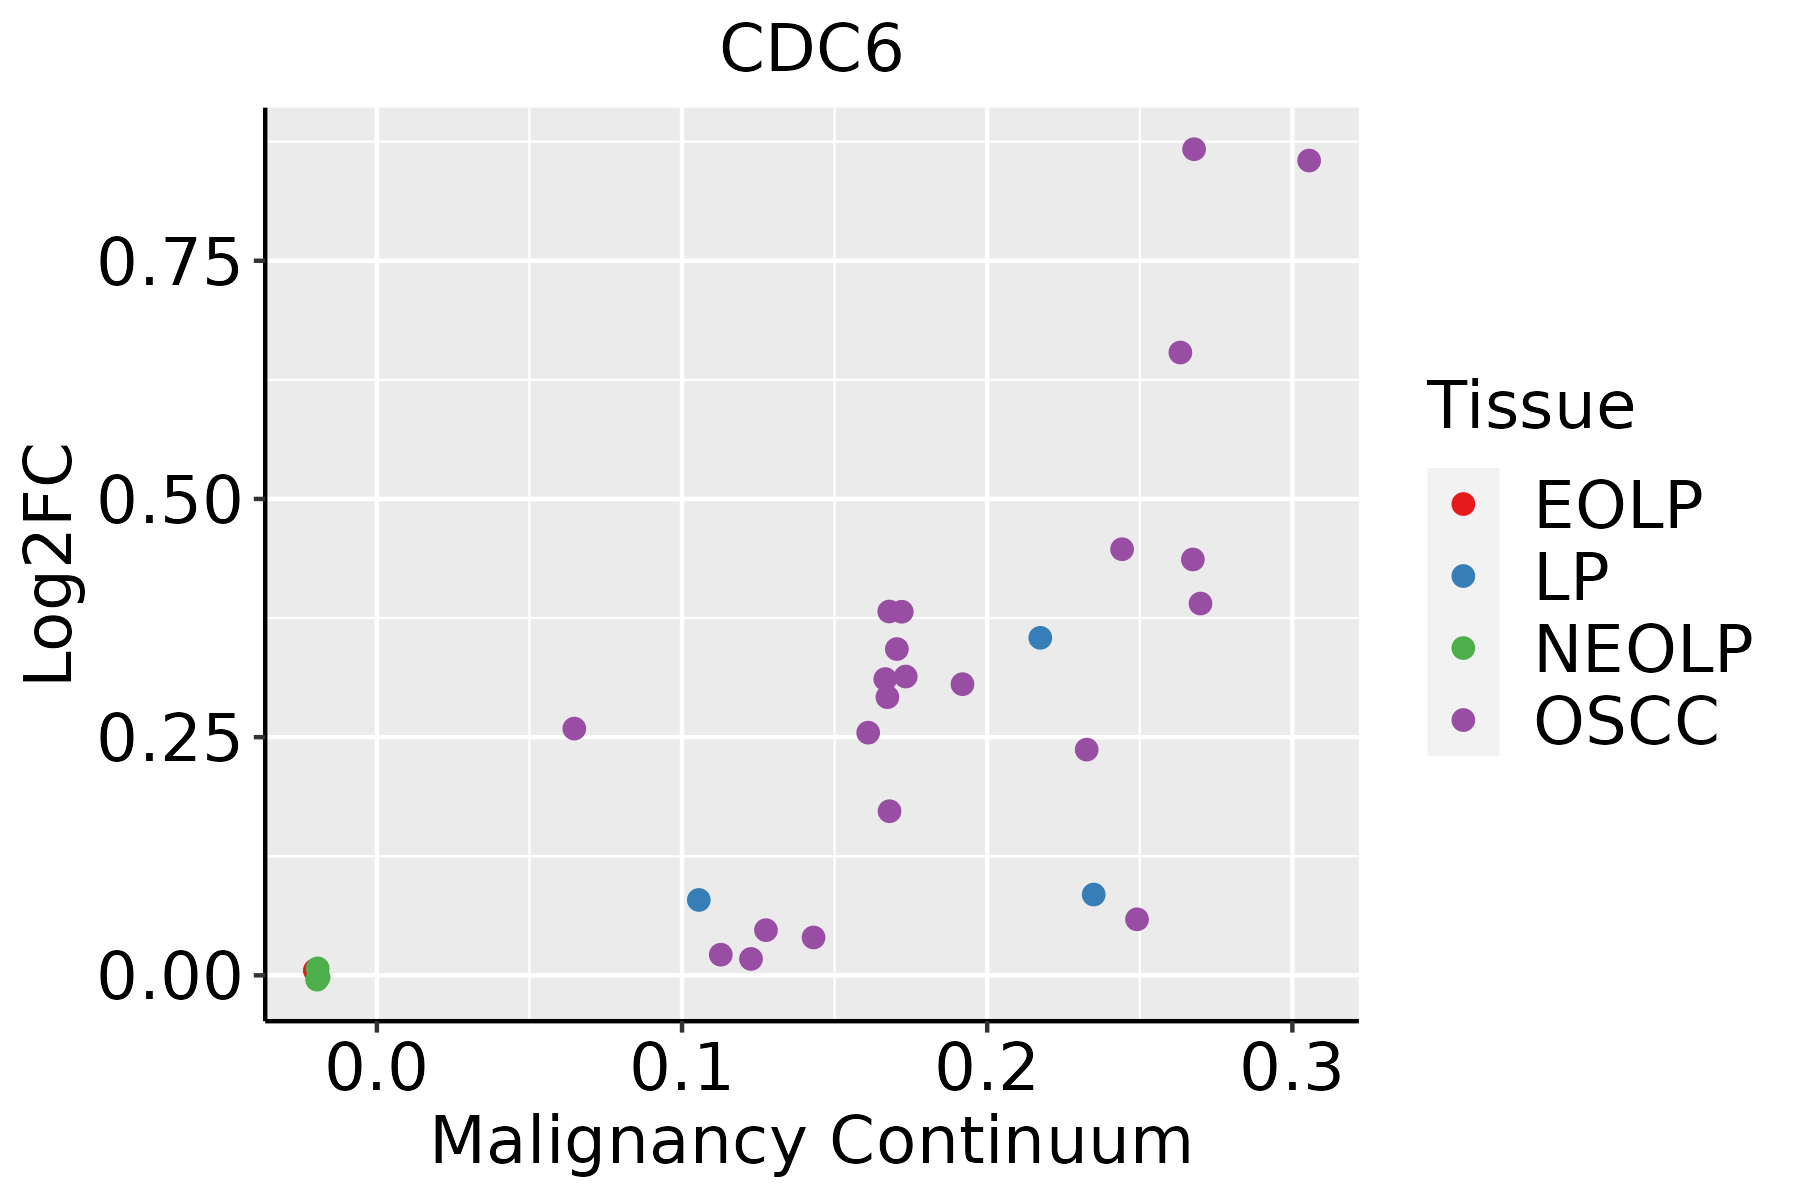 | EOLP: Erosive Oral lichen planus |
| LP: leukoplakia | ||
| NEOLP: Non-erosive oral lichen planus | ||
| OSCC: Oral squamous cell carcinoma |
| ∗log2FC in expression of this searched gene in stem-like cells from each diseased tissue sample relative to stem-like cells in normal samples in each tissue plotted against the malignancy continuum. Samples are colored based on if they are from different disease stage. |
Top |
Malignant transformation related pathway analysis |
| Find out the enriched GO biological processes and KEGG pathways involved in transition from healthy to precancer to cancer |
| Tissue | Disease Stage | Enriched GO biological Processes |
| Colorectum | AD |  |
| Colorectum | SER |  |
| Colorectum | MSS |  |
| Colorectum | MSI-H |  |
| Colorectum | FAP |  |
| ∗Top 15 enriched GO BP terms are showed in the bar plot of each disease state in each tissue. Each row represents a significant GO biological process which is colored according to the -log10(p.adjust). |
| Page: 1 2 3 4 5 6 7 8 9 |
| GO ID | Tissue | Disease Stage | Description | Gene Ratio | Bg Ratio | pvalue | p.adjust | Count |
| GO:014001414 | Esophagus | ESCC | mitotic nuclear division | 218/8552 | 287/18723 | 6.17e-26 | 1.78e-23 | 218 |
| GO:000007011 | Esophagus | ESCC | mitotic sister chromatid segregation | 138/8552 | 168/18723 | 1.37e-22 | 2.63e-20 | 138 |
| GO:00008194 | Esophagus | ESCC | sister chromatid segregation | 157/8552 | 202/18723 | 8.41e-21 | 1.33e-18 | 157 |
| GO:003304416 | Esophagus | ESCC | regulation of chromosome organization | 145/8552 | 187/18723 | 3.80e-19 | 4.31e-17 | 145 |
| GO:000705911 | Esophagus | ESCC | chromosome segregation | 238/8552 | 346/18723 | 1.72e-18 | 1.82e-16 | 238 |
| GO:004477216 | Esophagus | ESCC | mitotic cell cycle phase transition | 281/8552 | 424/18723 | 4.63e-18 | 4.45e-16 | 281 |
| GO:000734615 | Esophagus | ESCC | regulation of mitotic cell cycle | 293/8552 | 457/18723 | 8.00e-16 | 5.64e-14 | 293 |
| GO:00062604 | Esophagus | ESCC | DNA replication | 181/8552 | 260/18723 | 3.55e-15 | 2.05e-13 | 181 |
| GO:00482853 | Esophagus | ESCC | organelle fission | 301/8552 | 488/18723 | 4.64e-13 | 2.12e-11 | 301 |
| GO:00988133 | Esophagus | ESCC | nuclear chromosome segregation | 187/8552 | 281/18723 | 1.00e-12 | 4.36e-11 | 187 |
| GO:007190016 | Esophagus | ESCC | regulation of protein serine/threonine kinase activity | 227/8552 | 359/18723 | 1.12e-11 | 4.10e-10 | 227 |
| GO:00002802 | Esophagus | ESCC | nuclear division | 270/8552 | 439/18723 | 1.17e-11 | 4.24e-10 | 270 |
| GO:190198713 | Esophagus | ESCC | regulation of cell cycle phase transition | 242/8552 | 390/18723 | 3.86e-11 | 1.26e-09 | 242 |
| GO:190199013 | Esophagus | ESCC | regulation of mitotic cell cycle phase transition | 191/8552 | 299/18723 | 1.35e-10 | 3.94e-09 | 191 |
| GO:00457865 | Esophagus | ESCC | negative regulation of cell cycle | 236/8552 | 385/18723 | 3.62e-10 | 9.93e-09 | 236 |
| GO:00000754 | Esophagus | ESCC | cell cycle checkpoint | 117/8552 | 169/18723 | 4.47e-10 | 1.17e-08 | 117 |
| GO:004578710 | Esophagus | ESCC | positive regulation of cell cycle | 196/8552 | 313/18723 | 9.27e-10 | 2.24e-08 | 196 |
| GO:00448394 | Esophagus | ESCC | cell cycle G2/M phase transition | 103/8552 | 148/18723 | 3.09e-09 | 6.67e-08 | 103 |
| GO:00000864 | Esophagus | ESCC | G2/M transition of mitotic cell cycle | 96/8552 | 137/18723 | 6.00e-09 | 1.23e-07 | 96 |
| GO:000091016 | Esophagus | ESCC | cytokinesis | 115/8552 | 173/18723 | 2.48e-08 | 4.68e-07 | 115 |
| Page: 1 2 3 4 5 6 7 8 |
| Pathway ID | Tissue | Disease Stage | Description | Gene Ratio | Bg Ratio | pvalue | p.adjust | qvalue | Count |
| hsa0411023 | Esophagus | ESCC | Cell cycle | 126/4205 | 157/8465 | 1.34e-15 | 5.60e-14 | 2.87e-14 | 126 |
| hsa0411033 | Esophagus | ESCC | Cell cycle | 126/4205 | 157/8465 | 1.34e-15 | 5.60e-14 | 2.87e-14 | 126 |
| hsa041108 | Oral cavity | OSCC | Cell cycle | 118/3704 | 157/8465 | 7.15e-16 | 2.66e-14 | 1.35e-14 | 118 |
| hsa0411015 | Oral cavity | OSCC | Cell cycle | 118/3704 | 157/8465 | 7.15e-16 | 2.66e-14 | 1.35e-14 | 118 |
| Page: 1 |
Top |
Cell-cell communication analysis |
| Identification of potential cell-cell interactions between two cell types and their ligand-receptor pairs for different disease states |
| Ligand | Receptor | LRpair | Pathway | Tissue | Disease Stage |
| Page: 1 |
Top |
Single-cell gene regulatory network inference analysis |
| Find out the significant the regulons (TFs) and the target genes of each regulon across cell types for different disease states |
| TF | Cell Type | Tissue | Disease Stage | Target Gene | RSS | Regulon Activity |
| ∗The dot plots of a searched regulon are shown for all cell subpopulations in each disease state of each tissue based on the regulon specific score inferred using pySCENIC and by calculating the average expression. |
| Page: 1 |
Top |
Somatic mutation of malignant transformation related genes |
| Annotation of somatic variants for genes involved in malignant transformation |
| Hugo Symbol | Variant Class | Variant Classification | dbSNP RS | HGVSc | HGVSp | HGVSp Short | SWISSPROT | BIOTYPE | SIFT | PolyPhen | Tumor Sample Barcode | Tissue | Histology | Sex | Age | Stage | Therapy Types | Drugs | Outcome |
| CDC6 | SNV | Missense_Mutation | c.1324N>C | p.Asp442His | p.D442H | Q99741 | protein_coding | tolerated(0.19) | benign(0.231) | TCGA-A1-A0SN-01 | Breast | breast invasive carcinoma | Female | <65 | I/II | Chemotherapy | ac | SD | |
| CDC6 | SNV | Missense_Mutation | c.1639N>C | p.Asp547His | p.D547H | Q99741 | protein_coding | deleterious(0) | probably_damaging(0.96) | TCGA-A1-A0SN-01 | Breast | breast invasive carcinoma | Female | <65 | I/II | Chemotherapy | ac | SD | |
| CDC6 | insertion | Frame_Shift_Ins | novel | c.512_513insCCAA | p.Leu172GlnfsTer57 | p.L172Qfs*57 | Q99741 | protein_coding | TCGA-A8-A0A6-01 | Breast | breast invasive carcinoma | Female | <65 | III/IV | Chemotherapy | epirubicin | CR | ||
| CDC6 | insertion | Nonsense_Mutation | novel | c.514_515insCTGGCTAATT | p.Leu172ProfsTer3 | p.L172Pfs*3 | Q99741 | protein_coding | TCGA-A8-A0A6-01 | Breast | breast invasive carcinoma | Female | <65 | III/IV | Chemotherapy | epirubicin | CR | ||
| CDC6 | SNV | Missense_Mutation | novel | c.1576G>A | p.Glu526Lys | p.E526K | Q99741 | protein_coding | deleterious(0) | probably_damaging(0.985) | TCGA-C5-A902-01 | Cervix | cervical & endocervical cancer | Female | <65 | I/II | Chemotherapy | cisplatin | SD |
| CDC6 | SNV | Missense_Mutation | c.1566G>C | p.Lys522Asn | p.K522N | Q99741 | protein_coding | deleterious(0) | probably_damaging(0.997) | TCGA-EA-A50E-01 | Cervix | cervical & endocervical cancer | Female | <65 | I/II | Unknown | Unknown | PD | |
| CDC6 | SNV | Missense_Mutation | rs757198932 | c.511N>T | p.Arg171Trp | p.R171W | Q99741 | protein_coding | deleterious(0) | possibly_damaging(0.513) | TCGA-AA-3510-01 | Colorectum | colon adenocarcinoma | Male | >=65 | I/II | Unknown | Unknown | SD |
| CDC6 | SNV | Missense_Mutation | novel | c.386N>G | p.Glu129Gly | p.E129G | Q99741 | protein_coding | deleterious(0.05) | benign(0.003) | TCGA-CA-6717-01 | Colorectum | colon adenocarcinoma | Male | <65 | I/II | Chemotherapy | oxaliplatin | CR |
| CDC6 | SNV | Missense_Mutation | novel | c.1404N>T | p.Leu468Phe | p.L468F | Q99741 | protein_coding | deleterious(0.01) | probably_damaging(0.998) | TCGA-AG-A002-01 | Colorectum | rectum adenocarcinoma | Male | <65 | I/II | Unknown | Unknown | SD |
| CDC6 | SNV | Missense_Mutation | c.529N>T | p.Arg177Trp | p.R177W | Q99741 | protein_coding | deleterious(0) | benign(0.068) | TCGA-AH-6544-01 | Colorectum | rectum adenocarcinoma | Male | <65 | III/IV | Chemotherapy | oxaliplatin | SD |
| Page: 1 2 3 4 5 |
Top |
Related drugs of malignant transformation related genes |
| Identification of chemicals and drugs interact with genes involved in malignant transfromation |
| (DGIdb 4.0) |
| Entrez ID | Symbol | Category | Interaction Types | Drug Claim Name | Drug Name | PMIDs |
| Page: 1 |

Copyright 2023-Present -The University of Texas Health Science Center at Houston |