
|
|||||
|
 | |
| |
| |
| |
| |
| |
|
Gene: CDC5L |
Gene summary for CDC5L |
| Gene information | Species | Human | Gene symbol | CDC5L | Gene ID | 988 |
| Gene name | cell division cycle 5 like | |
| Gene Alias | CDC5 | |
| Cytomap | 6p21.1 | |
| Gene Type | protein-coding | GO ID | GO:0000075 | UniProtAcc | Q99459 |
Top |
Malignant transformation analysis |
| Identification of the aberrant gene expression in precancerous and cancerous lesions by comparing the gene expression of stem-like cells in diseased tissues with normal stem cells |
| Entrez ID | Symbol | Replicates | Species | Organ | Tissue | Adj P-value | Log2FC | Malignancy |
| 988 | CDC5L | LZE2T | Human | Esophagus | ESCC | 6.08e-07 | 1.67e+00 | 0.082 |
| 988 | CDC5L | LZE4T | Human | Esophagus | ESCC | 1.26e-11 | 2.58e-01 | 0.0811 |
| 988 | CDC5L | LZE7T | Human | Esophagus | ESCC | 1.06e-03 | 5.42e-01 | 0.0667 |
| 988 | CDC5L | LZE8T | Human | Esophagus | ESCC | 2.34e-06 | 1.91e-02 | 0.067 |
| 988 | CDC5L | LZE20T | Human | Esophagus | ESCC | 1.61e-02 | 1.52e-01 | 0.0662 |
| 988 | CDC5L | LZE24T | Human | Esophagus | ESCC | 1.39e-06 | 3.15e-01 | 0.0596 |
| 988 | CDC5L | LZE21T | Human | Esophagus | ESCC | 8.73e-05 | 1.09e-01 | 0.0655 |
| 988 | CDC5L | LZE6T | Human | Esophagus | ESCC | 1.16e-04 | 3.35e-01 | 0.0845 |
| 988 | CDC5L | P1T-E | Human | Esophagus | ESCC | 1.51e-10 | 6.88e-01 | 0.0875 |
| 988 | CDC5L | P2T-E | Human | Esophagus | ESCC | 7.70e-27 | 6.37e-01 | 0.1177 |
| 988 | CDC5L | P4T-E | Human | Esophagus | ESCC | 5.24e-28 | 9.95e-01 | 0.1323 |
| 988 | CDC5L | P5T-E | Human | Esophagus | ESCC | 2.68e-19 | 5.38e-01 | 0.1327 |
| 988 | CDC5L | P8T-E | Human | Esophagus | ESCC | 9.93e-30 | 4.46e-01 | 0.0889 |
| 988 | CDC5L | P9T-E | Human | Esophagus | ESCC | 1.56e-18 | 3.46e-01 | 0.1131 |
| 988 | CDC5L | P10T-E | Human | Esophagus | ESCC | 3.09e-24 | 5.52e-01 | 0.116 |
| 988 | CDC5L | P11T-E | Human | Esophagus | ESCC | 1.01e-12 | 7.26e-01 | 0.1426 |
| 988 | CDC5L | P12T-E | Human | Esophagus | ESCC | 3.30e-25 | 6.11e-01 | 0.1122 |
| 988 | CDC5L | P15T-E | Human | Esophagus | ESCC | 6.85e-11 | 3.00e-01 | 0.1149 |
| 988 | CDC5L | P16T-E | Human | Esophagus | ESCC | 7.20e-26 | 5.95e-01 | 0.1153 |
| 988 | CDC5L | P17T-E | Human | Esophagus | ESCC | 1.28e-11 | 5.67e-01 | 0.1278 |
| Page: 1 2 3 4 5 6 |
| Tissue | Expression Dynamics | Abbreviation |
| Esophagus | 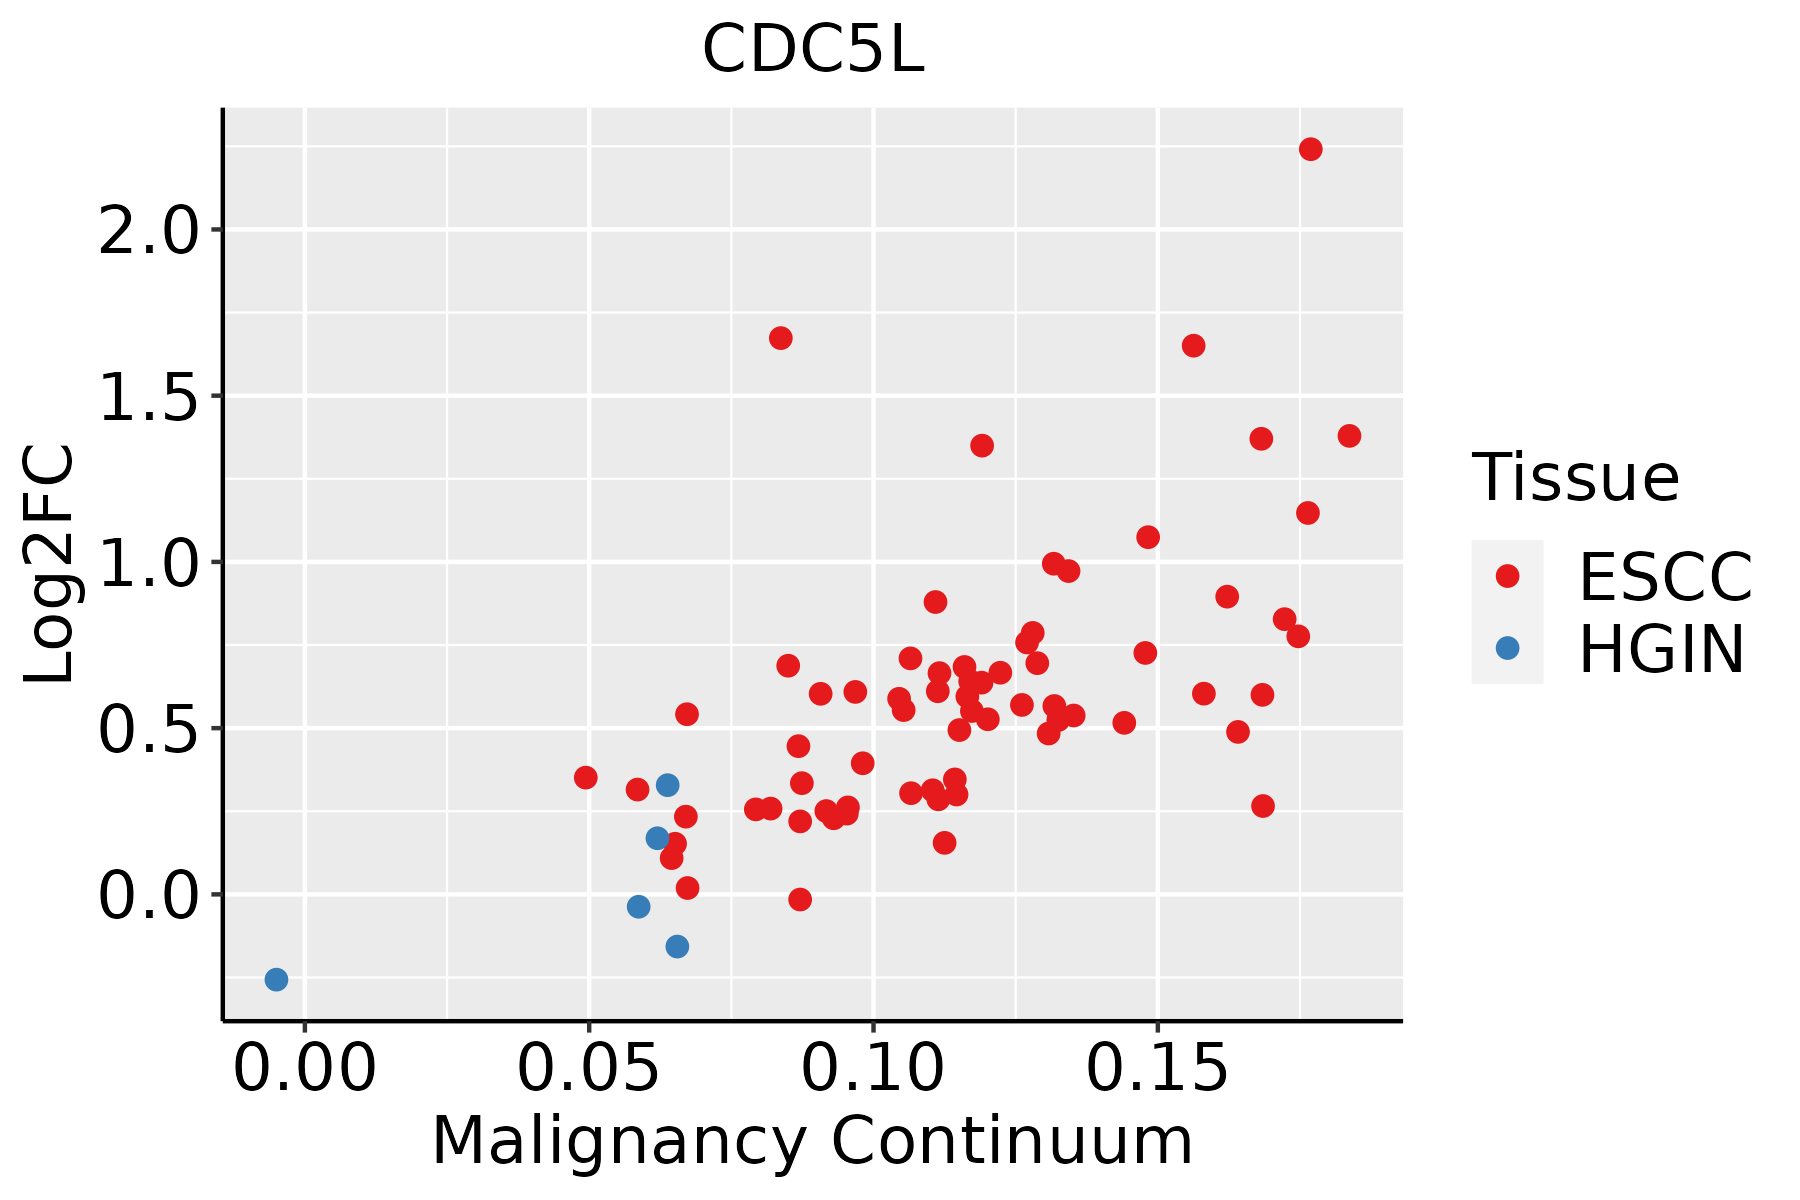 | ESCC: Esophageal squamous cell carcinoma |
| HGIN: High-grade intraepithelial neoplasias | ||
| LGIN: Low-grade intraepithelial neoplasias | ||
| Liver |  | HCC: Hepatocellular carcinoma |
| NAFLD: Non-alcoholic fatty liver disease | ||
| Oral Cavity |  | EOLP: Erosive Oral lichen planus |
| LP: leukoplakia | ||
| NEOLP: Non-erosive oral lichen planus | ||
| OSCC: Oral squamous cell carcinoma | ||
| Prostate |  | BPH: Benign Prostatic Hyperplasia |
| Skin | 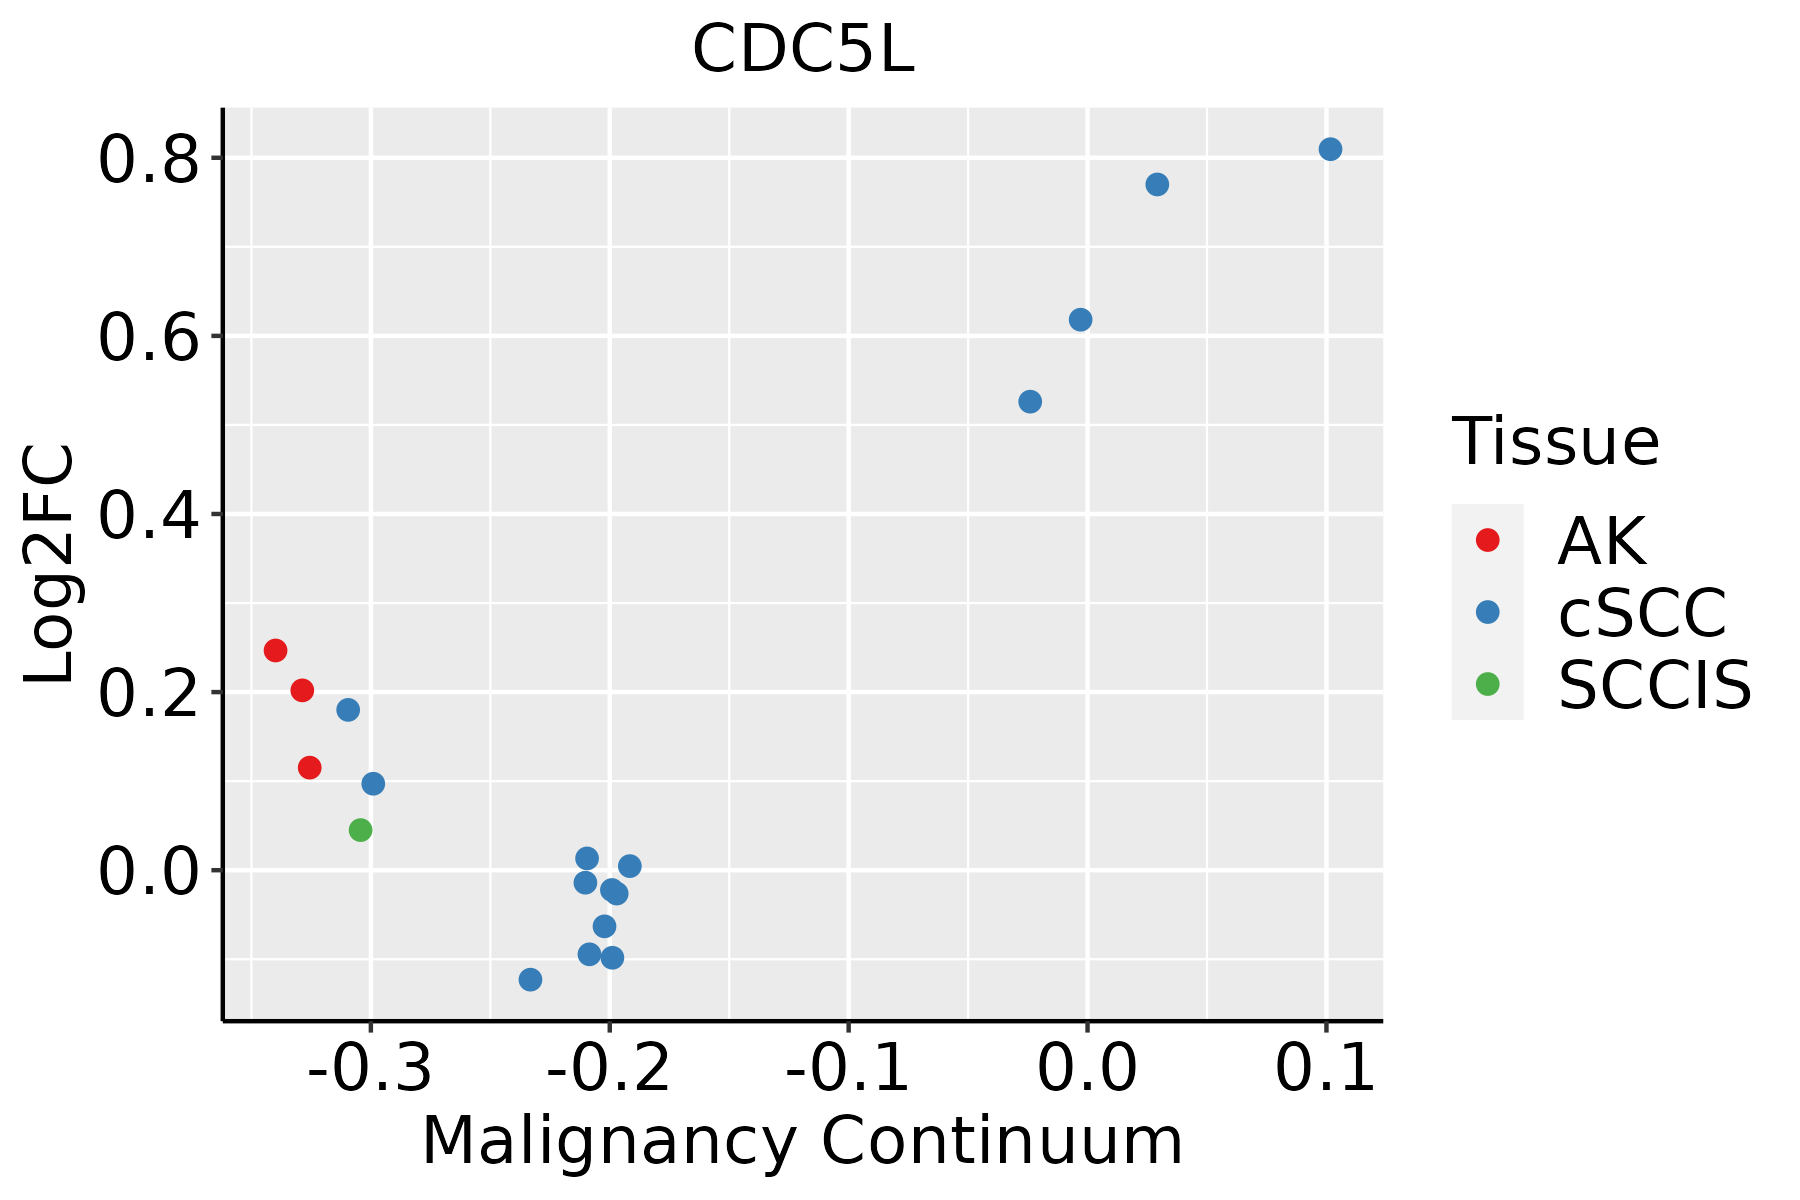 | AK: Actinic keratosis |
| cSCC: Cutaneous squamous cell carcinoma | ||
| SCCIS:squamous cell carcinoma in situ | ||
| Thyroid |  | ATC: Anaplastic thyroid cancer |
| HT: Hashimoto's thyroiditis | ||
| PTC: Papillary thyroid cancer |
| ∗log2FC in expression of this searched gene in stem-like cells from each diseased tissue sample relative to stem-like cells in normal samples in each tissue plotted against the malignancy continuum. Samples are colored based on if they are from different disease stage. |
Top |
Malignant transformation related pathway analysis |
| Find out the enriched GO biological processes and KEGG pathways involved in transition from healthy to precancer to cancer |
| Tissue | Disease Stage | Enriched GO biological Processes |
| Colorectum | AD |  |
| Colorectum | SER |  |
| Colorectum | MSS |  |
| Colorectum | MSI-H |  |
| Colorectum | FAP |  |
| ∗Top 15 enriched GO BP terms are showed in the bar plot of each disease state in each tissue. Each row represents a significant GO biological process which is colored according to the -log10(p.adjust). |
| Page: 1 2 3 4 5 6 7 8 9 |
| GO ID | Tissue | Disease Stage | Description | Gene Ratio | Bg Ratio | pvalue | p.adjust | Count |
| GO:0008380111 | Esophagus | ESCC | RNA splicing | 336/8552 | 434/18723 | 1.74e-42 | 3.67e-39 | 336 |
| GO:0000375111 | Esophagus | ESCC | RNA splicing, via transesterification reactions | 248/8552 | 324/18723 | 3.05e-30 | 1.49e-27 | 248 |
| GO:0000377111 | Esophagus | ESCC | RNA splicing, via transesterification reactions with bulged adenosine as nucleophile | 244/8552 | 320/18723 | 2.52e-29 | 1.07e-26 | 244 |
| GO:0000398111 | Esophagus | ESCC | mRNA splicing, via spliceosome | 244/8552 | 320/18723 | 2.52e-29 | 1.07e-26 | 244 |
| GO:190198713 | Esophagus | ESCC | regulation of cell cycle phase transition | 242/8552 | 390/18723 | 3.86e-11 | 1.26e-09 | 242 |
| GO:00457865 | Esophagus | ESCC | negative regulation of cell cycle | 236/8552 | 385/18723 | 3.62e-10 | 9.93e-09 | 236 |
| GO:00000754 | Esophagus | ESCC | cell cycle checkpoint | 117/8552 | 169/18723 | 4.47e-10 | 1.17e-08 | 117 |
| GO:004277014 | Esophagus | ESCC | signal transduction in response to DNA damage | 117/8552 | 172/18723 | 2.38e-09 | 5.32e-08 | 117 |
| GO:00109484 | Esophagus | ESCC | negative regulation of cell cycle process | 177/8552 | 294/18723 | 3.26e-07 | 4.59e-06 | 177 |
| GO:00315705 | Esophagus | ESCC | DNA integrity checkpoint | 83/8552 | 123/18723 | 8.17e-07 | 1.06e-05 | 83 |
| GO:00000775 | Esophagus | ESCC | DNA damage checkpoint | 78/8552 | 115/18723 | 1.27e-06 | 1.56e-05 | 78 |
| GO:19019883 | Esophagus | ESCC | negative regulation of cell cycle phase transition | 151/8552 | 249/18723 | 1.28e-06 | 1.57e-05 | 151 |
| GO:190165319 | Esophagus | ESCC | cellular response to peptide | 208/8552 | 359/18723 | 1.68e-06 | 2.01e-05 | 208 |
| GO:0043434111 | Esophagus | ESCC | response to peptide hormone | 234/8552 | 414/18723 | 4.93e-06 | 5.21e-05 | 234 |
| GO:1901654111 | Esophagus | ESCC | response to ketone | 118/8552 | 194/18723 | 1.45e-05 | 1.31e-04 | 118 |
| GO:007137516 | Esophagus | ESCC | cellular response to peptide hormone stimulus | 166/8552 | 290/18723 | 4.48e-05 | 3.55e-04 | 166 |
| GO:199009017 | Esophagus | ESCC | cellular response to nerve growth factor stimulus | 38/8552 | 53/18723 | 1.10e-04 | 7.69e-04 | 38 |
| GO:199008916 | Esophagus | ESCC | response to nerve growth factor | 39/8552 | 56/18723 | 2.44e-04 | 1.51e-03 | 39 |
| GO:19016556 | Esophagus | ESCC | cellular response to ketone | 59/8552 | 96/18723 | 1.32e-03 | 6.30e-03 | 59 |
| GO:00713755 | Liver | NAFLD | cellular response to peptide hormone stimulus | 65/1882 | 290/18723 | 3.95e-10 | 9.62e-08 | 65 |
| Page: 1 2 3 4 5 6 7 8 9 10 |
| Pathway ID | Tissue | Disease Stage | Description | Gene Ratio | Bg Ratio | pvalue | p.adjust | qvalue | Count |
| hsa0304027 | Esophagus | ESCC | Spliceosome | 128/4205 | 217/8465 | 3.31e-03 | 8.79e-03 | 4.50e-03 | 128 |
| hsa0304037 | Esophagus | ESCC | Spliceosome | 128/4205 | 217/8465 | 3.31e-03 | 8.79e-03 | 4.50e-03 | 128 |
| hsa030407 | Liver | Cirrhotic | Spliceosome | 102/2530 | 217/8465 | 5.69e-08 | 9.47e-07 | 5.84e-07 | 102 |
| hsa0304012 | Liver | Cirrhotic | Spliceosome | 102/2530 | 217/8465 | 5.69e-08 | 9.47e-07 | 5.84e-07 | 102 |
| hsa0304022 | Liver | HCC | Spliceosome | 122/4020 | 217/8465 | 5.55e-03 | 1.60e-02 | 8.91e-03 | 122 |
| hsa0304032 | Liver | HCC | Spliceosome | 122/4020 | 217/8465 | 5.55e-03 | 1.60e-02 | 8.91e-03 | 122 |
| hsa0304016 | Oral cavity | OSCC | Spliceosome | 123/3704 | 217/8465 | 7.21e-05 | 2.74e-04 | 1.40e-04 | 123 |
| hsa0304017 | Oral cavity | OSCC | Spliceosome | 123/3704 | 217/8465 | 7.21e-05 | 2.74e-04 | 1.40e-04 | 123 |
| hsa0304010 | Prostate | BPH | Spliceosome | 62/1718 | 217/8465 | 1.99e-03 | 7.92e-03 | 4.90e-03 | 62 |
| hsa0304015 | Prostate | BPH | Spliceosome | 62/1718 | 217/8465 | 1.99e-03 | 7.92e-03 | 4.90e-03 | 62 |
| hsa0304025 | Prostate | Tumor | Spliceosome | 66/1791 | 217/8465 | 7.53e-04 | 3.59e-03 | 2.23e-03 | 66 |
| hsa0304035 | Prostate | Tumor | Spliceosome | 66/1791 | 217/8465 | 7.53e-04 | 3.59e-03 | 2.23e-03 | 66 |
| Page: 1 |
Top |
Cell-cell communication analysis |
| Identification of potential cell-cell interactions between two cell types and their ligand-receptor pairs for different disease states |
| Ligand | Receptor | LRpair | Pathway | Tissue | Disease Stage |
| Page: 1 |
Top |
Single-cell gene regulatory network inference analysis |
| Find out the significant the regulons (TFs) and the target genes of each regulon across cell types for different disease states |
| TF | Cell Type | Tissue | Disease Stage | Target Gene | RSS | Regulon Activity |
| CDC5L | ILC | Colorectum | AD | GPNMB,PRCP,LIPA, etc. | 6.07e-03 |  |
| CDC5L | TFH | Colorectum | AD | GPNMB,PRCP,LIPA, etc. | 0.00e+00 | |
| CDC5L | CD4TN | Colorectum | AD | GPNMB,PRCP,LIPA, etc. | 0.00e+00 | |
| CDC5L | BN | Colorectum | AD | GPNMB,PRCP,LIPA, etc. | 0.00e+00 | |
| CDC5L | CD4TN | Colorectum | CRC | GPNMB,PRCP,LIPA, etc. | 3.35e-02 |  |
| CDC5L | BN | Colorectum | Healthy | GPNMB,PRCP,LIPA, etc. | 1.88e-02 |  |
| CDC5L | CD4TN | Colorectum | Healthy | GPNMB,PRCP,LIPA, etc. | 2.19e-02 | |
| CDC5L | TFH | Colorectum | MSI-H | GPNMB,PRCP,LIPA, etc. | 0.00e+00 |  |
| CDC5L | TH1 | Colorectum | MSI-H | GPNMB,PRCP,LIPA, etc. | 0.00e+00 | |
| CDC5L | CD4TN | Colorectum | MSI-H | GPNMB,PRCP,LIPA, etc. | 0.00e+00 | |
| ∗The dot plots of a searched regulon are shown for all cell subpopulations in each disease state of each tissue based on the regulon specific score inferred using pySCENIC and by calculating the average expression. |
| Page: 1 2 |
Top |
Somatic mutation of malignant transformation related genes |
| Annotation of somatic variants for genes involved in malignant transformation |
| Hugo Symbol | Variant Class | Variant Classification | dbSNP RS | HGVSc | HGVSp | HGVSp Short | SWISSPROT | BIOTYPE | SIFT | PolyPhen | Tumor Sample Barcode | Tissue | Histology | Sex | Age | Stage | Therapy Types | Drugs | Outcome |
| CDC5L | SNV | Missense_Mutation | novel | c.2072N>T | p.Ser691Leu | p.S691L | Q99459 | protein_coding | deleterious(0) | possibly_damaging(0.577) | TCGA-5L-AAT0-01 | Breast | breast invasive carcinoma | Female | <65 | I/II | Hormone Therapy | tamoxiphen | SD |
| CDC5L | SNV | Missense_Mutation | c.703N>G | p.Leu235Val | p.L235V | Q99459 | protein_coding | tolerated(0.55) | benign(0.115) | TCGA-A2-A0CR-01 | Breast | breast invasive carcinoma | Female | <65 | I/II | Chemotherapy | adriamycin | CR | |
| CDC5L | SNV | Missense_Mutation | c.703C>G | p.Leu235Val | p.L235V | Q99459 | protein_coding | tolerated(0.55) | benign(0.115) | TCGA-AC-A23H-01 | Breast | breast invasive carcinoma | Female | >=65 | I/II | Unknown | Unknown | PD | |
| CDC5L | SNV | Missense_Mutation | rs202064406 | c.2249G>A | p.Arg750His | p.R750H | Q99459 | protein_coding | tolerated(0.12) | benign(0) | TCGA-BH-A0C7-01 | Breast | breast invasive carcinoma | Female | <65 | I/II | Chemotherapy | adriamycin | CR |
| CDC5L | SNV | Missense_Mutation | c.72G>A | p.Met24Ile | p.M24I | Q99459 | protein_coding | deleterious(0) | probably_damaging(1) | TCGA-E2-A159-01 | Breast | breast invasive carcinoma | Female | <65 | I/II | Chemotherapy | cyclophosphamide | SD | |
| CDC5L | SNV | Missense_Mutation | rs202064406 | c.2249N>A | p.Arg750His | p.R750H | Q99459 | protein_coding | tolerated(0.12) | benign(0) | TCGA-EA-A3HS-01 | Cervix | cervical & endocervical cancer | Female | <65 | I/II | Unknown | Unknown | SD |
| CDC5L | SNV | Missense_Mutation | novel | c.43N>C | p.Glu15Gln | p.E15Q | Q99459 | protein_coding | deleterious(0) | probably_damaging(1) | TCGA-HM-A4S6-01 | Cervix | cervical & endocervical cancer | Female | <65 | III/IV | Chemotherapy | cisplatin | CR |
| CDC5L | SNV | Missense_Mutation | rs141102915 | c.1369N>A | p.Ala457Thr | p.A457T | Q99459 | protein_coding | tolerated(0.61) | benign(0.015) | TCGA-MA-AA42-01 | Cervix | cervical & endocervical cancer | Female | >=65 | I/II | Unknown | Unknown | SD |
| CDC5L | SNV | Missense_Mutation | novel | c.395N>T | p.Pro132Leu | p.P132L | Q99459 | protein_coding | deleterious(0) | possibly_damaging(0.882) | TCGA-VS-A8EI-01 | Cervix | cervical & endocervical cancer | Female | <65 | I/II | Chemotherapy | cisplatin | CR |
| CDC5L | deletion | Frame_Shift_Del | novel | c.336delT | p.Asn112LysfsTer17 | p.N112Kfs*17 | Q99459 | protein_coding | TCGA-BI-A20A-01 | Cervix | cervical & endocervical cancer | Female | <65 | I/II | Unknown | Unknown | SD |
| Page: 1 2 3 4 5 6 7 8 9 10 11 |
Top |
Related drugs of malignant transformation related genes |
| Identification of chemicals and drugs interact with genes involved in malignant transfromation |
| (DGIdb 4.0) |
| Entrez ID | Symbol | Category | Interaction Types | Drug Claim Name | Drug Name | PMIDs |
| 988 | CDC5L | DNA REPAIR | gemcitabine | GEMCITABINE | 22838950 |
| Page: 1 |

Copyright 2023-Present -The University of Texas Health Science Center at Houston |