
|
|||||
|
 | |
| |
| |
| |
| |
| |
|
Gene: CDC45 |
Gene summary for CDC45 |
| Gene information | Species | Human | Gene symbol | CDC45 | Gene ID | 8318 |
| Gene name | cell division cycle 45 | |
| Gene Alias | CDC45L | |
| Cytomap | 22q11.21 | |
| Gene Type | protein-coding | GO ID | GO:0000075 | UniProtAcc | O75419 |
Top |
Malignant transformation analysis |
| Identification of the aberrant gene expression in precancerous and cancerous lesions by comparing the gene expression of stem-like cells in diseased tissues with normal stem cells |
| Entrez ID | Symbol | Replicates | Species | Organ | Tissue | Adj P-value | Log2FC | Malignancy |
| 8318 | CDC45 | LZE7T | Human | Esophagus | ESCC | 1.02e-03 | 2.84e-01 | 0.0667 |
| 8318 | CDC45 | LZE21T | Human | Esophagus | ESCC | 8.02e-04 | 2.06e-01 | 0.0655 |
| 8318 | CDC45 | P1T-E | Human | Esophagus | ESCC | 2.97e-02 | 2.04e-01 | 0.0875 |
| 8318 | CDC45 | P2T-E | Human | Esophagus | ESCC | 7.98e-13 | 3.67e-01 | 0.1177 |
| 8318 | CDC45 | P4T-E | Human | Esophagus | ESCC | 2.81e-07 | 2.54e-01 | 0.1323 |
| 8318 | CDC45 | P5T-E | Human | Esophagus | ESCC | 4.24e-18 | 3.84e-01 | 0.1327 |
| 8318 | CDC45 | P10T-E | Human | Esophagus | ESCC | 2.05e-07 | 3.14e-01 | 0.116 |
| 8318 | CDC45 | P16T-E | Human | Esophagus | ESCC | 2.03e-09 | 2.56e-01 | 0.1153 |
| 8318 | CDC45 | P21T-E | Human | Esophagus | ESCC | 7.31e-14 | 4.72e-01 | 0.1617 |
| 8318 | CDC45 | P22T-E | Human | Esophagus | ESCC | 1.66e-02 | 1.24e-01 | 0.1236 |
| 8318 | CDC45 | P24T-E | Human | Esophagus | ESCC | 4.30e-10 | 2.85e-01 | 0.1287 |
| 8318 | CDC45 | P26T-E | Human | Esophagus | ESCC | 1.88e-04 | 2.16e-01 | 0.1276 |
| 8318 | CDC45 | P28T-E | Human | Esophagus | ESCC | 9.56e-08 | 1.79e-01 | 0.1149 |
| 8318 | CDC45 | P30T-E | Human | Esophagus | ESCC | 4.44e-04 | 4.38e-01 | 0.137 |
| 8318 | CDC45 | P31T-E | Human | Esophagus | ESCC | 3.89e-12 | 3.59e-01 | 0.1251 |
| 8318 | CDC45 | P32T-E | Human | Esophagus | ESCC | 1.30e-15 | 4.43e-01 | 0.1666 |
| 8318 | CDC45 | P37T-E | Human | Esophagus | ESCC | 3.40e-10 | 2.98e-01 | 0.1371 |
| 8318 | CDC45 | P48T-E | Human | Esophagus | ESCC | 3.75e-03 | 1.32e-01 | 0.0959 |
| 8318 | CDC45 | P52T-E | Human | Esophagus | ESCC | 1.13e-16 | 4.12e-01 | 0.1555 |
| 8318 | CDC45 | P65T-E | Human | Esophagus | ESCC | 3.99e-04 | 1.50e-01 | 0.0978 |
| Page: 1 2 3 |
| Tissue | Expression Dynamics | Abbreviation |
| Esophagus |  | ESCC: Esophageal squamous cell carcinoma |
| HGIN: High-grade intraepithelial neoplasias | ||
| LGIN: Low-grade intraepithelial neoplasias | ||
| Oral Cavity | 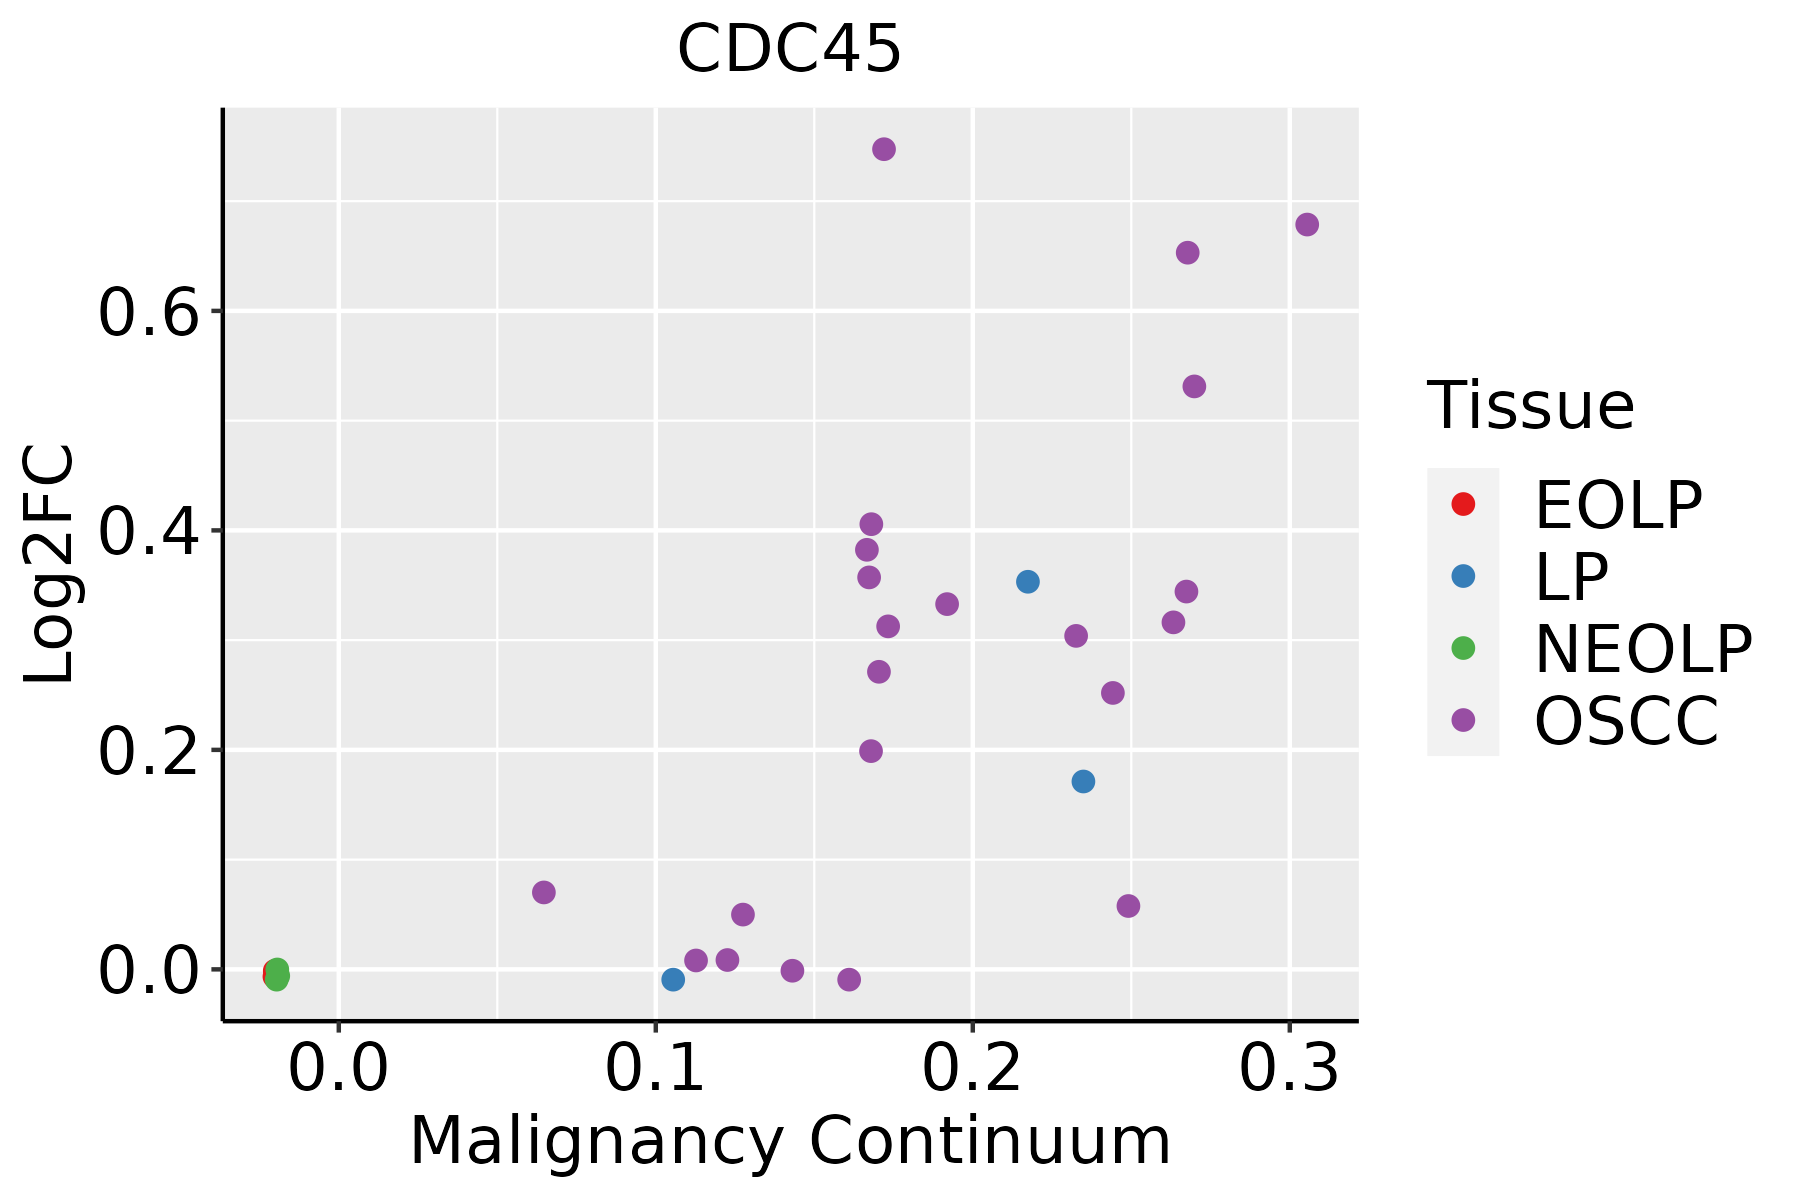 | EOLP: Erosive Oral lichen planus |
| LP: leukoplakia | ||
| NEOLP: Non-erosive oral lichen planus | ||
| OSCC: Oral squamous cell carcinoma |
| ∗log2FC in expression of this searched gene in stem-like cells from each diseased tissue sample relative to stem-like cells in normal samples in each tissue plotted against the malignancy continuum. Samples are colored based on if they are from different disease stage. |
Top |
Malignant transformation related pathway analysis |
| Find out the enriched GO biological processes and KEGG pathways involved in transition from healthy to precancer to cancer |
| Tissue | Disease Stage | Enriched GO biological Processes |
| Colorectum | AD |  |
| Colorectum | SER |  |
| Colorectum | MSS |  |
| Colorectum | MSI-H |  |
| Colorectum | FAP |  |
| ∗Top 15 enriched GO BP terms are showed in the bar plot of each disease state in each tissue. Each row represents a significant GO biological process which is colored according to the -log10(p.adjust). |
| Page: 1 2 3 4 5 6 7 8 9 |
| GO ID | Tissue | Disease Stage | Description | Gene Ratio | Bg Ratio | pvalue | p.adjust | Count |
| GO:00062604 | Esophagus | ESCC | DNA replication | 181/8552 | 260/18723 | 3.55e-15 | 2.05e-13 | 181 |
| GO:190198713 | Esophagus | ESCC | regulation of cell cycle phase transition | 242/8552 | 390/18723 | 3.86e-11 | 1.26e-09 | 242 |
| GO:00457865 | Esophagus | ESCC | negative regulation of cell cycle | 236/8552 | 385/18723 | 3.62e-10 | 9.93e-09 | 236 |
| GO:00000754 | Esophagus | ESCC | cell cycle checkpoint | 117/8552 | 169/18723 | 4.47e-10 | 1.17e-08 | 117 |
| GO:00062612 | Esophagus | ESCC | DNA-dependent DNA replication | 100/8552 | 151/18723 | 2.61e-07 | 3.94e-06 | 100 |
| GO:00109484 | Esophagus | ESCC | negative regulation of cell cycle process | 177/8552 | 294/18723 | 3.26e-07 | 4.59e-06 | 177 |
| GO:00315705 | Esophagus | ESCC | DNA integrity checkpoint | 83/8552 | 123/18723 | 8.17e-07 | 1.06e-05 | 83 |
| GO:19019883 | Esophagus | ESCC | negative regulation of cell cycle phase transition | 151/8552 | 249/18723 | 1.28e-06 | 1.57e-05 | 151 |
| GO:00063024 | Esophagus | ESCC | double-strand break repair | 152/8552 | 251/18723 | 1.33e-06 | 1.62e-05 | 152 |
| GO:00062701 | Esophagus | ESCC | DNA replication initiation | 27/8552 | 34/18723 | 6.01e-05 | 4.62e-04 | 27 |
| GO:00063101 | Esophagus | ESCC | DNA recombination | 168/8552 | 305/18723 | 5.58e-04 | 3.05e-03 | 168 |
| GO:00007241 | Esophagus | ESCC | double-strand break repair via homologous recombination | 79/8552 | 138/18723 | 4.05e-03 | 1.62e-02 | 79 |
| GO:00007251 | Esophagus | ESCC | recombinational repair | 80/8552 | 140/18723 | 4.10e-03 | 1.63e-02 | 80 |
| GO:1902969 | Esophagus | ESCC | mitotic DNA replication | 11/8552 | 14/18723 | 1.30e-02 | 4.27e-02 | 11 |
| GO:00062603 | Oral cavity | OSCC | DNA replication | 159/7305 | 260/18723 | 3.25e-13 | 1.59e-11 | 159 |
| GO:19019875 | Oral cavity | OSCC | regulation of cell cycle phase transition | 209/7305 | 390/18723 | 2.79e-09 | 6.42e-08 | 209 |
| GO:00457864 | Oral cavity | OSCC | negative regulation of cell cycle | 206/7305 | 385/18723 | 4.28e-09 | 9.55e-08 | 206 |
| GO:00000753 | Oral cavity | OSCC | cell cycle checkpoint | 101/7305 | 169/18723 | 3.53e-08 | 6.68e-07 | 101 |
| GO:19019882 | Oral cavity | OSCC | negative regulation of cell cycle phase transition | 136/7305 | 249/18723 | 3.81e-07 | 5.70e-06 | 136 |
| GO:00109483 | Oral cavity | OSCC | negative regulation of cell cycle process | 155/7305 | 294/18723 | 1.11e-06 | 1.48e-05 | 155 |
| Page: 1 2 |
| Pathway ID | Tissue | Disease Stage | Description | Gene Ratio | Bg Ratio | pvalue | p.adjust | qvalue | Count |
| hsa0411023 | Esophagus | ESCC | Cell cycle | 126/4205 | 157/8465 | 1.34e-15 | 5.60e-14 | 2.87e-14 | 126 |
| hsa0411033 | Esophagus | ESCC | Cell cycle | 126/4205 | 157/8465 | 1.34e-15 | 5.60e-14 | 2.87e-14 | 126 |
| hsa041108 | Oral cavity | OSCC | Cell cycle | 118/3704 | 157/8465 | 7.15e-16 | 2.66e-14 | 1.35e-14 | 118 |
| hsa0411015 | Oral cavity | OSCC | Cell cycle | 118/3704 | 157/8465 | 7.15e-16 | 2.66e-14 | 1.35e-14 | 118 |
| Page: 1 |
Top |
Cell-cell communication analysis |
| Identification of potential cell-cell interactions between two cell types and their ligand-receptor pairs for different disease states |
| Ligand | Receptor | LRpair | Pathway | Tissue | Disease Stage |
| Page: 1 |
Top |
Single-cell gene regulatory network inference analysis |
| Find out the significant the regulons (TFs) and the target genes of each regulon across cell types for different disease states |
| TF | Cell Type | Tissue | Disease Stage | Target Gene | RSS | Regulon Activity |
| ∗The dot plots of a searched regulon are shown for all cell subpopulations in each disease state of each tissue based on the regulon specific score inferred using pySCENIC and by calculating the average expression. |
| Page: 1 |
Top |
Somatic mutation of malignant transformation related genes |
| Annotation of somatic variants for genes involved in malignant transformation |
| Hugo Symbol | Variant Class | Variant Classification | dbSNP RS | HGVSc | HGVSp | HGVSp Short | SWISSPROT | BIOTYPE | SIFT | PolyPhen | Tumor Sample Barcode | Tissue | Histology | Sex | Age | Stage | Therapy Types | Drugs | Outcome |
| CDC45 | SNV | Missense_Mutation | novel | c.434N>A | p.Gly145Glu | p.G145E | O75419 | protein_coding | tolerated(0.25) | benign(0.04) | TCGA-A2-A0EP-01 | Breast | breast invasive carcinoma | Female | <65 | I/II | Chemotherapy | cyclophosphamide | CR |
| CDC45 | SNV | Missense_Mutation | c.1723G>A | p.Asp575Asn | p.D575N | O75419 | protein_coding | tolerated(0.06) | possibly_damaging(0.641) | TCGA-BH-A0H7-01 | Breast | breast invasive carcinoma | Female | >=65 | III/IV | Chemotherapy | doxorubicin | SD | |
| CDC45 | SNV | Missense_Mutation | c.1777N>T | p.Leu593Phe | p.L593F | O75419 | protein_coding | deleterious(0) | probably_damaging(1) | TCGA-D8-A142-01 | Breast | breast invasive carcinoma | Female | >=65 | I/II | Chemotherapy | cyclophosphamid | SD | |
| CDC45 | SNV | Missense_Mutation | novel | c.1016N>A | p.Gly339Glu | p.G339E | O75419 | protein_coding | deleterious(0) | probably_damaging(0.985) | TCGA-PE-A5DE-01 | Breast | breast invasive carcinoma | Female | <65 | I/II | Chemotherapy | taxotere | CR |
| CDC45 | insertion | Frame_Shift_Ins | novel | c.614_615insGCATTTGCTCCACCTTTTGTTCTCTTTGT | p.Asp205GlufsTer39 | p.D205Efs*39 | O75419 | protein_coding | TCGA-A2-A0CQ-01 | Breast | breast invasive carcinoma | Female | <65 | I/II | Chemotherapy | adriamycin | SD | ||
| CDC45 | insertion | In_Frame_Ins | novel | c.739_740insGGCATC | p.Asp247delinsGlyHisHis | p.D247delinsGHH | O75419 | protein_coding | TCGA-AN-A03X-01 | Breast | breast invasive carcinoma | Female | >=65 | I/II | Unknown | Unknown | SD | ||
| CDC45 | insertion | Nonsense_Mutation | novel | c.741_742insTGAGGAACACAGGGAG | p.Met248Ter | p.M248* | O75419 | protein_coding | TCGA-AN-A03X-01 | Breast | breast invasive carcinoma | Female | >=65 | I/II | Unknown | Unknown | SD | ||
| CDC45 | deletion | Frame_Shift_Del | novel | c.897delC | p.Cys299Ter | p.C299* | O75419 | protein_coding | TCGA-D8-A27V-01 | Breast | breast invasive carcinoma | Female | <65 | I/II | Hormone Therapy | tamoxiphen | SD | ||
| CDC45 | SNV | Missense_Mutation | novel | c.1132N>C | p.Glu378Gln | p.E378Q | O75419 | protein_coding | tolerated(0.07) | probably_damaging(0.913) | TCGA-C5-A2LZ-01 | Cervix | cervical & endocervical cancer | Female | >=65 | III/IV | Unknown | Unknown | PD |
| CDC45 | SNV | Missense_Mutation | c.326N>C | p.Val109Ala | p.V109A | O75419 | protein_coding | deleterious(0.02) | benign(0.009) | TCGA-EK-A2PI-01 | Cervix | cervical & endocervical cancer | Female | <65 | III/IV | Unknown | Unknown | SD |
| Page: 1 2 3 4 5 6 7 |
Top |
Related drugs of malignant transformation related genes |
| Identification of chemicals and drugs interact with genes involved in malignant transfromation |
| (DGIdb 4.0) |
| Entrez ID | Symbol | Category | Interaction Types | Drug Claim Name | Drug Name | PMIDs |
| Page: 1 |

Copyright 2023-Present -The University of Texas Health Science Center at Houston |