
|
|||||
|
 | |
| |
| |
| |
| |
| |
|
Gene: CDC42SE1 |
Gene summary for CDC42SE1 |
| Gene information | Species | Human | Gene symbol | CDC42SE1 | Gene ID | 56882 |
| Gene name | CDC42 small effector 1 | |
| Gene Alias | SCIP1 | |
| Cytomap | 1q21.3 | |
| Gene Type | protein-coding | GO ID | GO:0000902 | UniProtAcc | Q9NRR8 |
Top |
Malignant transformation analysis |
| Identification of the aberrant gene expression in precancerous and cancerous lesions by comparing the gene expression of stem-like cells in diseased tissues with normal stem cells |
| Entrez ID | Symbol | Replicates | Species | Organ | Tissue | Adj P-value | Log2FC | Malignancy |
| 56882 | CDC42SE1 | GSM4909293 | Human | Breast | IDC | 1.29e-07 | 2.81e-01 | 0.1581 |
| 56882 | CDC42SE1 | GSM4909296 | Human | Breast | IDC | 2.10e-02 | -1.59e-01 | 0.1524 |
| 56882 | CDC42SE1 | GSM4909297 | Human | Breast | IDC | 1.63e-21 | 5.44e-01 | 0.1517 |
| 56882 | CDC42SE1 | GSM4909298 | Human | Breast | IDC | 2.49e-03 | 2.49e-01 | 0.1551 |
| 56882 | CDC42SE1 | GSM4909301 | Human | Breast | IDC | 1.40e-03 | -1.75e-01 | 0.1577 |
| 56882 | CDC42SE1 | GSM4909311 | Human | Breast | IDC | 3.53e-16 | -1.92e-01 | 0.1534 |
| 56882 | CDC42SE1 | GSM4909312 | Human | Breast | IDC | 1.41e-03 | 1.29e-03 | 0.1552 |
| 56882 | CDC42SE1 | GSM4909313 | Human | Breast | IDC | 1.22e-03 | 3.47e-01 | 0.0391 |
| 56882 | CDC42SE1 | GSM4909319 | Human | Breast | IDC | 1.66e-15 | -3.07e-01 | 0.1563 |
| 56882 | CDC42SE1 | GSM4909320 | Human | Breast | IDC | 1.57e-03 | -1.87e-01 | 0.1575 |
| 56882 | CDC42SE1 | GSM4909321 | Human | Breast | IDC | 3.91e-03 | -1.94e-03 | 0.1559 |
| 56882 | CDC42SE1 | M2 | Human | Breast | IDC | 3.21e-03 | 5.42e-01 | 0.21 |
| 56882 | CDC42SE1 | NCCBC14 | Human | Breast | DCIS | 4.30e-03 | 7.24e-02 | 0.2021 |
| 56882 | CDC42SE1 | NCCBC5 | Human | Breast | DCIS | 2.89e-02 | -2.26e-02 | 0.2046 |
| 56882 | CDC42SE1 | P1 | Human | Breast | IDC | 5.82e-08 | -1.11e-01 | 0.1527 |
| 56882 | CDC42SE1 | DCIS2 | Human | Breast | DCIS | 1.02e-56 | 1.44e-01 | 0.0085 |
| 56882 | CDC42SE1 | LZE2T | Human | Esophagus | ESCC | 2.31e-12 | 1.48e+00 | 0.082 |
| 56882 | CDC42SE1 | LZE4T | Human | Esophagus | ESCC | 2.18e-24 | 7.73e-01 | 0.0811 |
| 56882 | CDC42SE1 | LZE7T | Human | Esophagus | ESCC | 2.76e-13 | 7.61e-01 | 0.0667 |
| 56882 | CDC42SE1 | LZE8T | Human | Esophagus | ESCC | 3.25e-08 | 3.85e-01 | 0.067 |
| Page: 1 2 3 4 5 6 7 |
| Tissue | Expression Dynamics | Abbreviation |
| Breast | 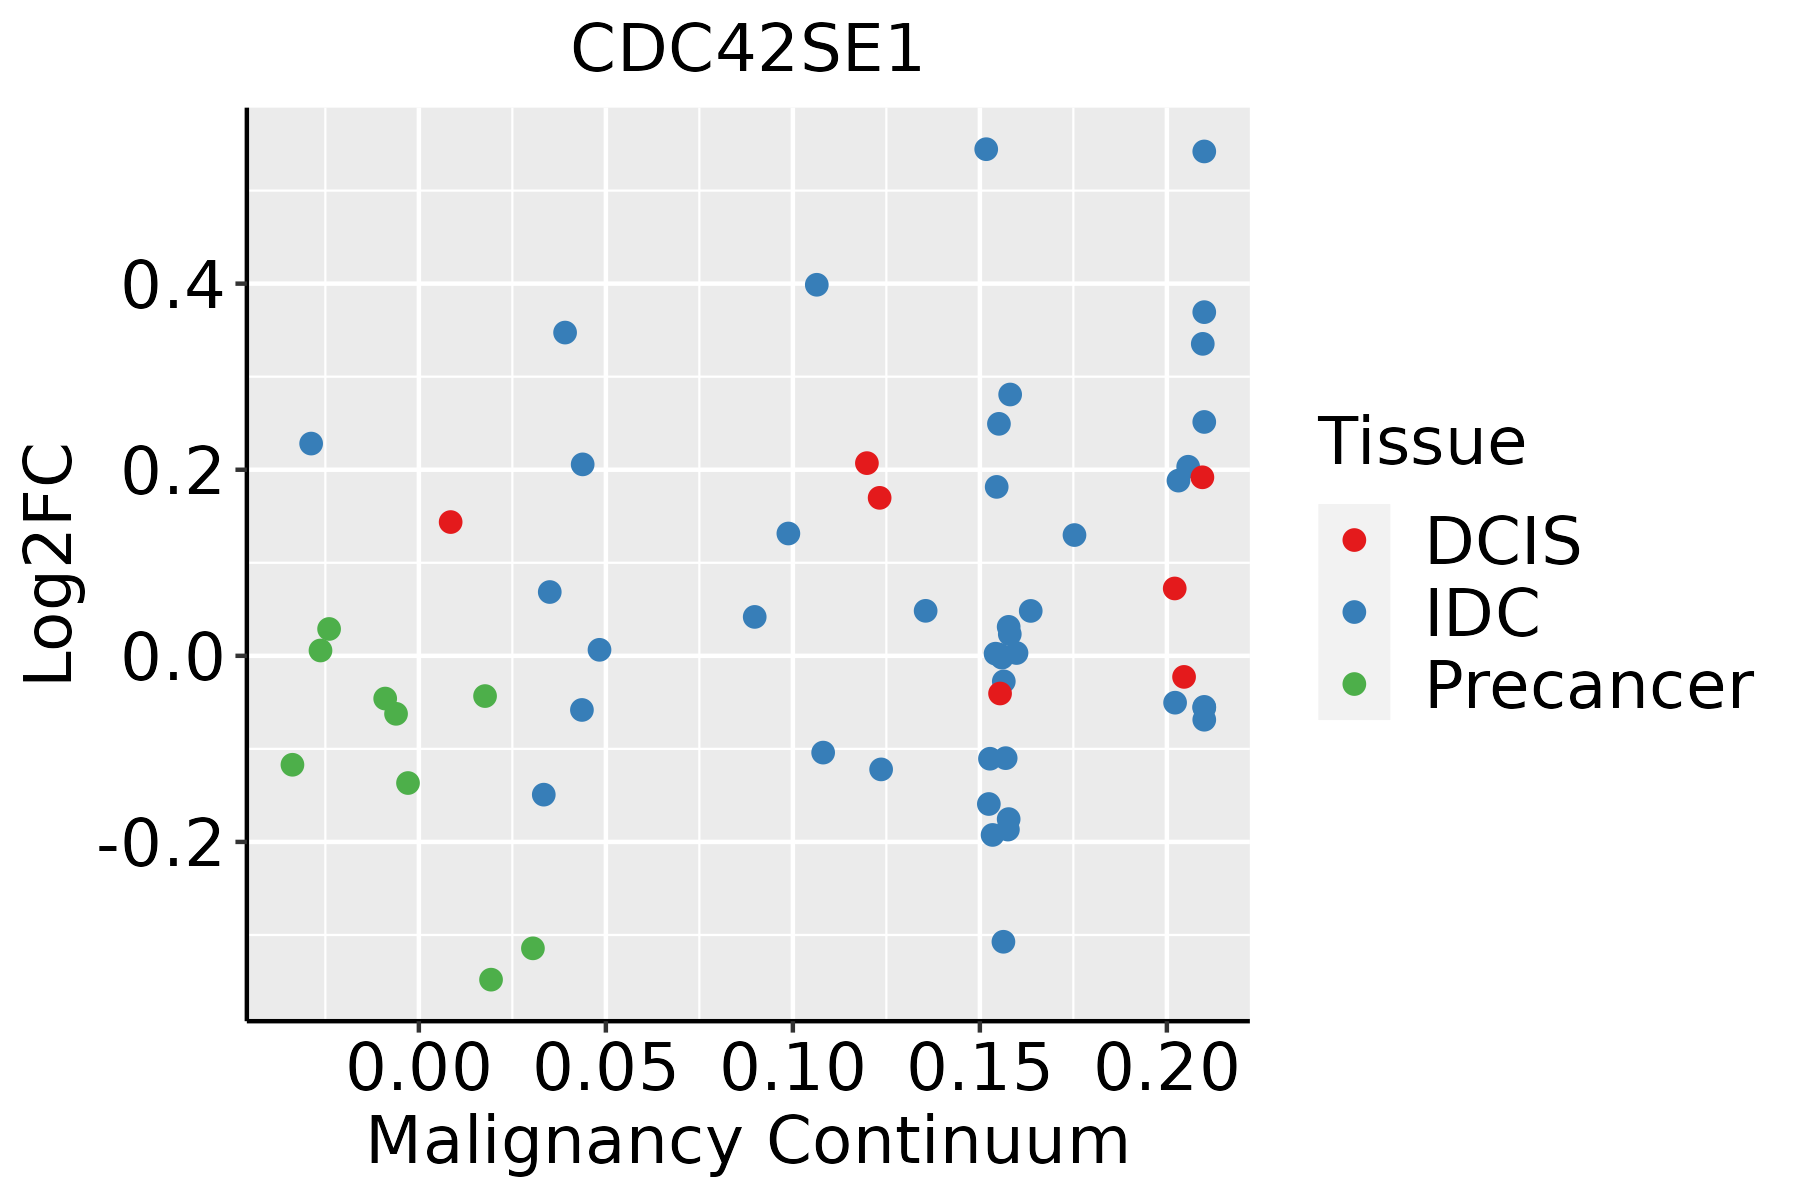 | IDC: Invasive ductal carcinoma |
| DCIS: Ductal carcinoma in situ | ||
| Precancer(BRCA1-mut): Precancerous lesion from BRCA1 mutation carriers | ||
| Esophagus |  | ESCC: Esophageal squamous cell carcinoma |
| HGIN: High-grade intraepithelial neoplasias | ||
| LGIN: Low-grade intraepithelial neoplasias | ||
| Liver | 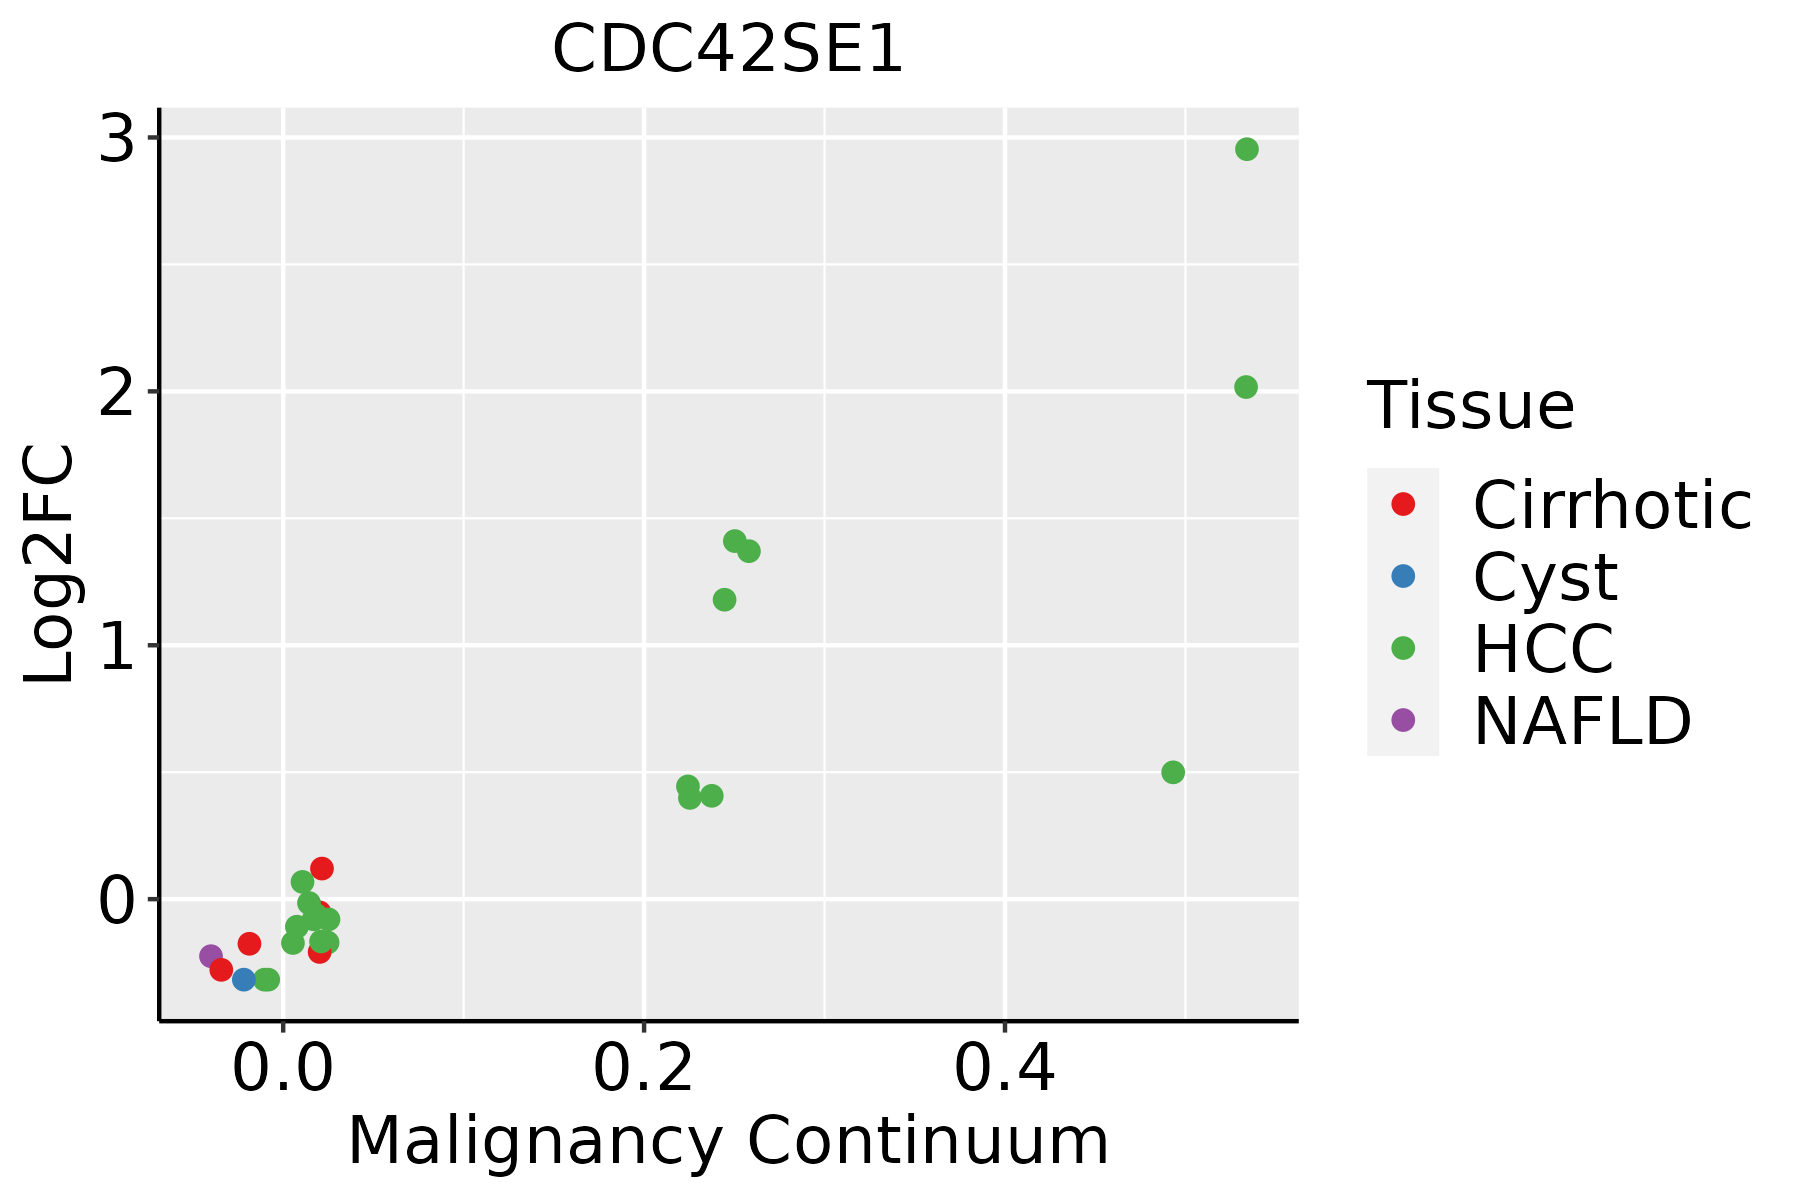 | HCC: Hepatocellular carcinoma |
| NAFLD: Non-alcoholic fatty liver disease | ||
| Oral Cavity | 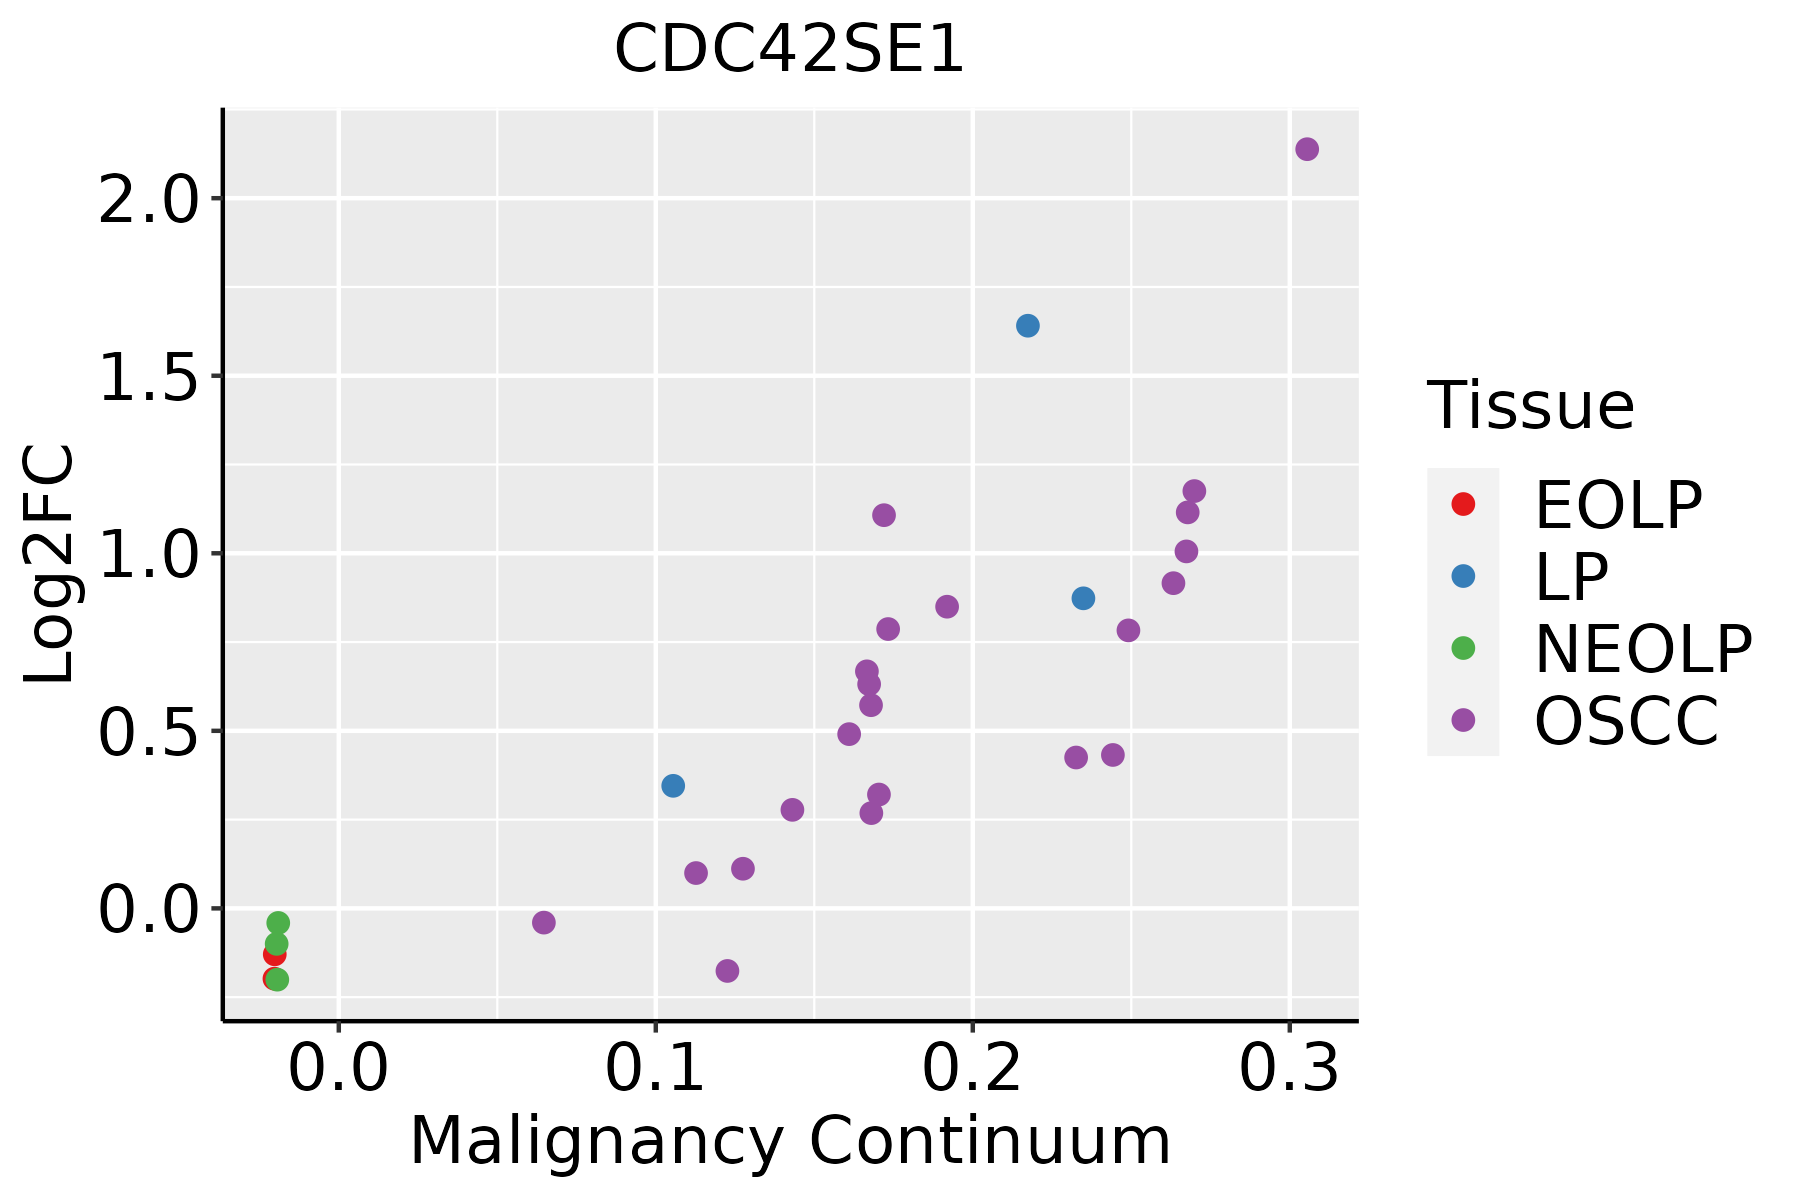 | EOLP: Erosive Oral lichen planus |
| LP: leukoplakia | ||
| NEOLP: Non-erosive oral lichen planus | ||
| OSCC: Oral squamous cell carcinoma | ||
| Prostate | 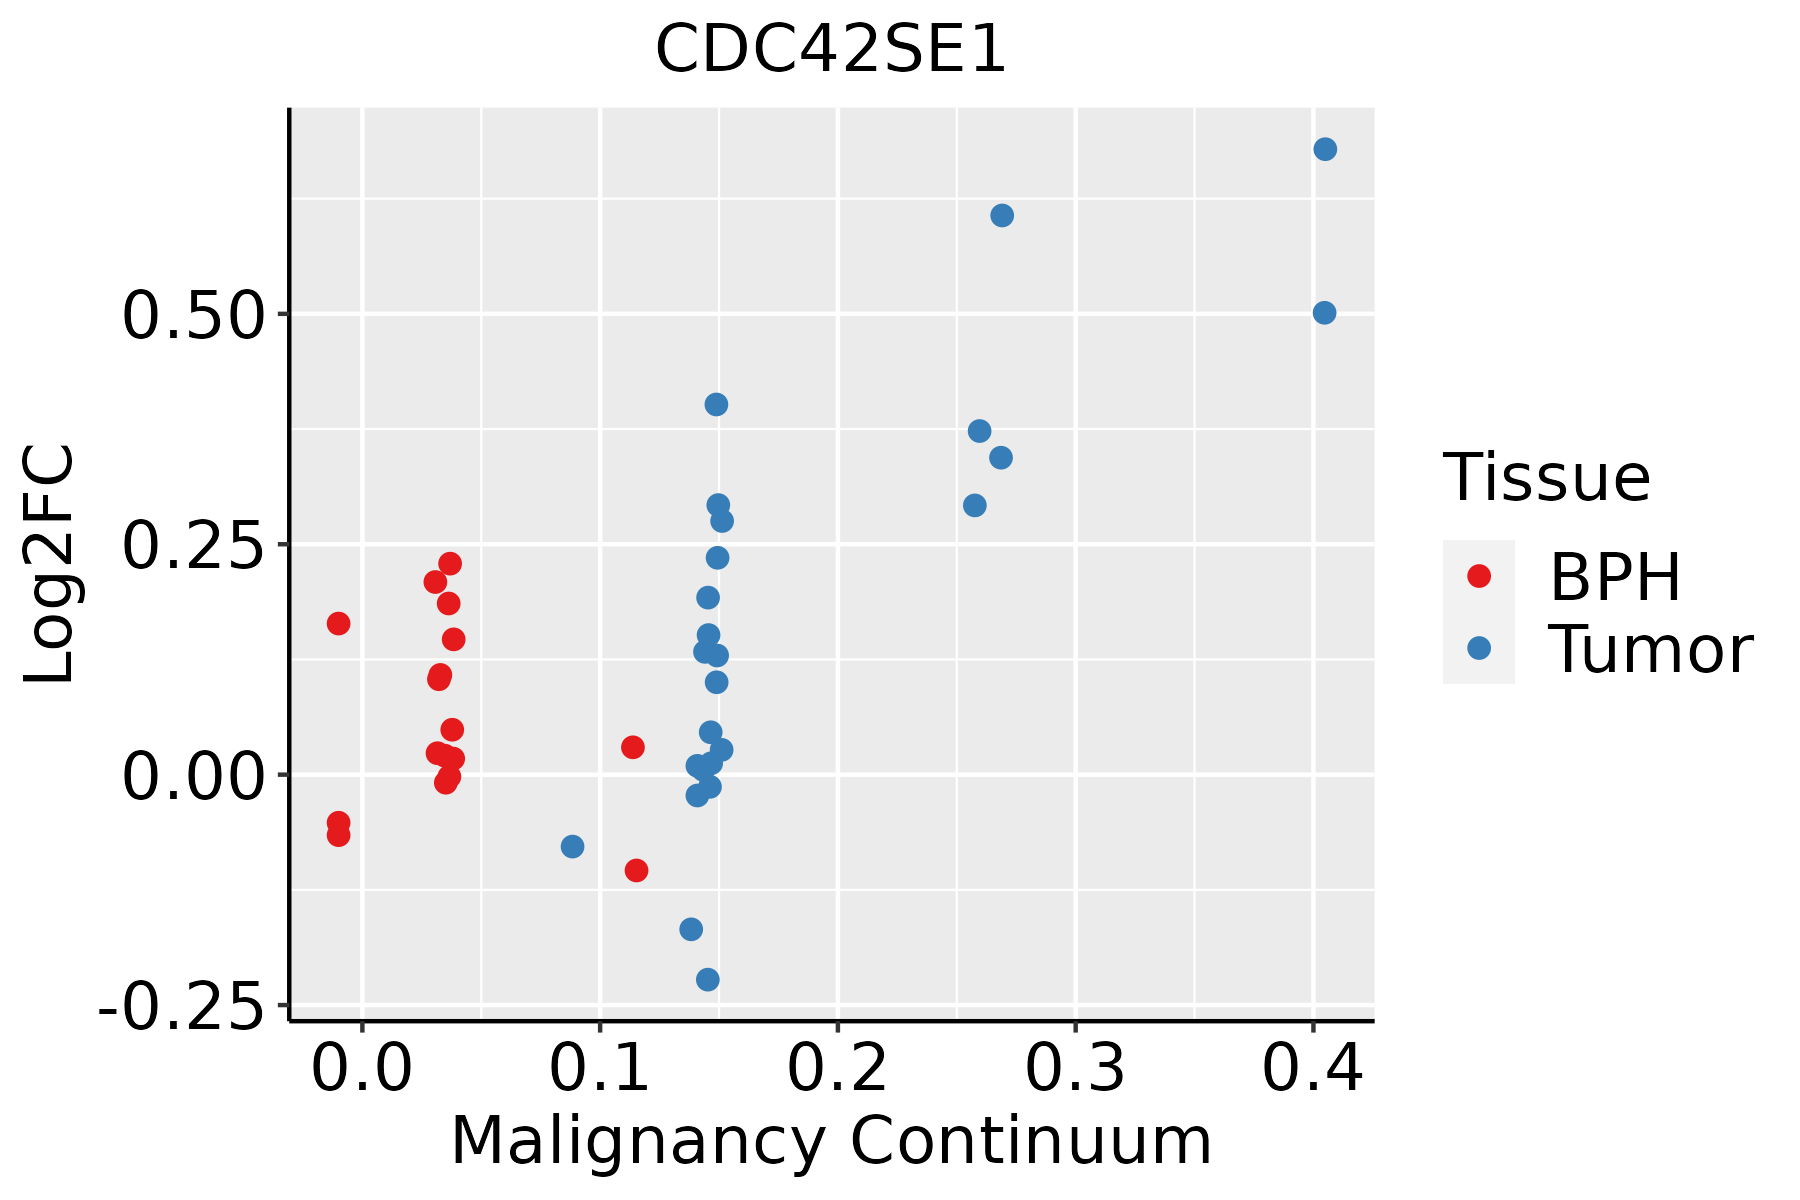 | BPH: Benign Prostatic Hyperplasia |
| Skin | 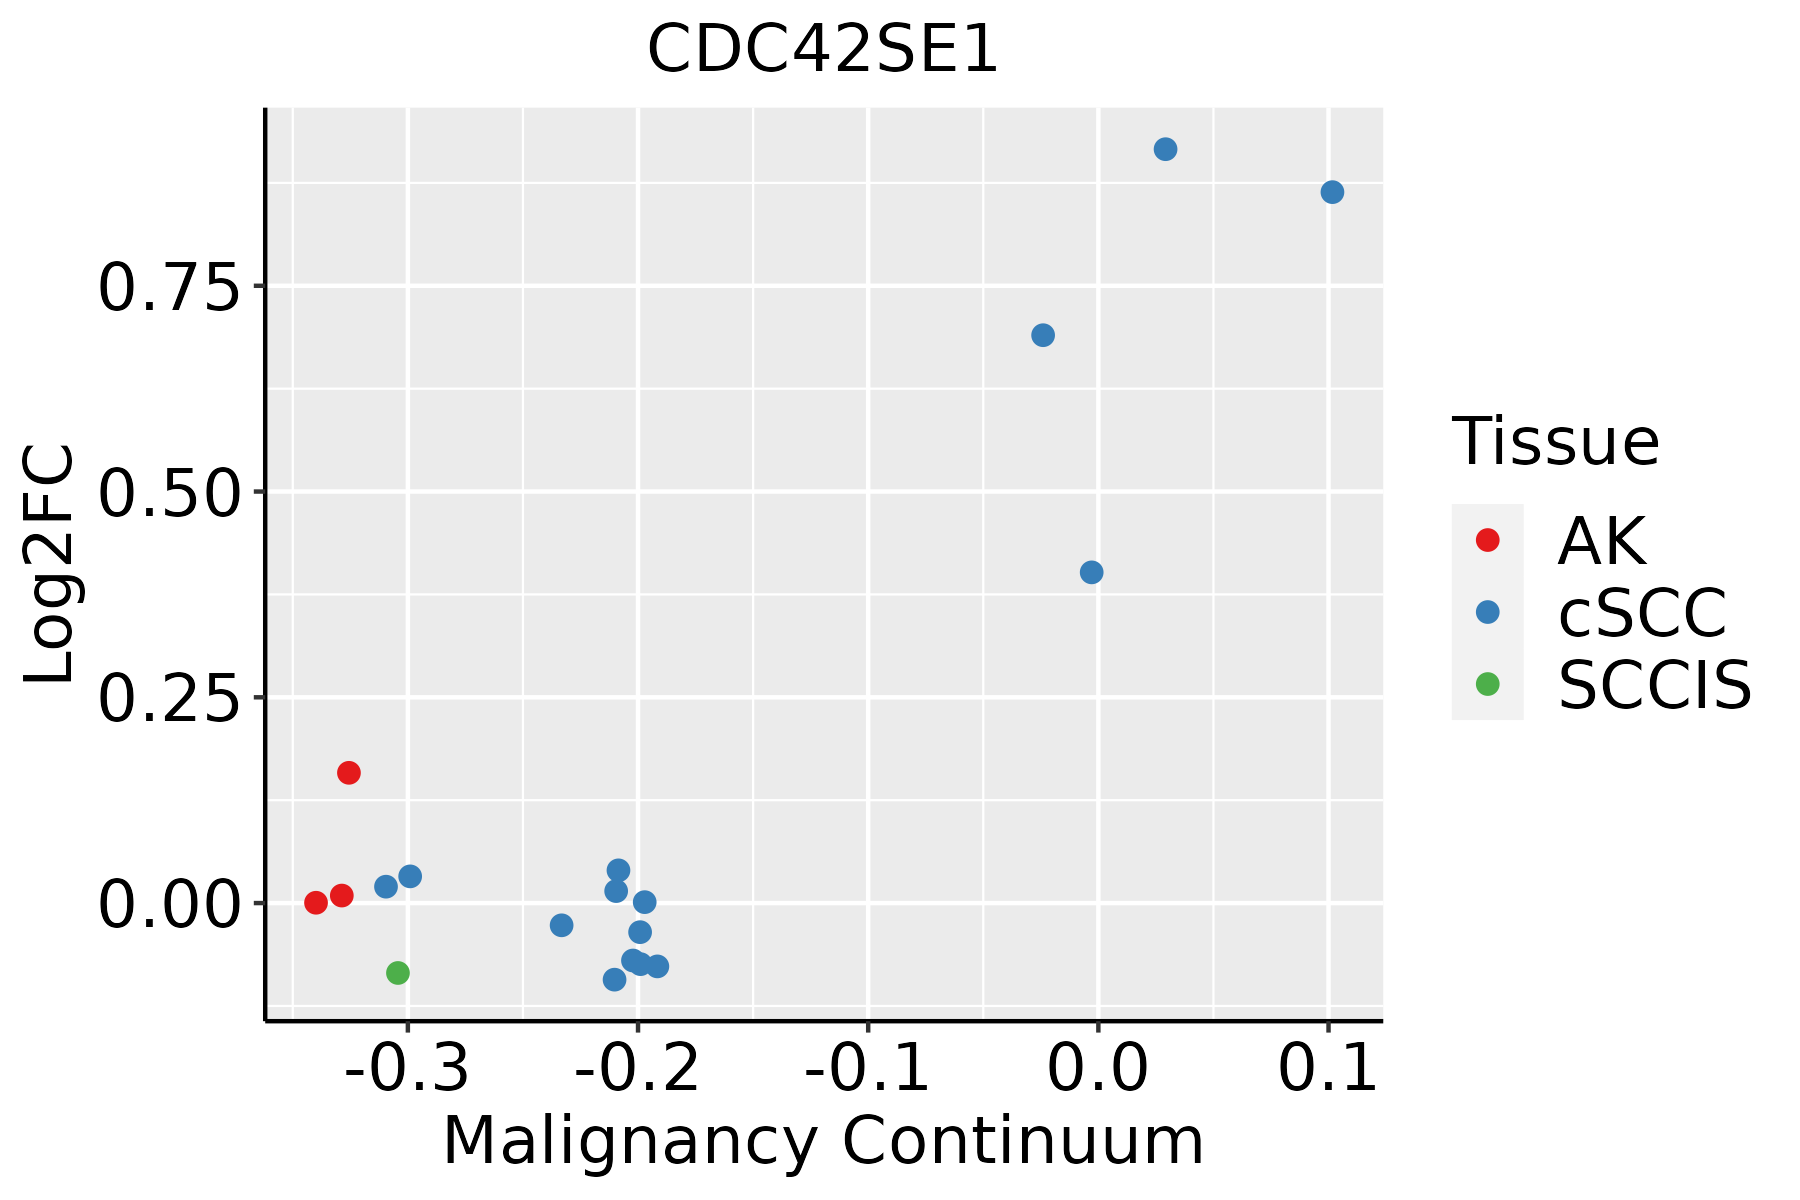 | AK: Actinic keratosis |
| cSCC: Cutaneous squamous cell carcinoma | ||
| SCCIS:squamous cell carcinoma in situ | ||
| Thyroid | 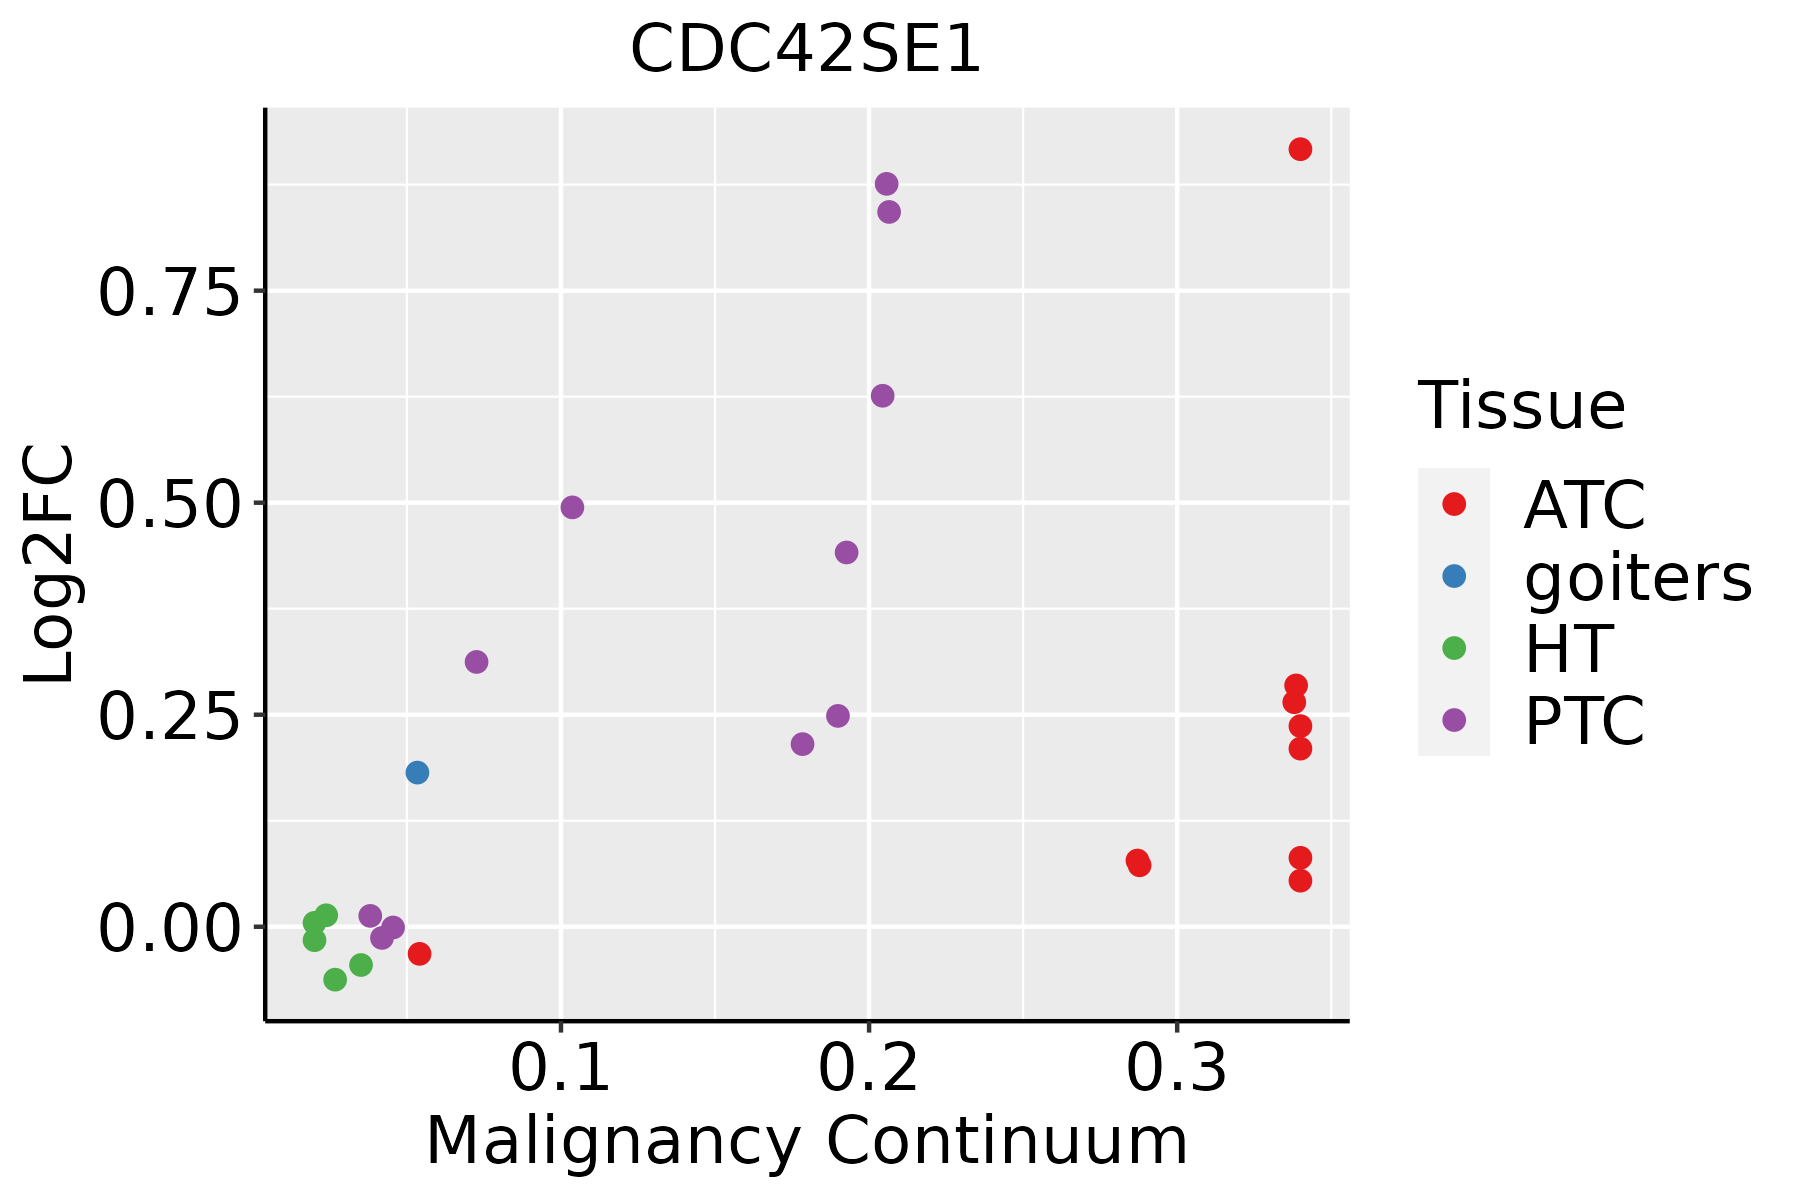 | ATC: Anaplastic thyroid cancer |
| HT: Hashimoto's thyroiditis | ||
| PTC: Papillary thyroid cancer |
| ∗log2FC in expression of this searched gene in stem-like cells from each diseased tissue sample relative to stem-like cells in normal samples in each tissue plotted against the malignancy continuum. Samples are colored based on if they are from different disease stage. |
Top |
Malignant transformation related pathway analysis |
| Find out the enriched GO biological processes and KEGG pathways involved in transition from healthy to precancer to cancer |
| Tissue | Disease Stage | Enriched GO biological Processes |
| Colorectum | AD |  |
| Colorectum | SER |  |
| Colorectum | MSS |  |
| Colorectum | MSI-H |  |
| Colorectum | FAP |  |
| ∗Top 15 enriched GO BP terms are showed in the bar plot of each disease state in each tissue. Each row represents a significant GO biological process which is colored according to the -log10(p.adjust). |
| Page: 1 2 3 4 5 6 7 8 9 |
| GO ID | Tissue | Disease Stage | Description | Gene Ratio | Bg Ratio | pvalue | p.adjust | Count |
| GO:000726510 | Esophagus | ESCC | Ras protein signal transduction | 201/8552 | 337/18723 | 1.44e-07 | 2.30e-06 | 201 |
| GO:002260420 | Esophagus | ESCC | regulation of cell morphogenesis | 180/8552 | 309/18723 | 5.19e-06 | 5.45e-05 | 180 |
| GO:000836018 | Esophagus | ESCC | regulation of cell shape | 92/8552 | 154/18723 | 3.00e-04 | 1.81e-03 | 92 |
| GO:000726610 | Esophagus | ESCC | Rho protein signal transduction | 81/8552 | 137/18723 | 1.03e-03 | 5.20e-03 | 81 |
| GO:00465789 | Esophagus | ESCC | regulation of Ras protein signal transduction | 106/8552 | 189/18723 | 2.49e-03 | 1.08e-02 | 106 |
| GO:005105610 | Esophagus | ESCC | regulation of small GTPase mediated signal transduction | 157/8552 | 302/18723 | 1.55e-02 | 4.98e-02 | 157 |
| GO:002260412 | Liver | Cirrhotic | regulation of cell morphogenesis | 127/4634 | 309/18723 | 1.45e-10 | 7.44e-09 | 127 |
| GO:000836012 | Liver | Cirrhotic | regulation of cell shape | 69/4634 | 154/18723 | 4.21e-08 | 1.36e-06 | 69 |
| GO:000726511 | Liver | Cirrhotic | Ras protein signal transduction | 119/4634 | 337/18723 | 8.16e-06 | 1.22e-04 | 119 |
| GO:000726611 | Liver | Cirrhotic | Rho protein signal transduction | 53/4634 | 137/18723 | 2.05e-04 | 1.89e-03 | 53 |
| GO:003502311 | Liver | Cirrhotic | regulation of Rho protein signal transduction | 32/4634 | 86/18723 | 6.81e-03 | 3.35e-02 | 32 |
| GO:002260422 | Liver | HCC | regulation of cell morphogenesis | 188/7958 | 309/18723 | 4.84e-11 | 1.82e-09 | 188 |
| GO:000726521 | Liver | HCC | Ras protein signal transduction | 187/7958 | 337/18723 | 8.89e-07 | 1.35e-05 | 187 |
| GO:000836022 | Liver | HCC | regulation of cell shape | 92/7958 | 154/18723 | 1.15e-05 | 1.31e-04 | 92 |
| GO:000726621 | Liver | HCC | Rho protein signal transduction | 76/7958 | 137/18723 | 1.46e-03 | 7.75e-03 | 76 |
| GO:004657811 | Liver | HCC | regulation of Ras protein signal transduction | 100/7958 | 189/18723 | 2.42e-03 | 1.18e-02 | 100 |
| GO:00072659 | Oral cavity | OSCC | Ras protein signal transduction | 185/7305 | 337/18723 | 1.95e-09 | 4.60e-08 | 185 |
| GO:002260419 | Oral cavity | OSCC | regulation of cell morphogenesis | 163/7305 | 309/18723 | 5.66e-07 | 8.19e-06 | 163 |
| GO:000836016 | Oral cavity | OSCC | regulation of cell shape | 88/7305 | 154/18723 | 3.73e-06 | 4.42e-05 | 88 |
| GO:00072669 | Oral cavity | OSCC | Rho protein signal transduction | 76/7305 | 137/18723 | 6.64e-05 | 5.37e-04 | 76 |
| Page: 1 2 3 4 |
| Pathway ID | Tissue | Disease Stage | Description | Gene Ratio | Bg Ratio | pvalue | p.adjust | qvalue | Count |
| Page: 1 |
Top |
Cell-cell communication analysis |
| Identification of potential cell-cell interactions between two cell types and their ligand-receptor pairs for different disease states |
| Ligand | Receptor | LRpair | Pathway | Tissue | Disease Stage |
| Page: 1 |
Top |
Single-cell gene regulatory network inference analysis |
| Find out the significant the regulons (TFs) and the target genes of each regulon across cell types for different disease states |
| TF | Cell Type | Tissue | Disease Stage | Target Gene | RSS | Regulon Activity |
| ∗The dot plots of a searched regulon are shown for all cell subpopulations in each disease state of each tissue based on the regulon specific score inferred using pySCENIC and by calculating the average expression. |
| Page: 1 |
Top |
Somatic mutation of malignant transformation related genes |
| Annotation of somatic variants for genes involved in malignant transformation |
| Hugo Symbol | Variant Class | Variant Classification | dbSNP RS | HGVSc | HGVSp | HGVSp Short | SWISSPROT | BIOTYPE | SIFT | PolyPhen | Tumor Sample Barcode | Tissue | Histology | Sex | Age | Stage | Therapy Types | Drugs | Outcome |
| CDC42SE1 | SNV | Missense_Mutation | novel | c.146N>T | p.Ala49Val | p.A49V | Q9NRR8 | protein_coding | tolerated(0.46) | possibly_damaging(0.866) | TCGA-AA-3877-01 | Colorectum | colon adenocarcinoma | Female | >=65 | I/II | Unknown | Unknown | SD |
| CDC42SE1 | SNV | Missense_Mutation | novel | c.37N>A | p.Val13Ile | p.V13I | Q9NRR8 | protein_coding | tolerated(0.33) | benign(0.173) | TCGA-A5-A0G2-01 | Endometrium | uterine corpus endometrioid carcinoma | Female | <65 | III/IV | Unknown | Unknown | SD |
| CDC42SE1 | SNV | Missense_Mutation | c.118N>G | p.Thr40Ala | p.T40A | Q9NRR8 | protein_coding | tolerated(1) | benign(0.376) | TCGA-AP-A054-01 | Endometrium | uterine corpus endometrioid carcinoma | Female | <65 | III/IV | Chemotherapy | carboplatin | PD | |
| CDC42SE1 | SNV | Missense_Mutation | novel | c.227N>A | p.Ser76Tyr | p.S76Y | Q9NRR8 | protein_coding | deleterious_low_confidence(0.01) | probably_damaging(0.919) | TCGA-EO-A3B0-01 | Endometrium | uterine corpus endometrioid carcinoma | Female | <65 | III/IV | Unknown | Unknown | SD |
| CDC42SE1 | SNV | Missense_Mutation | novel | c.194N>T | p.Ser65Phe | p.S65F | Q9NRR8 | protein_coding | deleterious(0) | benign(0.431) | TCGA-EY-A215-01 | Endometrium | uterine corpus endometrioid carcinoma | Female | <65 | I/II | Unknown | Unknown | SD |
| CDC42SE1 | SNV | Missense_Mutation | novel | c.92N>T | p.Gly31Val | p.G31V | Q9NRR8 | protein_coding | deleterious(0) | probably_damaging(0.999) | TCGA-18-3416-01 | Lung | lung squamous cell carcinoma | Male | >=65 | I/II | Unknown | Unknown | PD |
| CDC42SE1 | SNV | Missense_Mutation | c.200N>T | p.Gly67Val | p.G67V | Q9NRR8 | protein_coding | deleterious(0) | benign(0.155) | TCGA-D7-A4YT-01 | Stomach | stomach adenocarcinoma | Male | <65 | III/IV | Unknown | Unknown | SD |
| Page: 1 |
Top |
Related drugs of malignant transformation related genes |
| Identification of chemicals and drugs interact with genes involved in malignant transfromation |
| (DGIdb 4.0) |
| Entrez ID | Symbol | Category | Interaction Types | Drug Claim Name | Drug Name | PMIDs |
| Page: 1 |

Copyright 2023-Present -The University of Texas Health Science Center at Houston |