
|
|||||
|
 | |
| |
| |
| |
| |
| |
|
Gene: CDC42EP3 |
Gene summary for CDC42EP3 |
| Gene information | Species | Human | Gene symbol | CDC42EP3 | Gene ID | 10602 |
| Gene name | CDC42 effector protein 3 | |
| Gene Alias | BORG2 | |
| Cytomap | 2p22.2 | |
| Gene Type | protein-coding | GO ID | GO:0000902 | UniProtAcc | Q9UKI2 |
Top |
Malignant transformation analysis |
| Identification of the aberrant gene expression in precancerous and cancerous lesions by comparing the gene expression of stem-like cells in diseased tissues with normal stem cells |
| Entrez ID | Symbol | Replicates | Species | Organ | Tissue | Adj P-value | Log2FC | Malignancy |
| 10602 | CDC42EP3 | LZE4T | Human | Esophagus | ESCC | 1.65e-33 | 1.45e+00 | 0.0811 |
| 10602 | CDC42EP3 | LZE7T | Human | Esophagus | ESCC | 7.44e-13 | 8.93e-01 | 0.0667 |
| 10602 | CDC42EP3 | LZE8T | Human | Esophagus | ESCC | 2.78e-05 | 3.01e-01 | 0.067 |
| 10602 | CDC42EP3 | LZE20T | Human | Esophagus | ESCC | 3.12e-02 | 4.77e-01 | 0.0662 |
| 10602 | CDC42EP3 | LZE22D1 | Human | Esophagus | HGIN | 1.65e-06 | 2.53e-01 | 0.0595 |
| 10602 | CDC42EP3 | LZE22T | Human | Esophagus | ESCC | 4.33e-14 | 1.57e+00 | 0.068 |
| 10602 | CDC42EP3 | LZE24T | Human | Esophagus | ESCC | 1.17e-20 | 8.69e-01 | 0.0596 |
| 10602 | CDC42EP3 | LZE21T | Human | Esophagus | ESCC | 6.16e-05 | 9.94e-01 | 0.0655 |
| 10602 | CDC42EP3 | LZE6T | Human | Esophagus | ESCC | 1.32e-03 | 2.49e-01 | 0.0845 |
| 10602 | CDC42EP3 | P1T-E | Human | Esophagus | ESCC | 9.03e-07 | 8.86e-01 | 0.0875 |
| 10602 | CDC42EP3 | P2T-E | Human | Esophagus | ESCC | 1.66e-28 | 1.02e+00 | 0.1177 |
| 10602 | CDC42EP3 | P4T-E | Human | Esophagus | ESCC | 1.86e-13 | 6.49e-01 | 0.1323 |
| 10602 | CDC42EP3 | P5T-E | Human | Esophagus | ESCC | 4.09e-67 | 1.96e+00 | 0.1327 |
| 10602 | CDC42EP3 | P8T-E | Human | Esophagus | ESCC | 1.79e-17 | 5.76e-01 | 0.0889 |
| 10602 | CDC42EP3 | P9T-E | Human | Esophagus | ESCC | 1.09e-11 | 4.62e-01 | 0.1131 |
| 10602 | CDC42EP3 | P10T-E | Human | Esophagus | ESCC | 2.17e-16 | 5.02e-01 | 0.116 |
| 10602 | CDC42EP3 | P11T-E | Human | Esophagus | ESCC | 2.95e-28 | 2.07e+00 | 0.1426 |
| 10602 | CDC42EP3 | P12T-E | Human | Esophagus | ESCC | 7.11e-54 | 1.68e+00 | 0.1122 |
| 10602 | CDC42EP3 | P15T-E | Human | Esophagus | ESCC | 1.02e-42 | 1.19e+00 | 0.1149 |
| 10602 | CDC42EP3 | P16T-E | Human | Esophagus | ESCC | 1.59e-25 | 8.00e-01 | 0.1153 |
| Page: 1 2 3 4 5 |
| Tissue | Expression Dynamics | Abbreviation |
| Esophagus | 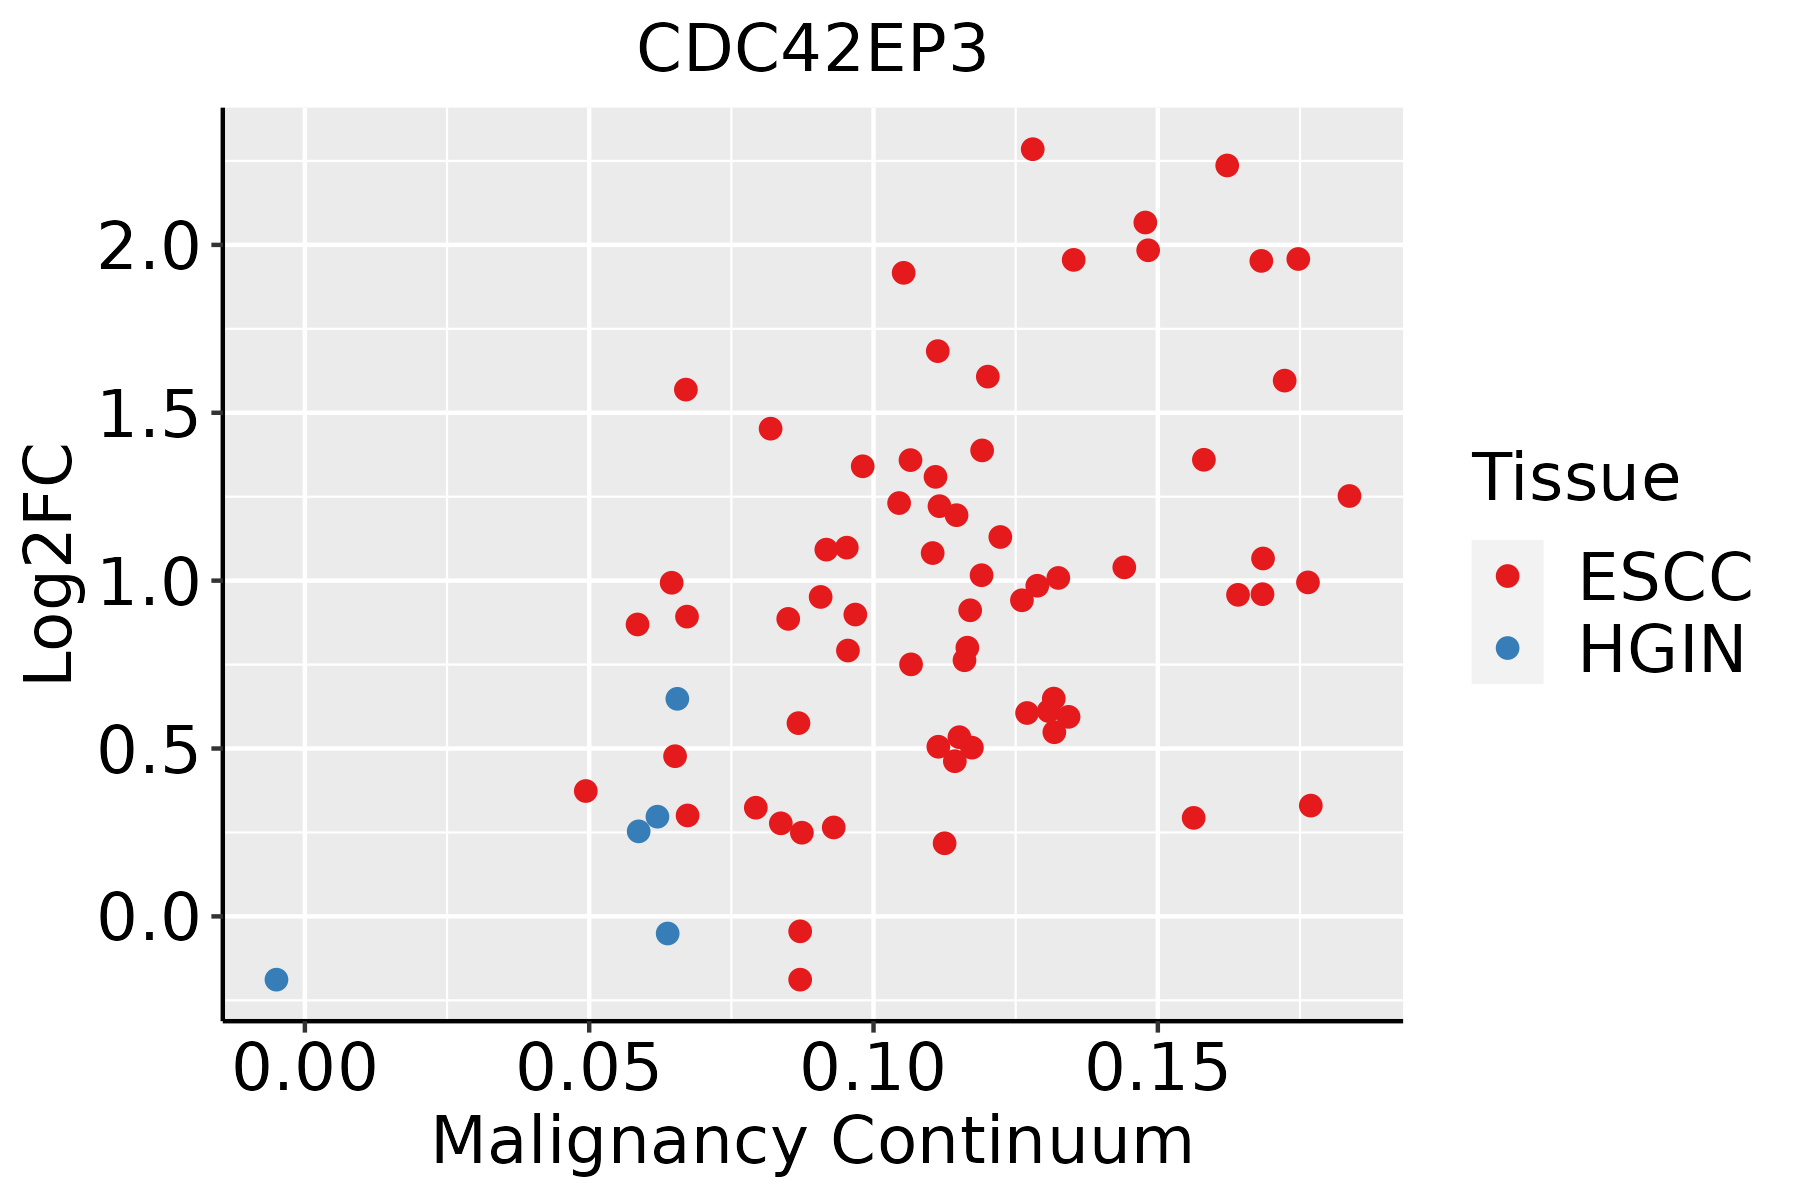 | ESCC: Esophageal squamous cell carcinoma |
| HGIN: High-grade intraepithelial neoplasias | ||
| LGIN: Low-grade intraepithelial neoplasias | ||
| Oral Cavity | 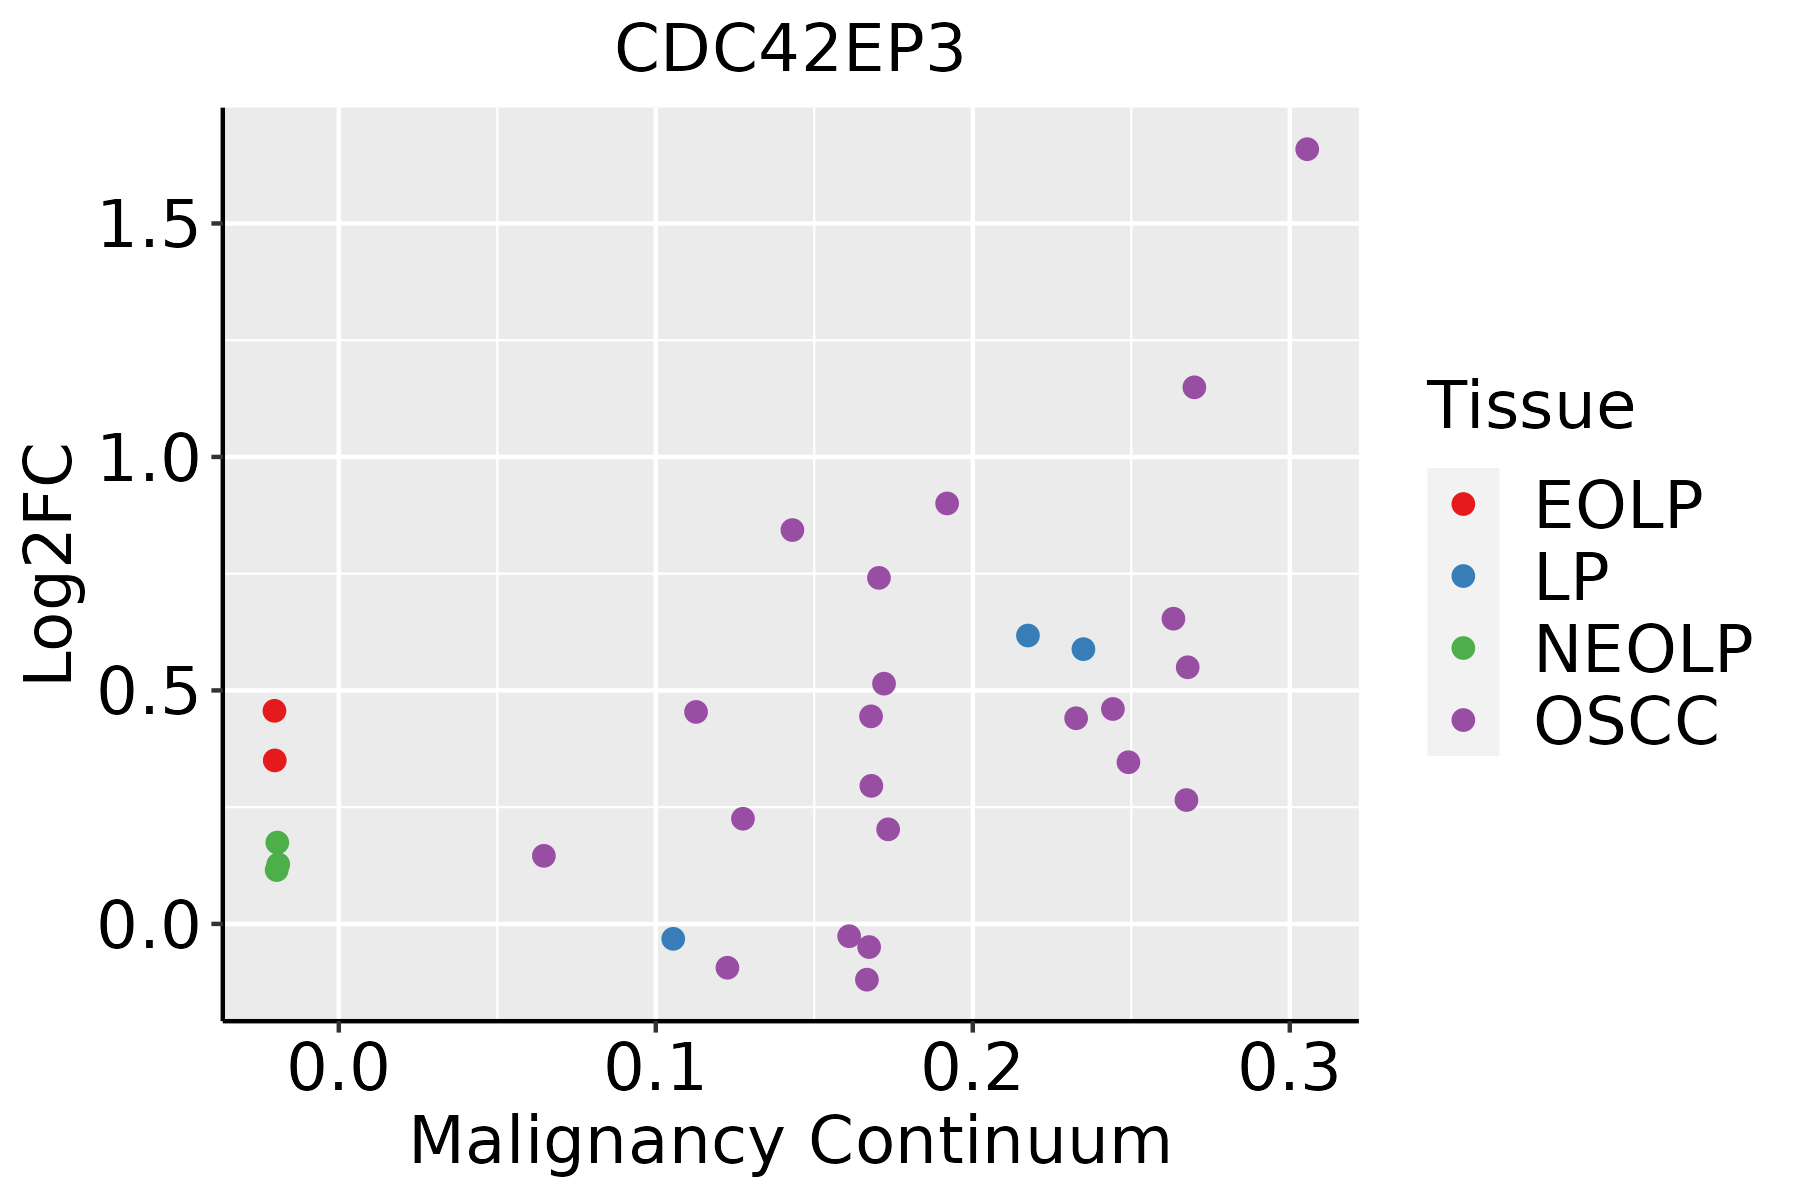 | EOLP: Erosive Oral lichen planus |
| LP: leukoplakia | ||
| NEOLP: Non-erosive oral lichen planus | ||
| OSCC: Oral squamous cell carcinoma | ||
| Thyroid | 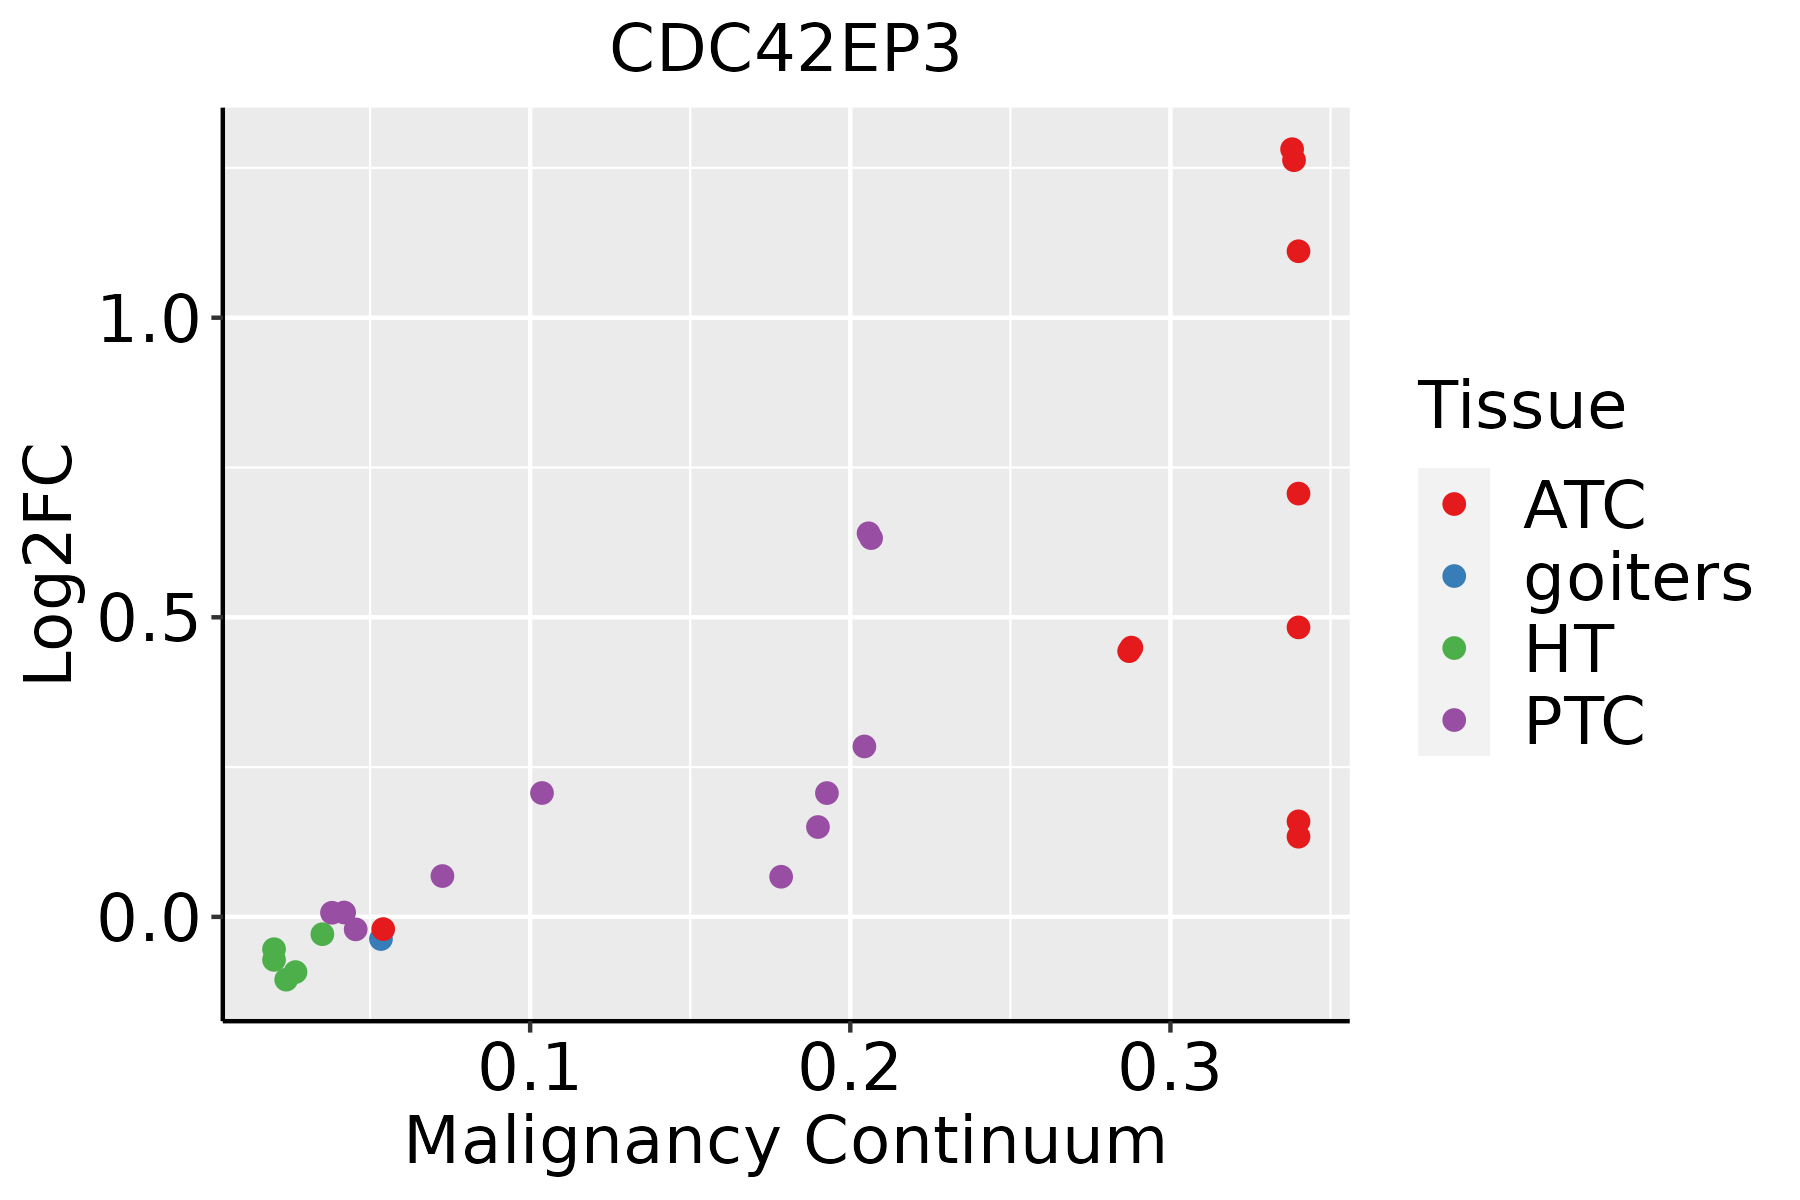 | ATC: Anaplastic thyroid cancer |
| HT: Hashimoto's thyroiditis | ||
| PTC: Papillary thyroid cancer |
| ∗log2FC in expression of this searched gene in stem-like cells from each diseased tissue sample relative to stem-like cells in normal samples in each tissue plotted against the malignancy continuum. Samples are colored based on if they are from different disease stage. |
Top |
Malignant transformation related pathway analysis |
| Find out the enriched GO biological processes and KEGG pathways involved in transition from healthy to precancer to cancer |
| Tissue | Disease Stage | Enriched GO biological Processes |
| Colorectum | AD |  |
| Colorectum | SER |  |
| Colorectum | MSS |  |
| Colorectum | MSI-H |  |
| Colorectum | FAP |  |
| ∗Top 15 enriched GO BP terms are showed in the bar plot of each disease state in each tissue. Each row represents a significant GO biological process which is colored according to the -log10(p.adjust). |
| Page: 1 2 3 4 5 6 7 8 9 |
| GO ID | Tissue | Disease Stage | Description | Gene Ratio | Bg Ratio | pvalue | p.adjust | Count |
| GO:003133425 | Esophagus | HGIN | positive regulation of protein-containing complex assembly | 61/2587 | 237/18723 | 7.10e-07 | 3.00e-05 | 61 |
| GO:004325427 | Esophagus | HGIN | regulation of protein-containing complex assembly | 94/2587 | 428/18723 | 2.39e-06 | 8.55e-05 | 94 |
| GO:005125826 | Esophagus | HGIN | protein polymerization | 66/2587 | 297/18723 | 4.96e-05 | 1.19e-03 | 66 |
| GO:190290327 | Esophagus | HGIN | regulation of supramolecular fiber organization | 79/2587 | 383/18723 | 1.40e-04 | 2.81e-03 | 79 |
| GO:003297027 | Esophagus | HGIN | regulation of actin filament-based process | 77/2587 | 397/18723 | 1.14e-03 | 1.39e-02 | 77 |
| GO:003227126 | Esophagus | HGIN | regulation of protein polymerization | 49/2587 | 233/18723 | 1.56e-03 | 1.79e-02 | 49 |
| GO:003227320 | Esophagus | HGIN | positive regulation of protein polymerization | 32/2587 | 138/18723 | 1.95e-03 | 2.07e-02 | 32 |
| GO:003295627 | Esophagus | HGIN | regulation of actin cytoskeleton organization | 69/2587 | 358/18723 | 2.35e-03 | 2.39e-02 | 69 |
| GO:003004120 | Esophagus | HGIN | actin filament polymerization | 40/2587 | 191/18723 | 4.29e-03 | 3.82e-02 | 40 |
| GO:190290526 | Esophagus | HGIN | positive regulation of supramolecular fiber organization | 43/2587 | 209/18723 | 4.42e-03 | 3.87e-02 | 43 |
| GO:006049117 | Esophagus | HGIN | regulation of cell projection assembly | 39/2587 | 188/18723 | 5.61e-03 | 4.57e-02 | 39 |
| GO:0043254111 | Esophagus | ESCC | regulation of protein-containing complex assembly | 278/8552 | 428/18723 | 3.81e-16 | 2.77e-14 | 278 |
| GO:0031334111 | Esophagus | ESCC | positive regulation of protein-containing complex assembly | 166/8552 | 237/18723 | 2.06e-14 | 1.07e-12 | 166 |
| GO:1902905111 | Esophagus | ESCC | positive regulation of supramolecular fiber organization | 142/8552 | 209/18723 | 5.51e-11 | 1.76e-09 | 142 |
| GO:1902903111 | Esophagus | ESCC | regulation of supramolecular fiber organization | 237/8552 | 383/18723 | 9.06e-11 | 2.75e-09 | 237 |
| GO:005149520 | Esophagus | ESCC | positive regulation of cytoskeleton organization | 147/8552 | 226/18723 | 2.93e-09 | 6.38e-08 | 147 |
| GO:0051258111 | Esophagus | ESCC | protein polymerization | 183/8552 | 297/18723 | 1.94e-08 | 3.75e-07 | 183 |
| GO:000701527 | Esophagus | ESCC | actin filament organization | 259/8552 | 442/18723 | 2.37e-08 | 4.50e-07 | 259 |
| GO:0032273111 | Esophagus | ESCC | positive regulation of protein polymerization | 95/8552 | 138/18723 | 2.97e-08 | 5.57e-07 | 95 |
| GO:003253520 | Esophagus | ESCC | regulation of cellular component size | 227/8552 | 383/18723 | 4.77e-08 | 8.60e-07 | 227 |
| Page: 1 2 3 4 5 6 7 8 9 |
| Pathway ID | Tissue | Disease Stage | Description | Gene Ratio | Bg Ratio | pvalue | p.adjust | qvalue | Count |
| Page: 1 |
Top |
Cell-cell communication analysis |
| Identification of potential cell-cell interactions between two cell types and their ligand-receptor pairs for different disease states |
| Ligand | Receptor | LRpair | Pathway | Tissue | Disease Stage |
| Page: 1 |
Top |
Single-cell gene regulatory network inference analysis |
| Find out the significant the regulons (TFs) and the target genes of each regulon across cell types for different disease states |
| TF | Cell Type | Tissue | Disease Stage | Target Gene | RSS | Regulon Activity |
| ∗The dot plots of a searched regulon are shown for all cell subpopulations in each disease state of each tissue based on the regulon specific score inferred using pySCENIC and by calculating the average expression. |
| Page: 1 |
Top |
Somatic mutation of malignant transformation related genes |
| Annotation of somatic variants for genes involved in malignant transformation |
| Hugo Symbol | Variant Class | Variant Classification | dbSNP RS | HGVSc | HGVSp | HGVSp Short | SWISSPROT | BIOTYPE | SIFT | PolyPhen | Tumor Sample Barcode | Tissue | Histology | Sex | Age | Stage | Therapy Types | Drugs | Outcome |
| CDC42EP3 | SNV | Missense_Mutation | novel | c.494N>A | p.Val165Asp | p.V165D | Q9UKI2 | protein_coding | tolerated(0.34) | benign(0.006) | TCGA-AN-A046-01 | Breast | breast invasive carcinoma | Female | >=65 | I/II | Unknown | Unknown | SD |
| CDC42EP3 | SNV | Missense_Mutation | novel | c.143G>T | p.Gly48Val | p.G48V | Q9UKI2 | protein_coding | deleterious(0) | probably_damaging(1) | TCGA-C5-A1MN-01 | Cervix | cervical & endocervical cancer | Female | <65 | III/IV | Chemotherapy | cisplatin | SD |
| CDC42EP3 | SNV | Missense_Mutation | c.304N>A | p.Val102Met | p.V102M | Q9UKI2 | protein_coding | deleterious(0) | probably_damaging(0.995) | TCGA-A6-6781-01 | Colorectum | colon adenocarcinoma | Male | <65 | III/IV | Chemotherapy | oxaliplatin | SD | |
| CDC42EP3 | SNV | Missense_Mutation | c.252C>A | p.Phe84Leu | p.F84L | Q9UKI2 | protein_coding | deleterious(0.03) | probably_damaging(0.989) | TCGA-AA-3977-01 | Colorectum | colon adenocarcinoma | Male | >=65 | I/II | Unknown | Unknown | SD | |
| CDC42EP3 | SNV | Missense_Mutation | c.272N>T | p.Ser91Leu | p.S91L | Q9UKI2 | protein_coding | deleterious(0.04) | benign(0.091) | TCGA-D5-5541-01 | Colorectum | colon adenocarcinoma | Male | <65 | III/IV | Chemotherapy | calcium | SD | |
| CDC42EP3 | SNV | Missense_Mutation | novel | c.488N>A | p.Gly163Glu | p.G163E | Q9UKI2 | protein_coding | tolerated(0.9) | benign(0.007) | TCGA-A5-A0G1-01 | Endometrium | uterine corpus endometrioid carcinoma | Female | >=65 | I/II | Unknown | Unknown | SD |
| CDC42EP3 | SNV | Missense_Mutation | rs760291443 | c.220N>T | p.His74Tyr | p.H74Y | Q9UKI2 | protein_coding | tolerated(1) | benign(0.033) | TCGA-A5-A0G1-01 | Endometrium | uterine corpus endometrioid carcinoma | Female | >=65 | I/II | Unknown | Unknown | SD |
| CDC42EP3 | SNV | Missense_Mutation | novel | c.388N>A | p.Ser130Thr | p.S130T | Q9UKI2 | protein_coding | tolerated(1) | benign(0.001) | TCGA-A5-A0G2-01 | Endometrium | uterine corpus endometrioid carcinoma | Female | <65 | III/IV | Unknown | Unknown | SD |
| CDC42EP3 | SNV | Missense_Mutation | novel | c.89N>C | p.Met30Thr | p.M30T | Q9UKI2 | protein_coding | deleterious(0) | benign(0.237) | TCGA-A5-A2K5-01 | Endometrium | uterine corpus endometrioid carcinoma | Female | >=65 | I/II | Unknown | Unknown | SD |
| CDC42EP3 | SNV | Missense_Mutation | rs771605083 | c.634N>A | p.Glu212Lys | p.E212K | Q9UKI2 | protein_coding | tolerated(0.19) | benign(0) | TCGA-AP-A056-01 | Endometrium | uterine corpus endometrioid carcinoma | Female | <65 | I/II | Unknown | Unknown | SD |
| Page: 1 2 3 |
Top |
Related drugs of malignant transformation related genes |
| Identification of chemicals and drugs interact with genes involved in malignant transfromation |
| (DGIdb 4.0) |
| Entrez ID | Symbol | Category | Interaction Types | Drug Claim Name | Drug Name | PMIDs |
| Page: 1 |

Copyright 2023-Present -The University of Texas Health Science Center at Houston |