
|
|||||
|
 | |
| |
| |
| |
| |
| |
|
Gene: CDC42BPB |
Gene summary for CDC42BPB |
| Gene information | Species | Human | Gene symbol | CDC42BPB | Gene ID | 9578 |
| Gene name | CDC42 binding protein kinase beta | |
| Gene Alias | MRCKB | |
| Cytomap | 14q32.32 | |
| Gene Type | protein-coding | GO ID | GO:0006464 | UniProtAcc | A0A024R6N2 |
Top |
Malignant transformation analysis |
| Identification of the aberrant gene expression in precancerous and cancerous lesions by comparing the gene expression of stem-like cells in diseased tissues with normal stem cells |
| Entrez ID | Symbol | Replicates | Species | Organ | Tissue | Adj P-value | Log2FC | Malignancy |
| 9578 | CDC42BPB | CA_HPV_2 | Human | Cervix | CC | 3.15e-02 | 1.73e-01 | 0.0391 |
| 9578 | CDC42BPB | CCI_1 | Human | Cervix | CC | 1.17e-09 | 8.59e-01 | 0.528 |
| 9578 | CDC42BPB | CCI_3 | Human | Cervix | CC | 1.53e-04 | 6.70e-01 | 0.516 |
| 9578 | CDC42BPB | sample3 | Human | Cervix | CC | 7.38e-09 | 1.89e-01 | 0.1387 |
| 9578 | CDC42BPB | T3 | Human | Cervix | CC | 2.61e-05 | 1.76e-01 | 0.1389 |
| 9578 | CDC42BPB | AEH-subject3 | Human | Endometrium | AEH | 3.58e-02 | -1.62e-02 | -0.2576 |
| 9578 | CDC42BPB | GSM6177620_NYU_UCEC1_lib1_lib1 | Human | Endometrium | EEC | 3.30e-09 | -3.89e-02 | -0.1869 |
| 9578 | CDC42BPB | GSM6177620_NYU_UCEC1_lib2_lib2 | Human | Endometrium | EEC | 4.12e-12 | -2.03e-02 | -0.1875 |
| 9578 | CDC42BPB | GSM6177620_NYU_UCEC1_lib3_lib3 | Human | Endometrium | EEC | 1.33e-12 | -7.16e-02 | -0.1883 |
| 9578 | CDC42BPB | GSM6177621_NYU_UCEC2_lib1_lib1 | Human | Endometrium | EEC | 5.43e-10 | -9.26e-02 | -0.1934 |
| 9578 | CDC42BPB | GSM6177622_NYU_UCEC3_lib1_lib1 | Human | Endometrium | EEC | 9.13e-16 | 1.96e-02 | -0.1917 |
| 9578 | CDC42BPB | GSM6177622_NYU_UCEC3_lib2_lib2 | Human | Endometrium | EEC | 3.86e-13 | 1.46e-01 | -0.1916 |
| 9578 | CDC42BPB | GSM6177623_NYU_UCEC3_Vis | Human | Endometrium | EEC | 1.08e-02 | 6.97e-02 | -0.1269 |
| 9578 | CDC42BPB | LZE8T | Human | Esophagus | ESCC | 2.25e-03 | 6.47e-02 | 0.067 |
| 9578 | CDC42BPB | LZE20T | Human | Esophagus | ESCC | 1.36e-04 | 2.28e-01 | 0.0662 |
| 9578 | CDC42BPB | LZE24T | Human | Esophagus | ESCC | 6.11e-08 | 1.65e-01 | 0.0596 |
| 9578 | CDC42BPB | P1T-E | Human | Esophagus | ESCC | 1.77e-05 | 2.85e-01 | 0.0875 |
| 9578 | CDC42BPB | P2T-E | Human | Esophagus | ESCC | 7.28e-12 | 1.04e-01 | 0.1177 |
| 9578 | CDC42BPB | P4T-E | Human | Esophagus | ESCC | 2.51e-07 | 1.47e-01 | 0.1323 |
| 9578 | CDC42BPB | P5T-E | Human | Esophagus | ESCC | 8.48e-14 | 2.48e-01 | 0.1327 |
| Page: 1 2 3 4 5 6 7 |
| Tissue | Expression Dynamics | Abbreviation |
| Cervix | 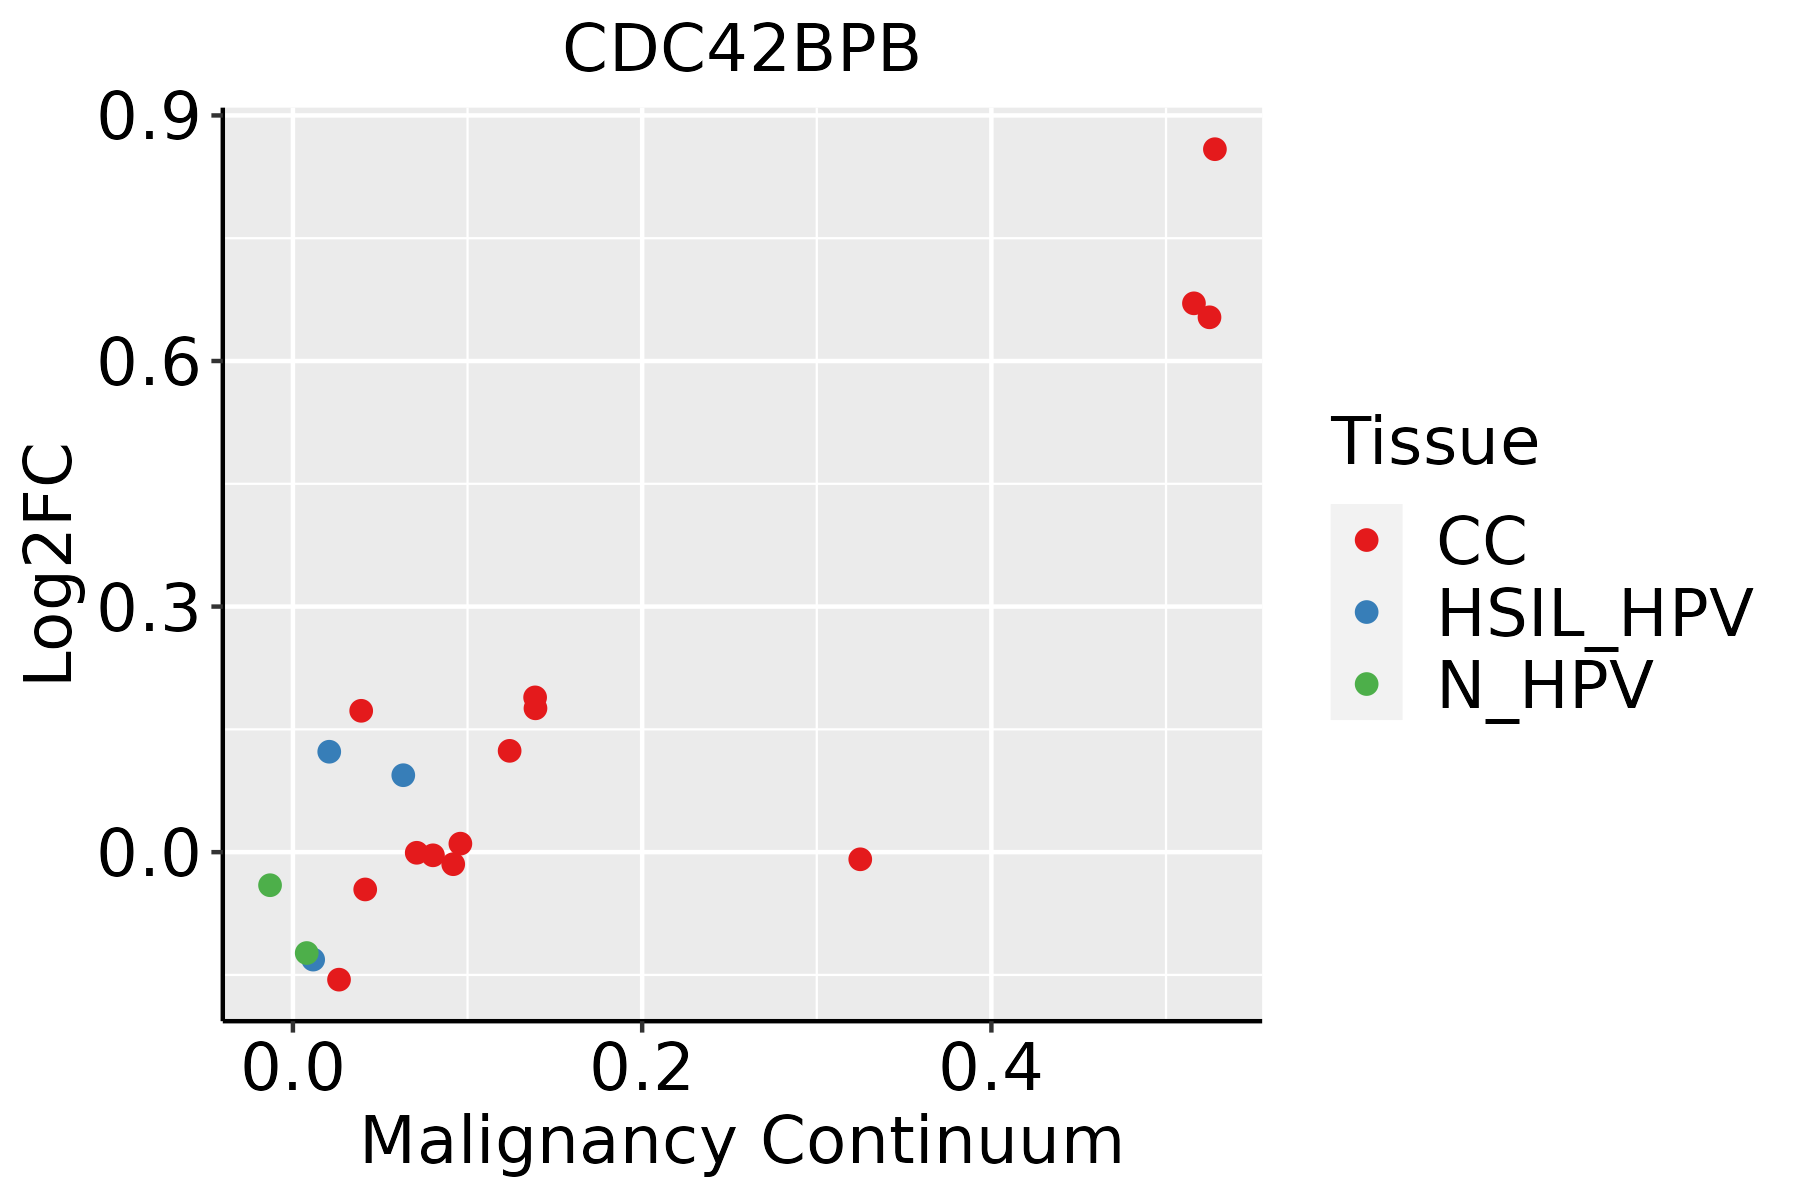 | CC: Cervix cancer |
| HSIL_HPV: HPV-infected high-grade squamous intraepithelial lesions | ||
| N_HPV: HPV-infected normal cervix | ||
| Endometrium | 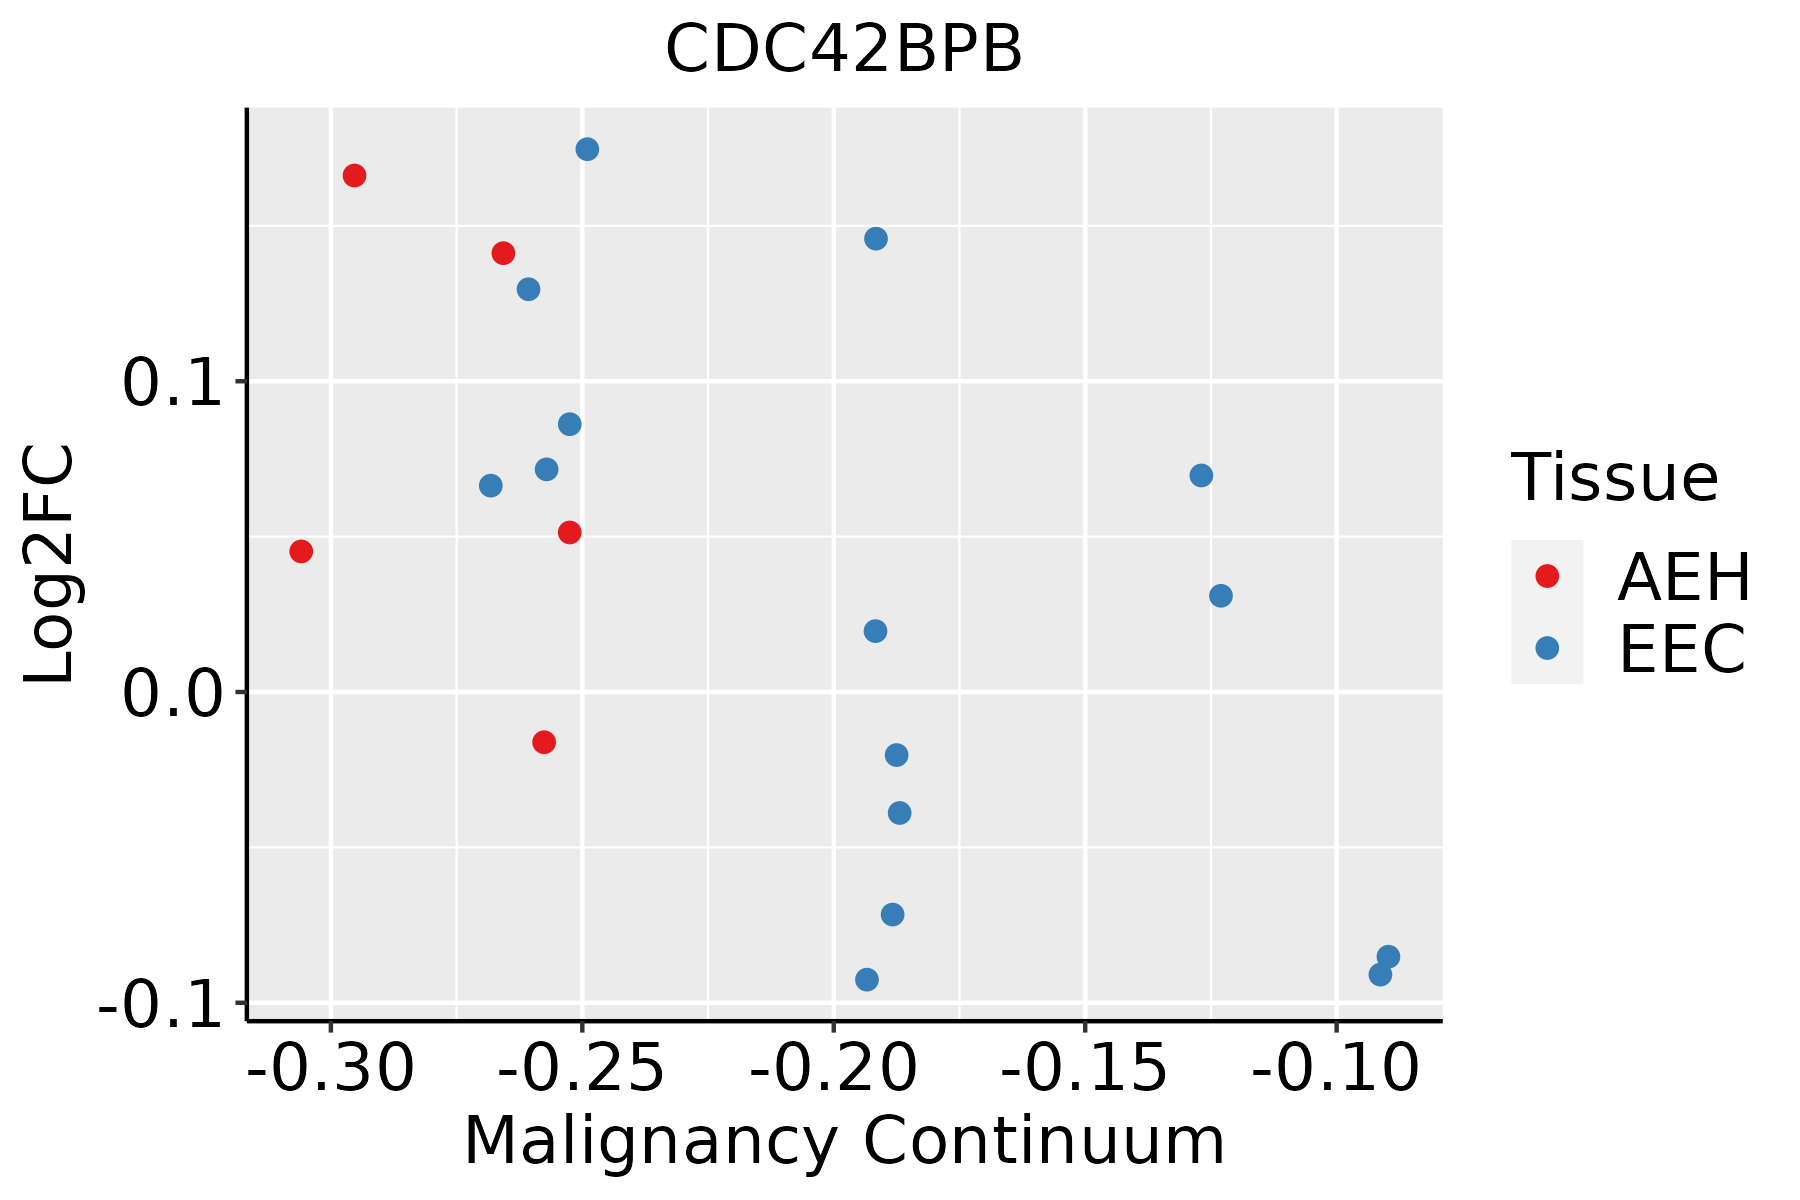 | AEH: Atypical endometrial hyperplasia |
| EEC: Endometrioid Cancer | ||
| Esophagus |  | ESCC: Esophageal squamous cell carcinoma |
| HGIN: High-grade intraepithelial neoplasias | ||
| LGIN: Low-grade intraepithelial neoplasias | ||
| Liver | 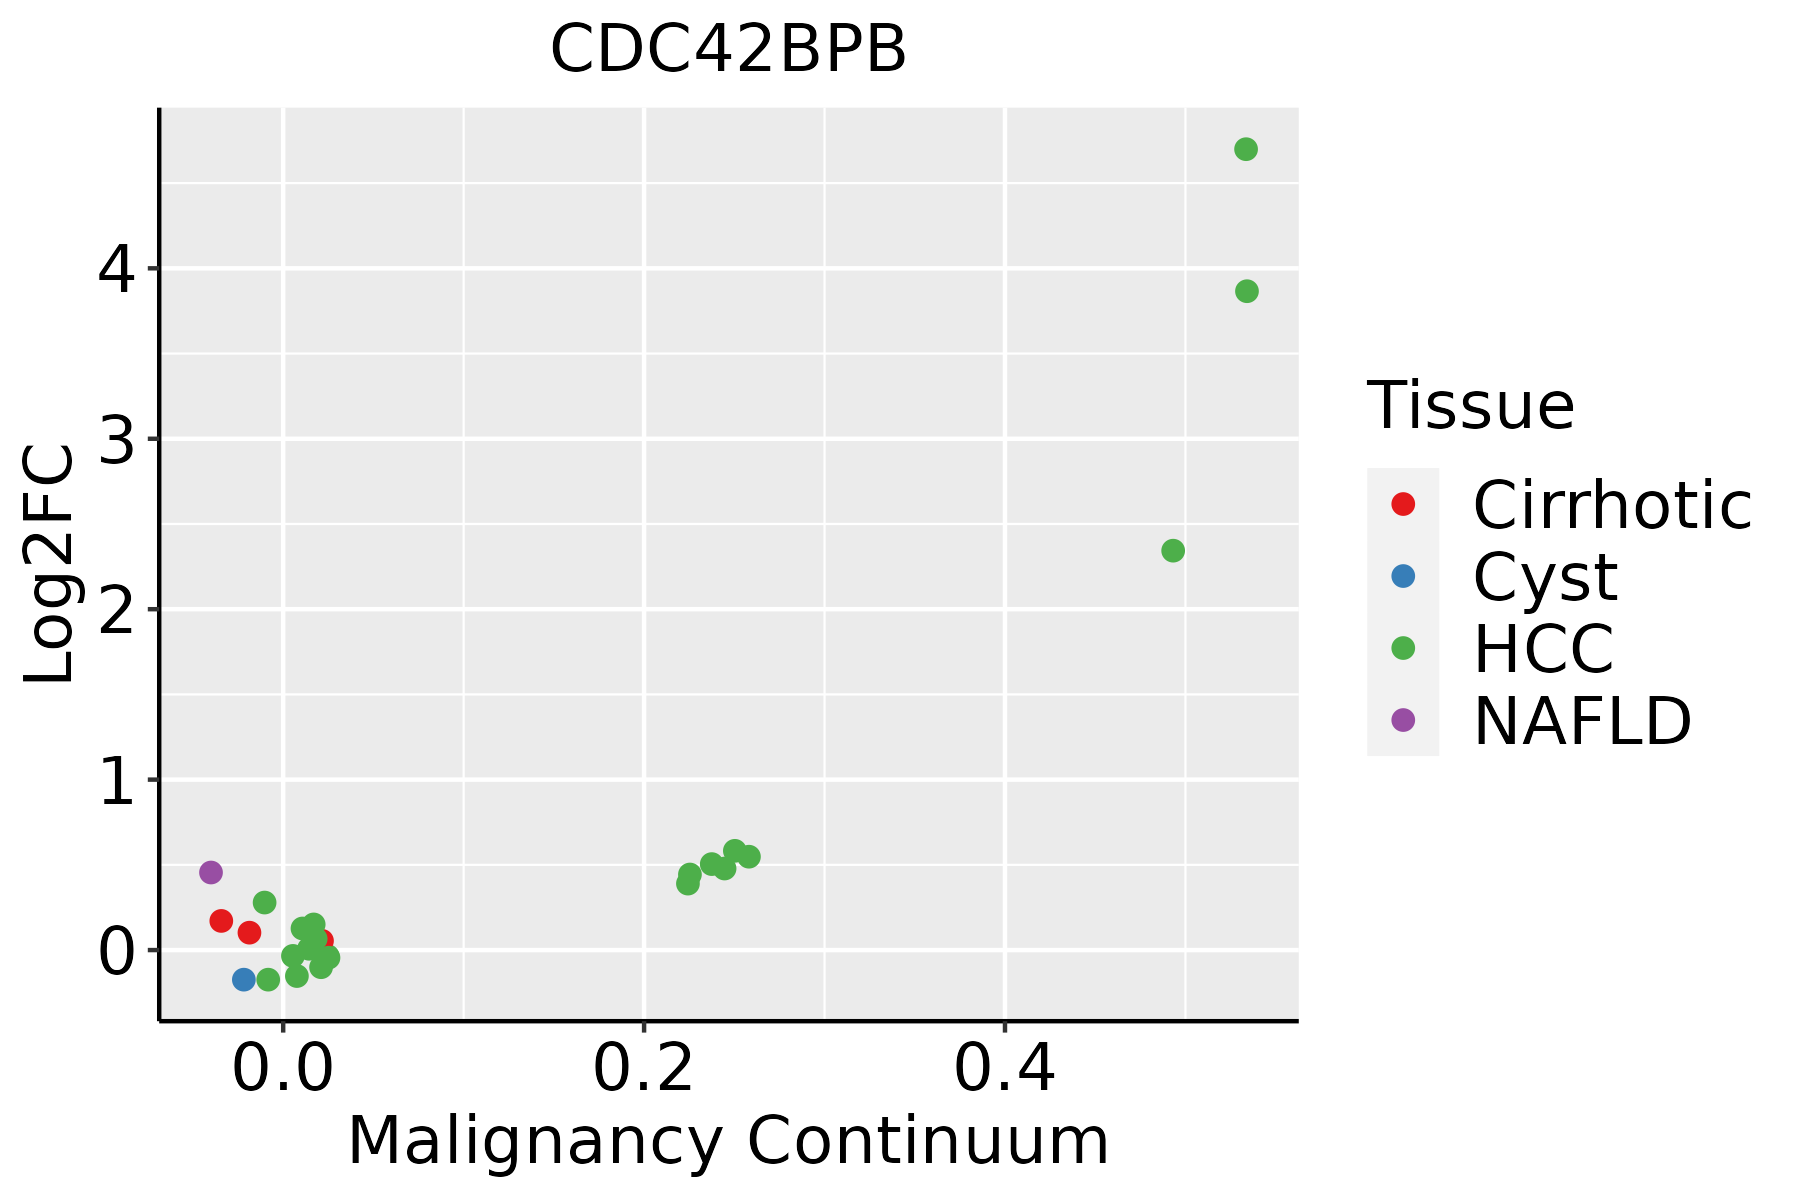 | HCC: Hepatocellular carcinoma |
| NAFLD: Non-alcoholic fatty liver disease | ||
| Oral Cavity | 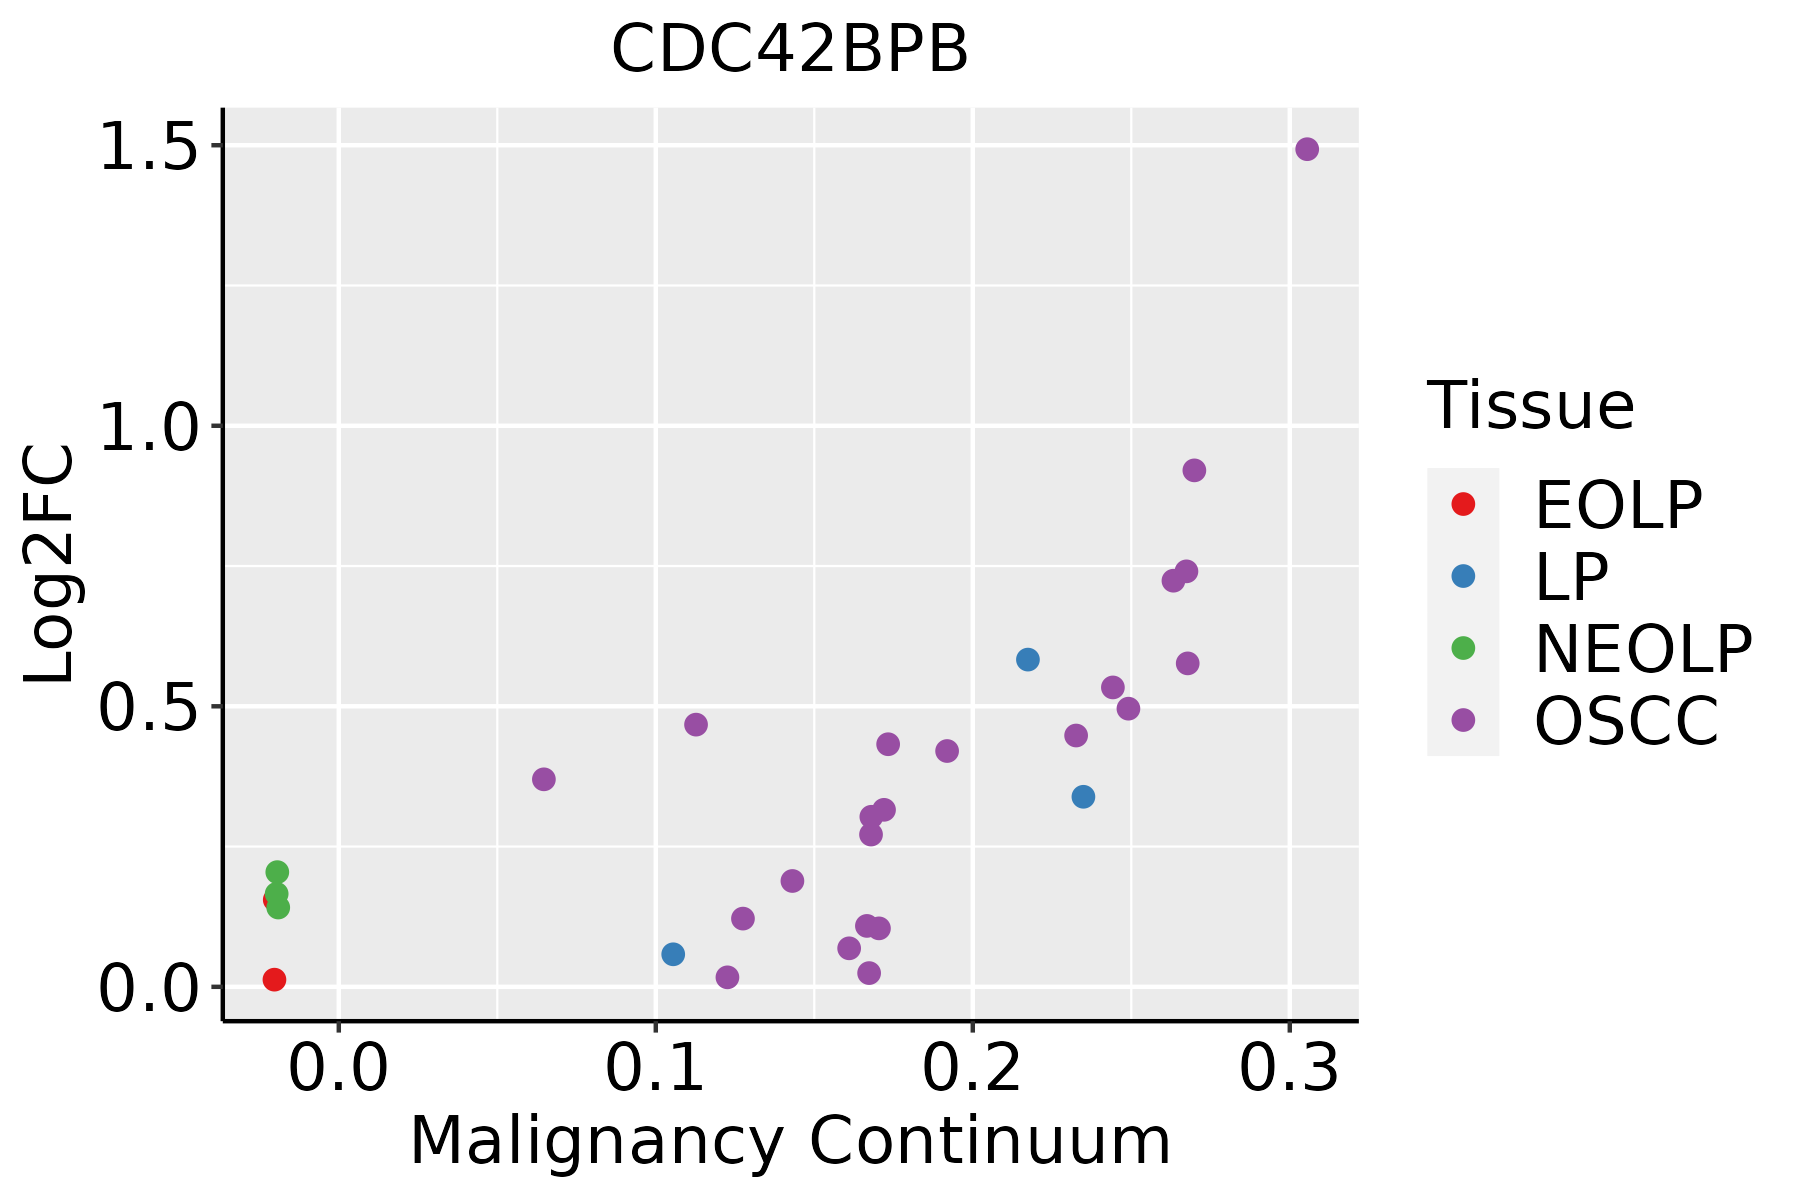 | EOLP: Erosive Oral lichen planus |
| LP: leukoplakia | ||
| NEOLP: Non-erosive oral lichen planus | ||
| OSCC: Oral squamous cell carcinoma | ||
| Prostate | 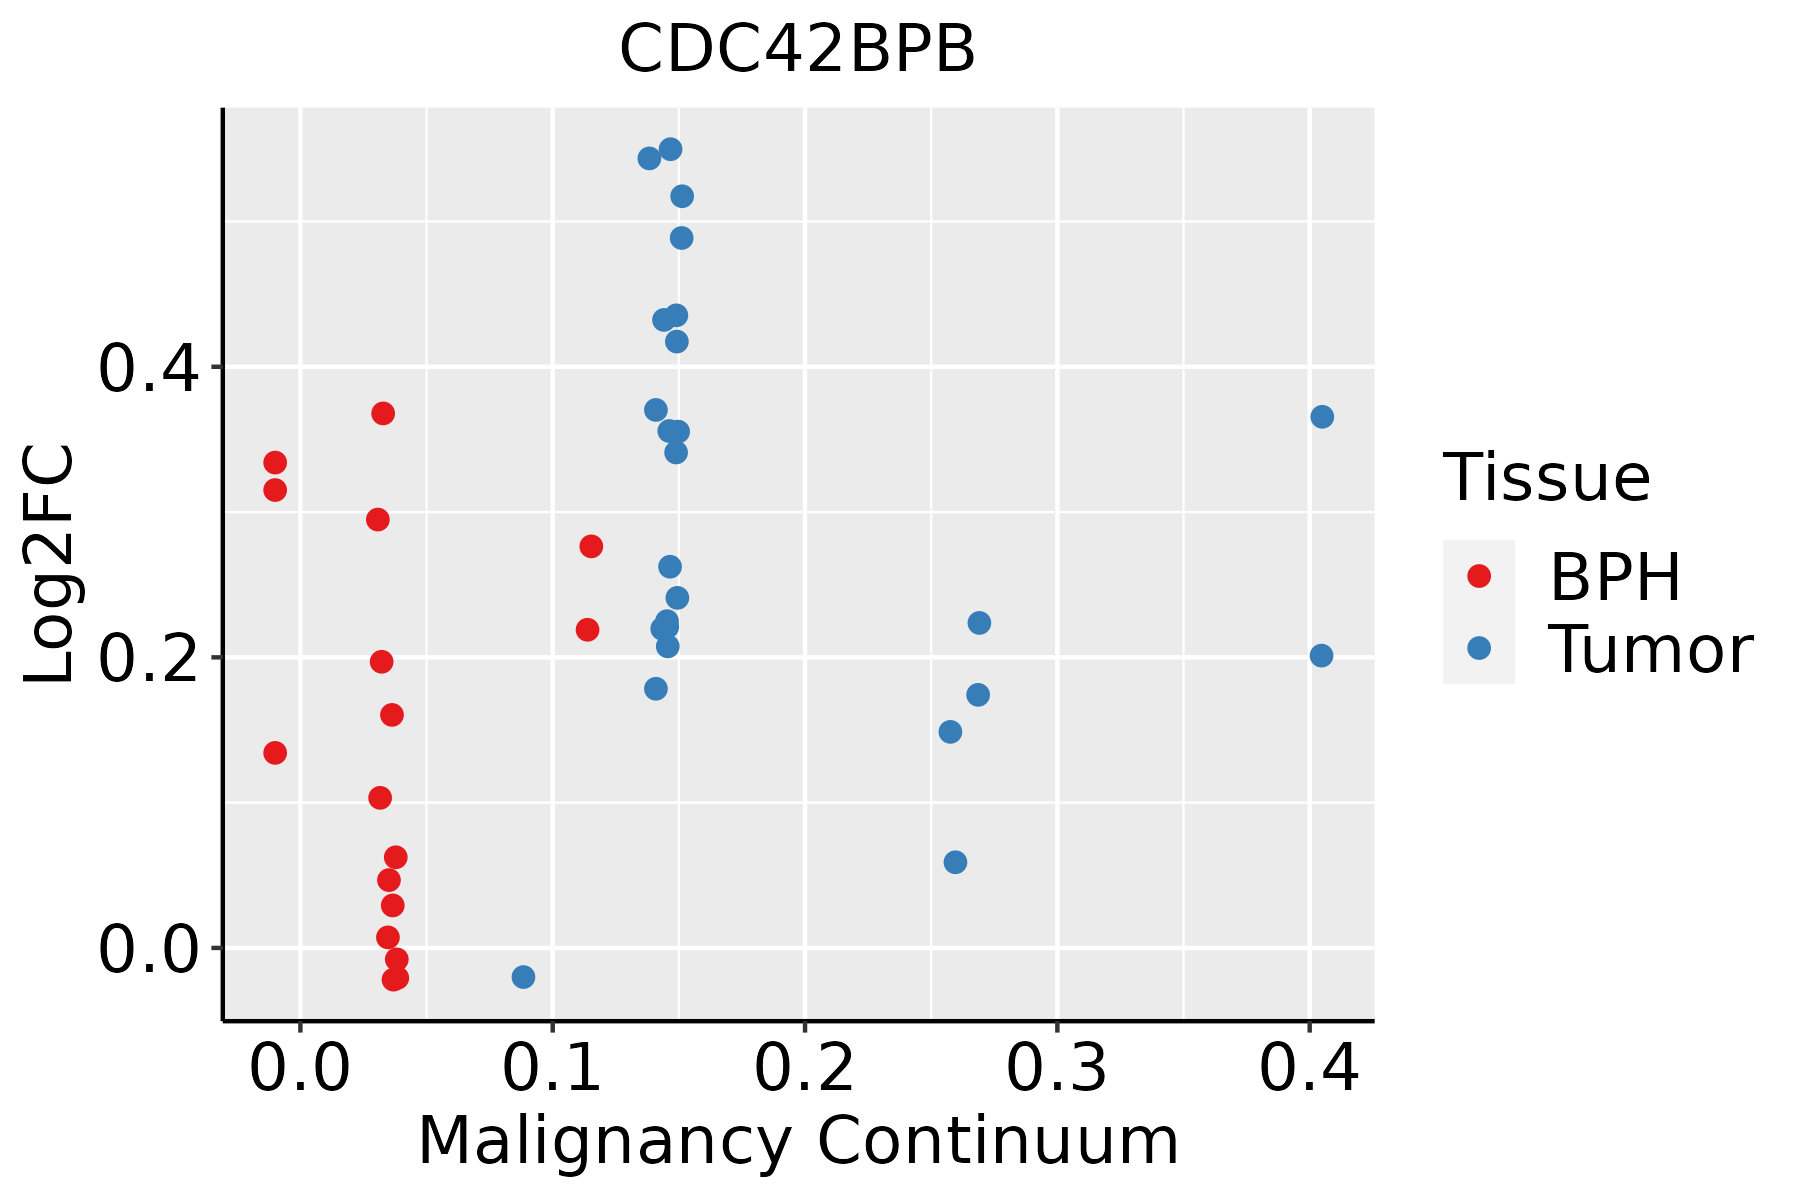 | BPH: Benign Prostatic Hyperplasia |
| Thyroid | 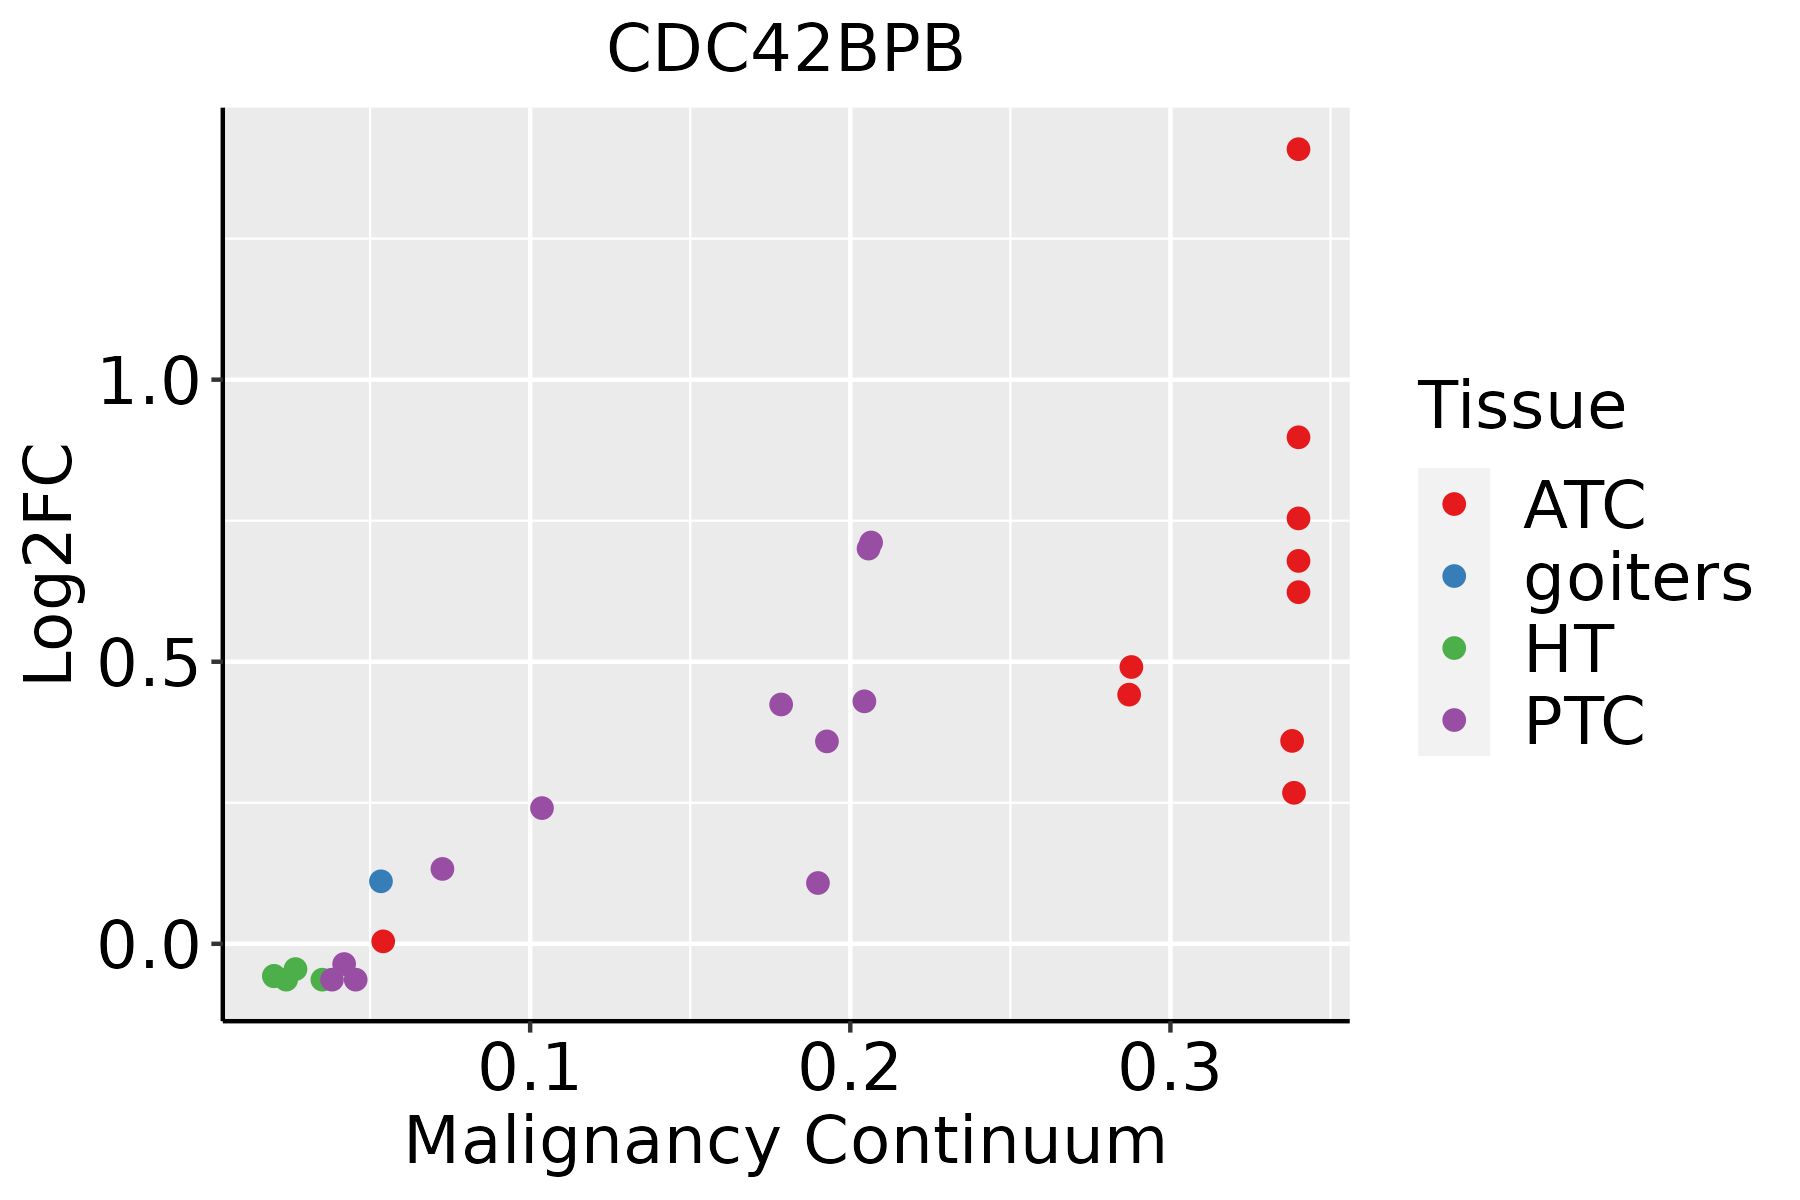 | ATC: Anaplastic thyroid cancer |
| HT: Hashimoto's thyroiditis | ||
| PTC: Papillary thyroid cancer |
| ∗log2FC in expression of this searched gene in stem-like cells from each diseased tissue sample relative to stem-like cells in normal samples in each tissue plotted against the malignancy continuum. Samples are colored based on if they are from different disease stage. |
Top |
Malignant transformation related pathway analysis |
| Find out the enriched GO biological processes and KEGG pathways involved in transition from healthy to precancer to cancer |
| Tissue | Disease Stage | Enriched GO biological Processes |
| Colorectum | AD |  |
| Colorectum | SER |  |
| Colorectum | MSS |  |
| Colorectum | MSI-H |  |
| Colorectum | FAP |  |
| ∗Top 15 enriched GO BP terms are showed in the bar plot of each disease state in each tissue. Each row represents a significant GO biological process which is colored according to the -log10(p.adjust). |
| Page: 1 2 3 4 5 6 7 8 9 |
| GO ID | Tissue | Disease Stage | Description | Gene Ratio | Bg Ratio | pvalue | p.adjust | Count |
| GO:00071639 | Cervix | CC | establishment or maintenance of cell polarity | 63/2311 | 218/18723 | 4.25e-11 | 8.76e-09 | 63 |
| GO:00315328 | Cervix | CC | actin cytoskeleton reorganization | 31/2311 | 107/18723 | 3.34e-06 | 8.99e-05 | 31 |
| GO:00310329 | Cervix | CC | actomyosin structure organization | 43/2311 | 196/18723 | 1.11e-04 | 1.40e-03 | 43 |
| GO:00181076 | Cervix | CC | peptidyl-threonine phosphorylation | 25/2311 | 116/18723 | 3.59e-03 | 2.30e-02 | 25 |
| GO:00182106 | Cervix | CC | peptidyl-threonine modification | 26/2311 | 125/18723 | 4.98e-03 | 2.97e-02 | 26 |
| GO:000716310 | Endometrium | AEH | establishment or maintenance of cell polarity | 54/2100 | 218/18723 | 1.30e-08 | 8.47e-07 | 54 |
| GO:00315329 | Endometrium | AEH | actin cytoskeleton reorganization | 32/2100 | 107/18723 | 1.24e-07 | 5.80e-06 | 32 |
| GO:003103210 | Endometrium | AEH | actomyosin structure organization | 46/2100 | 196/18723 | 8.00e-07 | 2.91e-05 | 46 |
| GO:00181077 | Endometrium | AEH | peptidyl-threonine phosphorylation | 24/2100 | 116/18723 | 2.14e-03 | 1.65e-02 | 24 |
| GO:00182107 | Endometrium | AEH | peptidyl-threonine modification | 25/2100 | 125/18723 | 2.84e-03 | 2.04e-02 | 25 |
| GO:000716315 | Endometrium | EEC | establishment or maintenance of cell polarity | 56/2168 | 218/18723 | 5.41e-09 | 3.57e-07 | 56 |
| GO:003153214 | Endometrium | EEC | actin cytoskeleton reorganization | 33/2168 | 107/18723 | 7.46e-08 | 3.89e-06 | 33 |
| GO:003103214 | Endometrium | EEC | actomyosin structure organization | 46/2168 | 196/18723 | 1.94e-06 | 5.80e-05 | 46 |
| GO:001821013 | Endometrium | EEC | peptidyl-threonine modification | 28/2168 | 125/18723 | 4.23e-04 | 4.42e-03 | 28 |
| GO:001810713 | Endometrium | EEC | peptidyl-threonine phosphorylation | 26/2168 | 116/18723 | 6.60e-04 | 6.37e-03 | 26 |
| GO:000716320 | Esophagus | ESCC | establishment or maintenance of cell polarity | 143/8552 | 218/18723 | 2.05e-09 | 4.65e-08 | 143 |
| GO:003153218 | Esophagus | ESCC | actin cytoskeleton reorganization | 72/8552 | 107/18723 | 5.03e-06 | 5.31e-05 | 72 |
| GO:003103219 | Esophagus | ESCC | actomyosin structure organization | 108/8552 | 196/18723 | 4.86e-03 | 1.88e-02 | 108 |
| GO:001810710 | Esophagus | ESCC | peptidyl-threonine phosphorylation | 66/8552 | 116/18723 | 9.76e-03 | 3.37e-02 | 66 |
| GO:001821010 | Esophagus | ESCC | peptidyl-threonine modification | 70/8552 | 125/18723 | 1.29e-02 | 4.25e-02 | 70 |
| Page: 1 2 3 |
| Pathway ID | Tissue | Disease Stage | Description | Gene Ratio | Bg Ratio | pvalue | p.adjust | qvalue | Count |
| Page: 1 |
Top |
Cell-cell communication analysis |
| Identification of potential cell-cell interactions between two cell types and their ligand-receptor pairs for different disease states |
| Ligand | Receptor | LRpair | Pathway | Tissue | Disease Stage |
| Page: 1 |
Top |
Single-cell gene regulatory network inference analysis |
| Find out the significant the regulons (TFs) and the target genes of each regulon across cell types for different disease states |
| TF | Cell Type | Tissue | Disease Stage | Target Gene | RSS | Regulon Activity |
| ∗The dot plots of a searched regulon are shown for all cell subpopulations in each disease state of each tissue based on the regulon specific score inferred using pySCENIC and by calculating the average expression. |
| Page: 1 |
Top |
Somatic mutation of malignant transformation related genes |
| Annotation of somatic variants for genes involved in malignant transformation |
| Hugo Symbol | Variant Class | Variant Classification | dbSNP RS | HGVSc | HGVSp | HGVSp Short | SWISSPROT | BIOTYPE | SIFT | PolyPhen | Tumor Sample Barcode | Tissue | Histology | Sex | Age | Stage | Therapy Types | Drugs | Outcome |
| CDC42BPB | SNV | Missense_Mutation | novel | c.4793N>C | p.Gly1598Ala | p.G1598A | Q9Y5S2 | protein_coding | deleterious(0.01) | possibly_damaging(0.677) | TCGA-A2-A0CR-01 | Breast | breast invasive carcinoma | Female | <65 | I/II | Chemotherapy | adriamycin | CR |
| CDC42BPB | SNV | Missense_Mutation | novel | c.4638N>C | p.Gln1546His | p.Q1546H | Q9Y5S2 | protein_coding | deleterious(0.03) | possibly_damaging(0.615) | TCGA-A2-A0CR-01 | Breast | breast invasive carcinoma | Female | <65 | I/II | Chemotherapy | adriamycin | CR |
| CDC42BPB | SNV | Missense_Mutation | c.2095N>C | p.Glu699Gln | p.E699Q | Q9Y5S2 | protein_coding | deleterious(0.01) | possibly_damaging(0.73) | TCGA-A2-A0CX-01 | Breast | breast invasive carcinoma | Female | <65 | I/II | Chemotherapy | adriamycin | SD | |
| CDC42BPB | SNV | Missense_Mutation | novel | c.1017T>A | p.His339Gln | p.H339Q | Q9Y5S2 | protein_coding | deleterious(0) | probably_damaging(0.997) | TCGA-A8-A07J-01 | Breast | breast invasive carcinoma | Female | <65 | I/II | Chemotherapy | 5-fluorouracil | CR |
| CDC42BPB | SNV | Missense_Mutation | rs367927706 | c.3169N>A | p.Glu1057Lys | p.E1057K | Q9Y5S2 | protein_coding | deleterious(0) | possibly_damaging(0.801) | TCGA-AN-A046-01 | Breast | breast invasive carcinoma | Female | >=65 | I/II | Unknown | Unknown | SD |
| CDC42BPB | SNV | Missense_Mutation | rs374402137 | c.2300N>T | p.Ala767Val | p.A767V | Q9Y5S2 | protein_coding | tolerated(0.39) | benign(0) | TCGA-AN-A0AK-01 | Breast | breast invasive carcinoma | Female | >=65 | I/II | Unknown | Unknown | SD |
| CDC42BPB | SNV | Missense_Mutation | novel | c.5131N>C | p.Thr1711Pro | p.T1711P | Q9Y5S2 | protein_coding | deleterious_low_confidence(0.02) | benign(0) | TCGA-AR-A1AO-01 | Breast | breast invasive carcinoma | Female | <65 | I/II | Chemotherapy | doxorubicin | SD |
| CDC42BPB | SNV | Missense_Mutation | novel | c.2815N>A | p.Asp939Asn | p.D939N | Q9Y5S2 | protein_coding | tolerated(0.22) | benign(0.189) | TCGA-AR-A2LE-01 | Breast | breast invasive carcinoma | Female | >=65 | I/II | Hormone Therapy | tamoxiphen | PD |
| CDC42BPB | SNV | Missense_Mutation | c.271N>A | p.Ala91Thr | p.A91T | Q9Y5S2 | protein_coding | deleterious(0) | possibly_damaging(0.758) | TCGA-BH-A0HF-01 | Breast | breast invasive carcinoma | Female | >=65 | I/II | Hormone Therapy | arimidex | SD | |
| CDC42BPB | SNV | Missense_Mutation | c.1579C>T | p.Arg527Trp | p.R527W | Q9Y5S2 | protein_coding | deleterious(0) | possibly_damaging(0.757) | TCGA-BH-A18G-01 | Breast | breast invasive carcinoma | Female | >=65 | I/II | Unknown | Unknown | SD |
| Page: 1 2 3 4 5 6 7 8 9 10 11 12 13 14 15 16 17 |
Top |
Related drugs of malignant transformation related genes |
| Identification of chemicals and drugs interact with genes involved in malignant transfromation |
| (DGIdb 4.0) |
| Entrez ID | Symbol | Category | Interaction Types | Drug Claim Name | Drug Name | PMIDs |
| 9578 | CDC42BPB | DRUGGABLE GENOME, KINASE, SERINE THREONINE KINASE, ENZYME | inhibitor | 249565884 | A-443654 |
| Page: 1 |

Copyright 2023-Present -The University of Texas Health Science Center at Houston |