
|
|||||
|
 | |
| |
| |
| |
| |
| |
|
Gene: CDC40 |
Gene summary for CDC40 |
| Gene information | Species | Human | Gene symbol | CDC40 | Gene ID | 51362 |
| Gene name | cell division cycle 40 | |
| Gene Alias | EHB3 | |
| Cytomap | 6q21 | |
| Gene Type | protein-coding | GO ID | GO:0000375 | UniProtAcc | O60508 |
Top |
Malignant transformation analysis |
| Identification of the aberrant gene expression in precancerous and cancerous lesions by comparing the gene expression of stem-like cells in diseased tissues with normal stem cells |
| Entrez ID | Symbol | Replicates | Species | Organ | Tissue | Adj P-value | Log2FC | Malignancy |
| 51362 | CDC40 | HTA11_2487_2000001011 | Human | Colorectum | SER | 5.36e-06 | 3.58e-01 | -0.1808 |
| 51362 | CDC40 | HTA11_1938_2000001011 | Human | Colorectum | AD | 4.12e-11 | 4.97e-01 | -0.0811 |
| 51362 | CDC40 | HTA11_347_2000001011 | Human | Colorectum | AD | 7.88e-07 | 3.09e-01 | -0.1954 |
| 51362 | CDC40 | HTA11_3361_2000001011 | Human | Colorectum | AD | 3.15e-05 | 3.62e-01 | -0.1207 |
| 51362 | CDC40 | HTA11_83_2000001011 | Human | Colorectum | SER | 1.15e-07 | 4.76e-01 | -0.1526 |
| 51362 | CDC40 | HTA11_696_2000001011 | Human | Colorectum | AD | 1.99e-26 | 7.34e-01 | -0.1464 |
| 51362 | CDC40 | HTA11_1391_2000001011 | Human | Colorectum | AD | 1.35e-17 | 6.31e-01 | -0.059 |
| 51362 | CDC40 | HTA11_2992_2000001011 | Human | Colorectum | SER | 2.71e-04 | 5.38e-01 | -0.1706 |
| 51362 | CDC40 | HTA11_5212_2000001011 | Human | Colorectum | AD | 1.32e-02 | 4.58e-01 | -0.2061 |
| 51362 | CDC40 | HTA11_5216_2000001011 | Human | Colorectum | SER | 6.66e-05 | 6.64e-01 | -0.1462 |
| 51362 | CDC40 | HTA11_6818_2000001011 | Human | Colorectum | AD | 1.07e-04 | 5.31e-01 | 0.0112 |
| 51362 | CDC40 | HTA11_6818_2000001021 | Human | Colorectum | AD | 2.14e-03 | 2.99e-01 | 0.0588 |
| 51362 | CDC40 | A015-C-203 | Human | Colorectum | FAP | 2.96e-03 | -8.38e-02 | -0.1294 |
| 51362 | CDC40 | A015-C-104 | Human | Colorectum | FAP | 1.28e-03 | -1.07e-01 | -0.1899 |
| 51362 | CDC40 | A002-C-116 | Human | Colorectum | FAP | 1.87e-04 | -9.73e-02 | -0.0452 |
| 51362 | CDC40 | LZE4T | Human | Esophagus | ESCC | 2.16e-21 | 7.32e-01 | 0.0811 |
| 51362 | CDC40 | LZE7T | Human | Esophagus | ESCC | 2.93e-07 | 4.68e-01 | 0.0667 |
| 51362 | CDC40 | LZE8T | Human | Esophagus | ESCC | 6.53e-07 | 2.13e-01 | 0.067 |
| 51362 | CDC40 | LZE20T | Human | Esophagus | ESCC | 7.65e-08 | 2.39e-01 | 0.0662 |
| 51362 | CDC40 | LZE21D1 | Human | Esophagus | HGIN | 2.44e-05 | 5.73e-01 | 0.0632 |
| Page: 1 2 3 4 5 6 7 |
| Tissue | Expression Dynamics | Abbreviation |
| Colorectum (GSE201348) |  | FAP: Familial adenomatous polyposis |
| CRC: Colorectal cancer | ||
| Colorectum (HTA11) |  | AD: Adenomas |
| SER: Sessile serrated lesions | ||
| MSI-H: Microsatellite-high colorectal cancer | ||
| MSS: Microsatellite stable colorectal cancer | ||
| Esophagus | 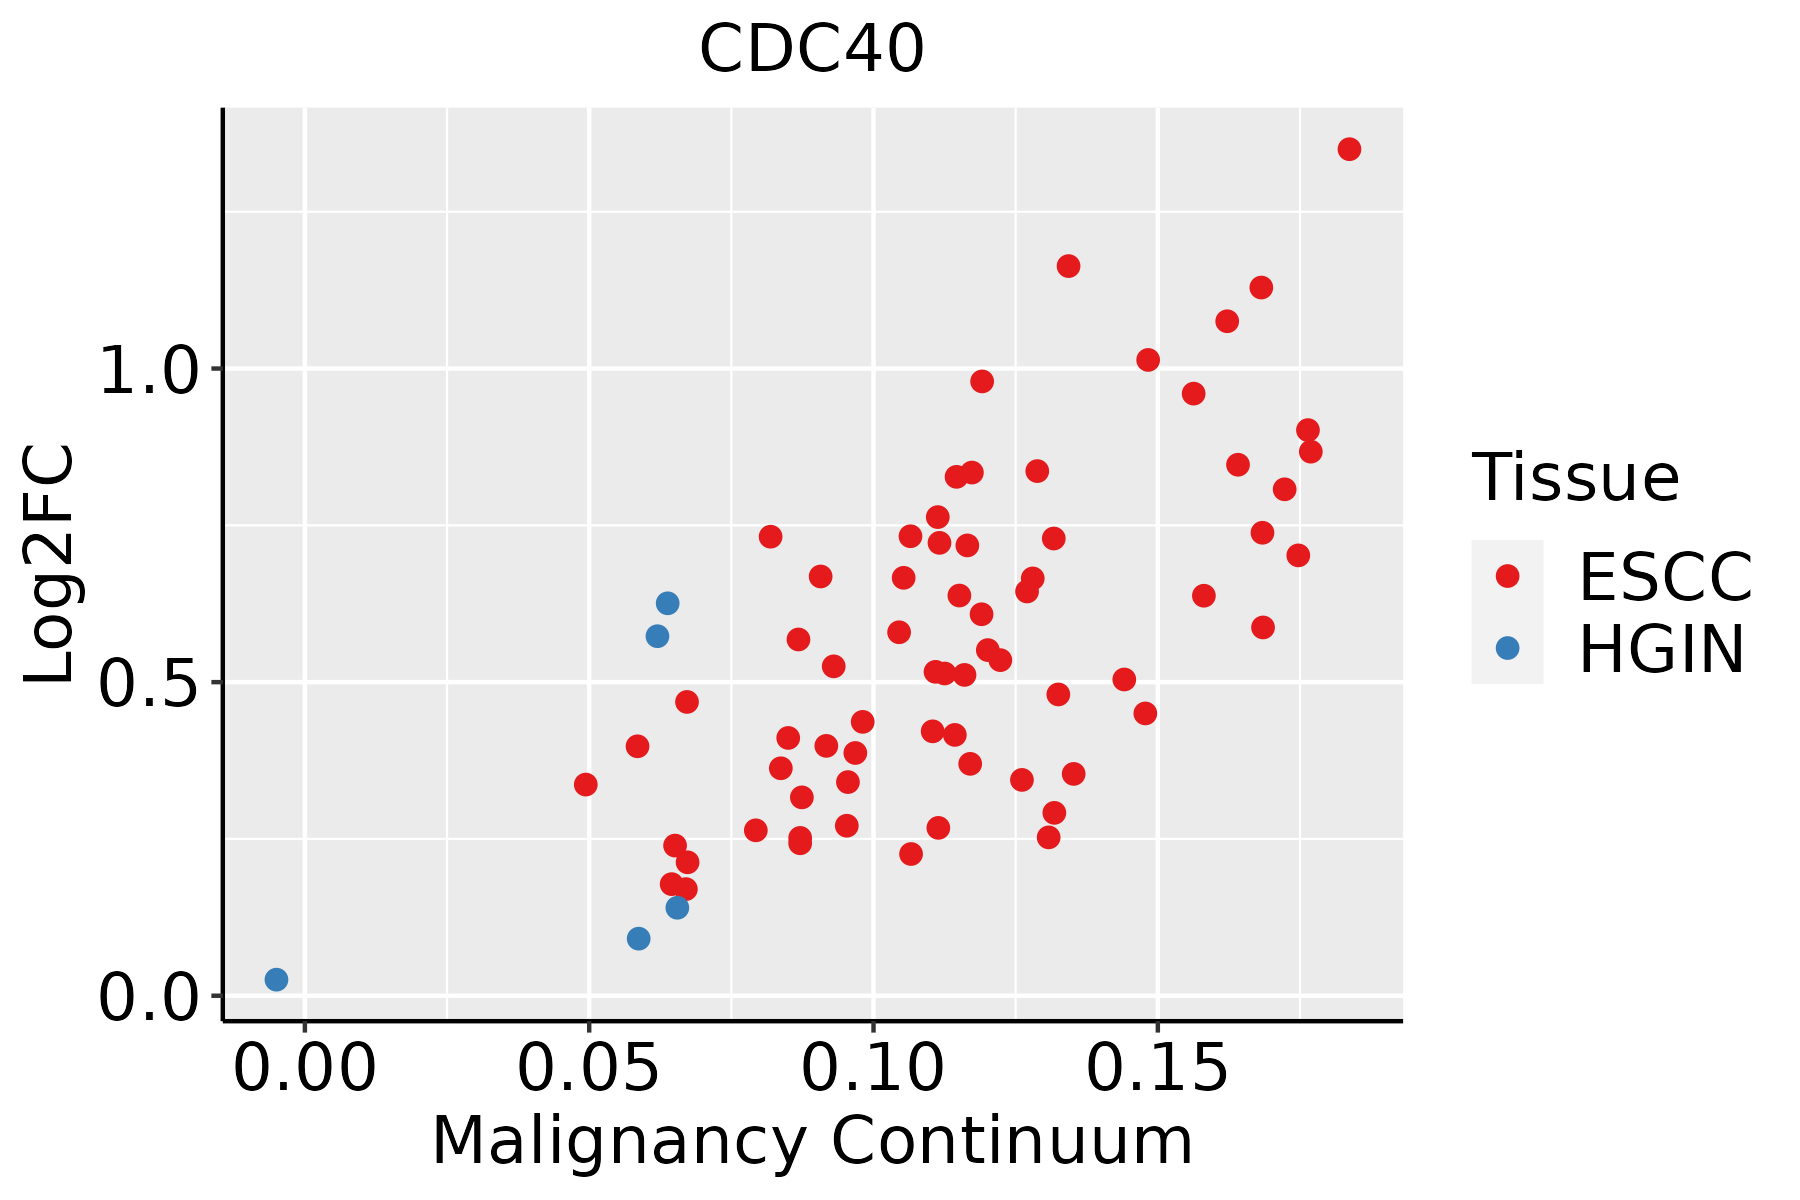 | ESCC: Esophageal squamous cell carcinoma |
| HGIN: High-grade intraepithelial neoplasias | ||
| LGIN: Low-grade intraepithelial neoplasias | ||
| Liver | 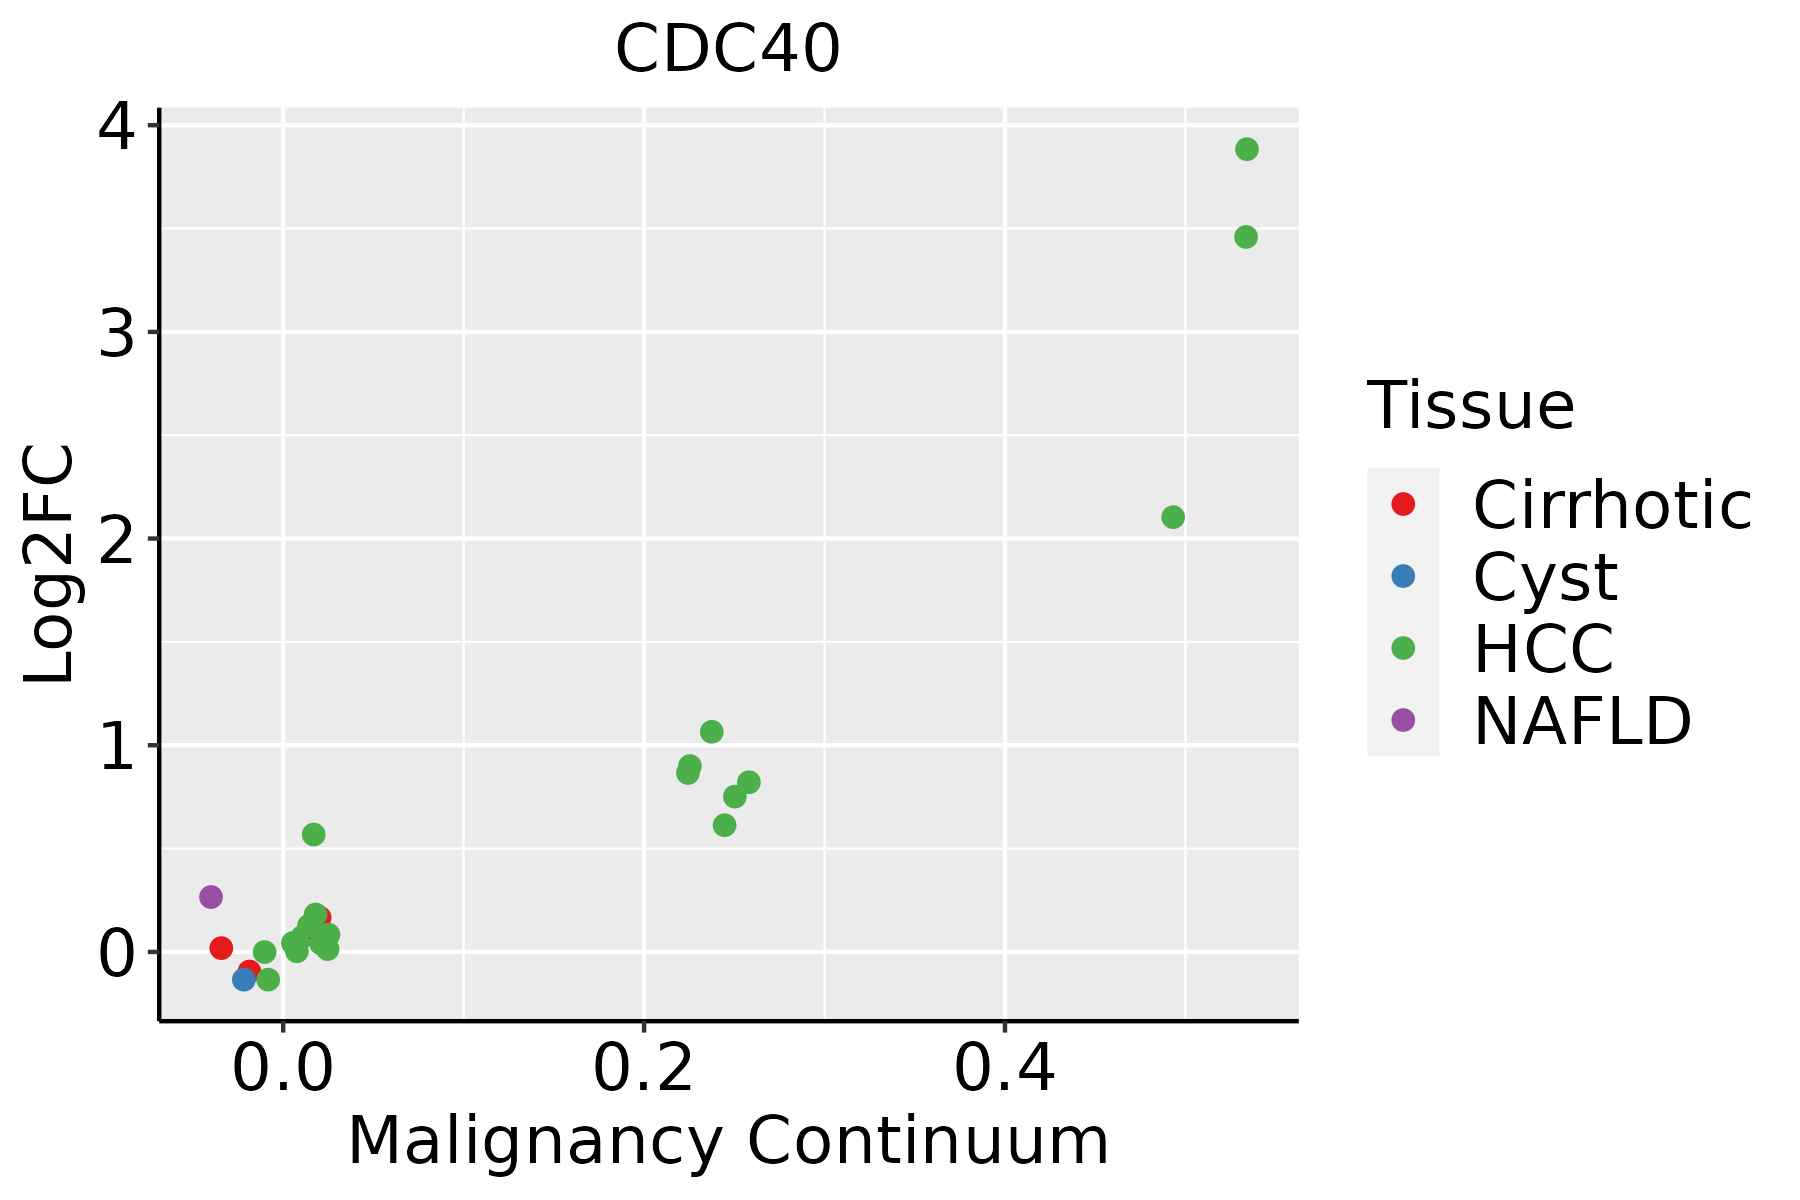 | HCC: Hepatocellular carcinoma |
| NAFLD: Non-alcoholic fatty liver disease | ||
| Oral Cavity | 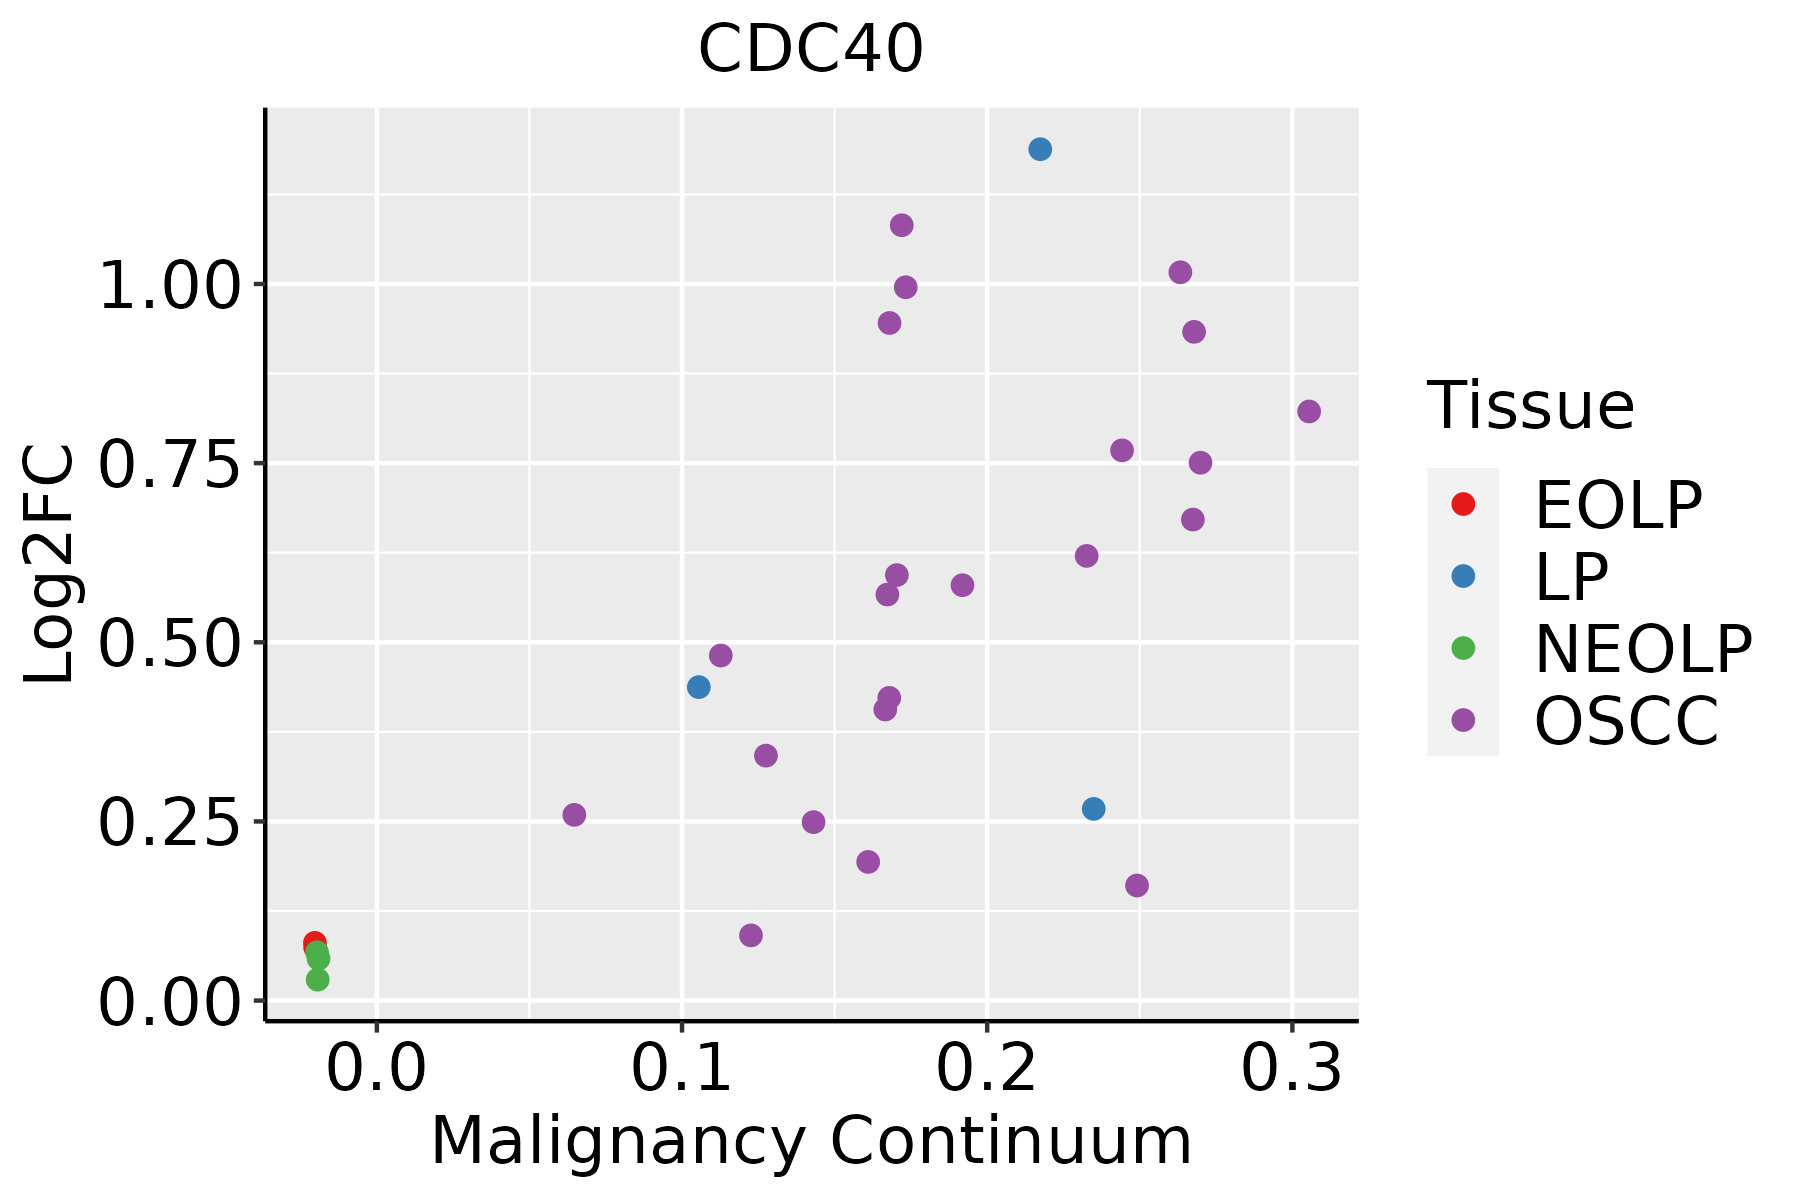 | EOLP: Erosive Oral lichen planus |
| LP: leukoplakia | ||
| NEOLP: Non-erosive oral lichen planus | ||
| OSCC: Oral squamous cell carcinoma | ||
| Skin | 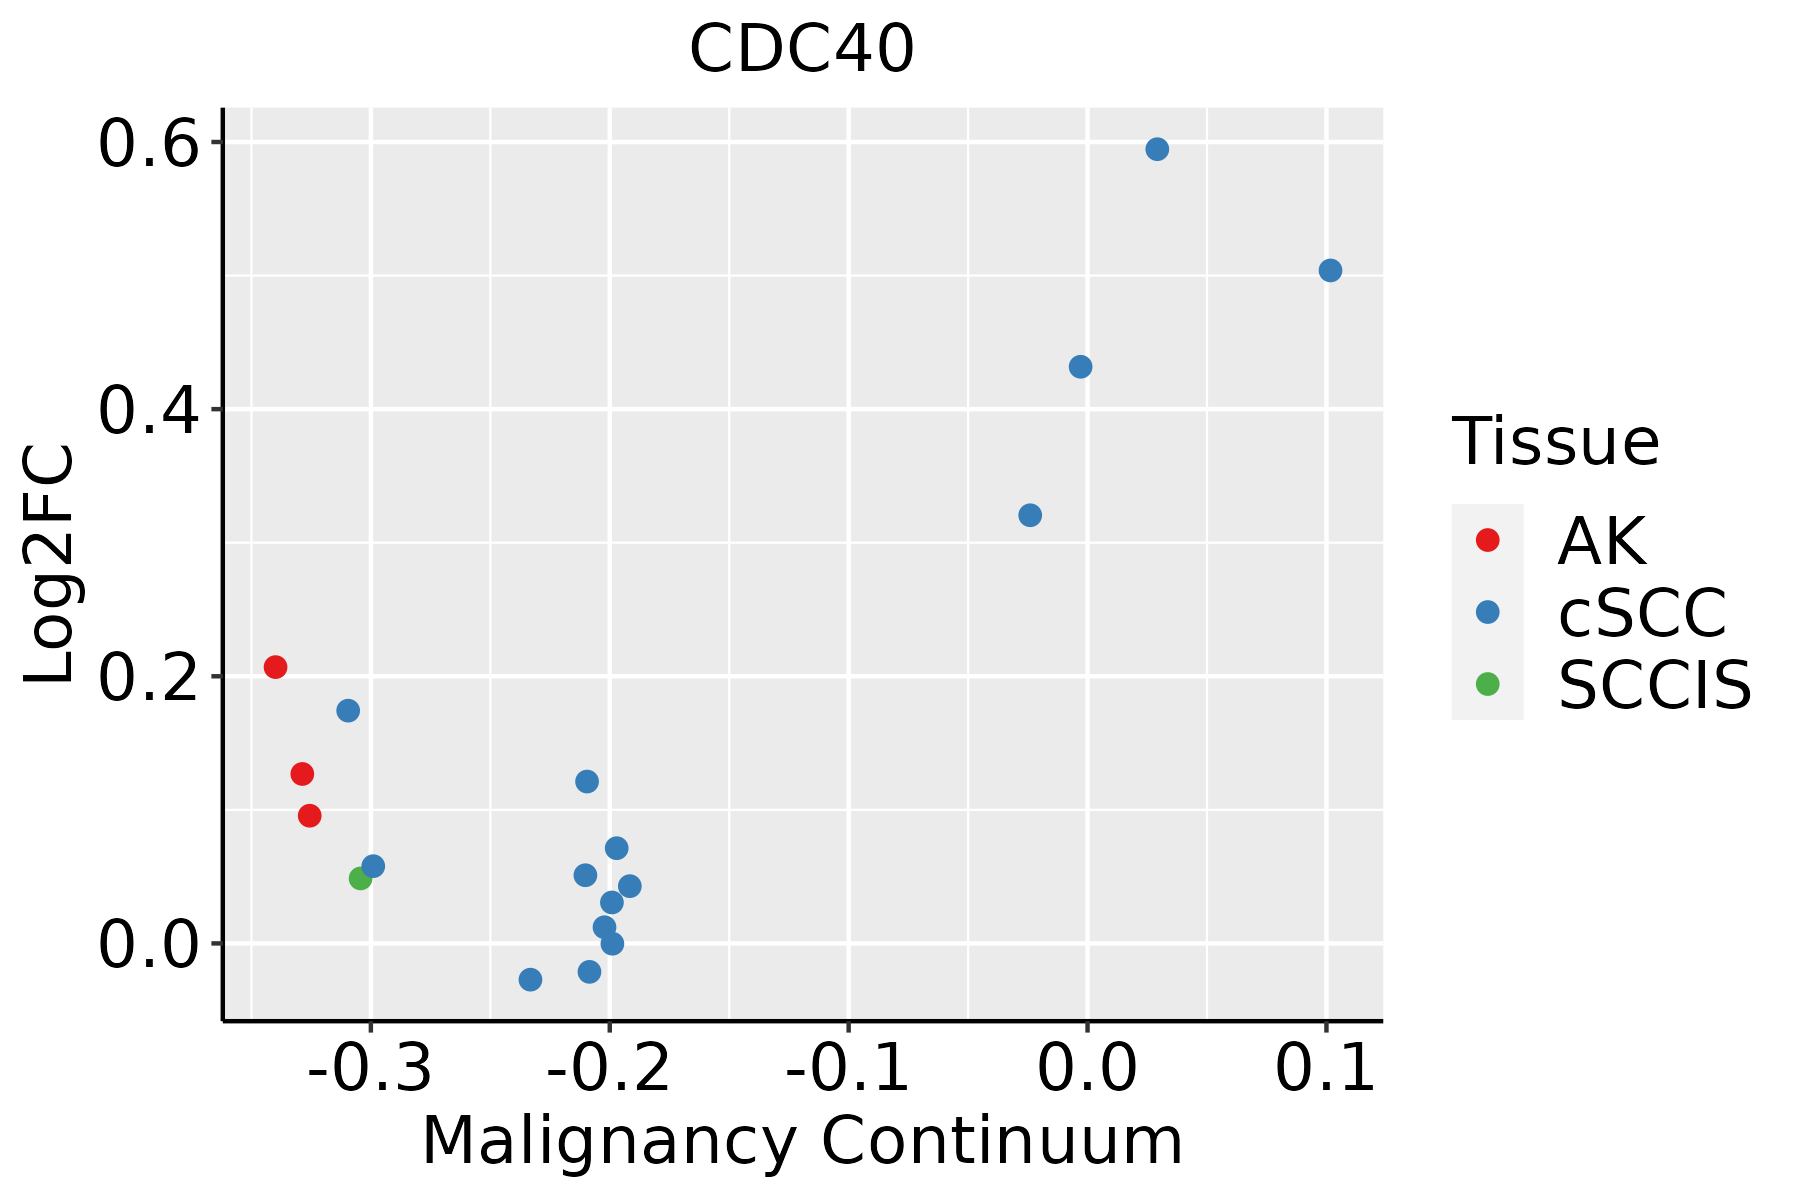 | AK: Actinic keratosis |
| cSCC: Cutaneous squamous cell carcinoma | ||
| SCCIS:squamous cell carcinoma in situ | ||
| Thyroid |  | ATC: Anaplastic thyroid cancer |
| HT: Hashimoto's thyroiditis | ||
| PTC: Papillary thyroid cancer |
| ∗log2FC in expression of this searched gene in stem-like cells from each diseased tissue sample relative to stem-like cells in normal samples in each tissue plotted against the malignancy continuum. Samples are colored based on if they are from different disease stage. |
Top |
Malignant transformation related pathway analysis |
| Find out the enriched GO biological processes and KEGG pathways involved in transition from healthy to precancer to cancer |
| Tissue | Disease Stage | Enriched GO biological Processes |
| Colorectum | AD |  |
| Colorectum | SER |  |
| Colorectum | MSS |  |
| Colorectum | MSI-H |  |
| Colorectum | FAP |  |
| ∗Top 15 enriched GO BP terms are showed in the bar plot of each disease state in each tissue. Each row represents a significant GO biological process which is colored according to the -log10(p.adjust). |
| Page: 1 2 3 4 5 6 7 8 9 |
| GO ID | Tissue | Disease Stage | Description | Gene Ratio | Bg Ratio | pvalue | p.adjust | Count |
| GO:0008380 | Colorectum | AD | RNA splicing | 169/3918 | 434/18723 | 3.59e-18 | 2.04e-15 | 169 |
| GO:0000377 | Colorectum | AD | RNA splicing, via transesterification reactions with bulged adenosine as nucleophile | 130/3918 | 320/18723 | 5.88e-16 | 2.16e-13 | 130 |
| GO:0000398 | Colorectum | AD | mRNA splicing, via spliceosome | 130/3918 | 320/18723 | 5.88e-16 | 2.16e-13 | 130 |
| GO:0000375 | Colorectum | AD | RNA splicing, via transesterification reactions | 131/3918 | 324/18723 | 7.11e-16 | 2.22e-13 | 131 |
| GO:00083801 | Colorectum | SER | RNA splicing | 123/2897 | 434/18723 | 3.84e-12 | 8.41e-10 | 123 |
| GO:00003751 | Colorectum | SER | RNA splicing, via transesterification reactions | 90/2897 | 324/18723 | 8.68e-09 | 7.50e-07 | 90 |
| GO:00003771 | Colorectum | SER | RNA splicing, via transesterification reactions with bulged adenosine as nucleophile | 89/2897 | 320/18723 | 9.82e-09 | 8.14e-07 | 89 |
| GO:00003981 | Colorectum | SER | mRNA splicing, via spliceosome | 89/2897 | 320/18723 | 9.82e-09 | 8.14e-07 | 89 |
| GO:00083804 | Colorectum | FAP | RNA splicing | 108/2622 | 434/18723 | 7.90e-10 | 1.86e-07 | 108 |
| GO:00003754 | Colorectum | FAP | RNA splicing, via transesterification reactions | 84/2622 | 324/18723 | 8.06e-09 | 1.10e-06 | 84 |
| GO:00003774 | Colorectum | FAP | RNA splicing, via transesterification reactions with bulged adenosine as nucleophile | 83/2622 | 320/18723 | 9.66e-09 | 1.23e-06 | 83 |
| GO:00003984 | Colorectum | FAP | mRNA splicing, via spliceosome | 83/2622 | 320/18723 | 9.66e-09 | 1.23e-06 | 83 |
| GO:000838026 | Esophagus | HGIN | RNA splicing | 160/2587 | 434/18723 | 3.74e-34 | 1.12e-30 | 160 |
| GO:000037520 | Esophagus | HGIN | RNA splicing, via transesterification reactions | 115/2587 | 324/18723 | 3.16e-23 | 3.80e-20 | 115 |
| GO:000037720 | Esophagus | HGIN | RNA splicing, via transesterification reactions with bulged adenosine as nucleophile | 113/2587 | 320/18723 | 1.24e-22 | 9.26e-20 | 113 |
| GO:000039820 | Esophagus | HGIN | mRNA splicing, via spliceosome | 113/2587 | 320/18723 | 1.24e-22 | 9.26e-20 | 113 |
| GO:0008380111 | Esophagus | ESCC | RNA splicing | 336/8552 | 434/18723 | 1.74e-42 | 3.67e-39 | 336 |
| GO:0000375111 | Esophagus | ESCC | RNA splicing, via transesterification reactions | 248/8552 | 324/18723 | 3.05e-30 | 1.49e-27 | 248 |
| GO:0000377111 | Esophagus | ESCC | RNA splicing, via transesterification reactions with bulged adenosine as nucleophile | 244/8552 | 320/18723 | 2.52e-29 | 1.07e-26 | 244 |
| GO:0000398111 | Esophagus | ESCC | mRNA splicing, via spliceosome | 244/8552 | 320/18723 | 2.52e-29 | 1.07e-26 | 244 |
| Page: 1 2 3 |
| Pathway ID | Tissue | Disease Stage | Description | Gene Ratio | Bg Ratio | pvalue | p.adjust | qvalue | Count |
| hsa03040 | Colorectum | AD | Spliceosome | 73/2092 | 217/8465 | 1.73e-03 | 9.68e-03 | 6.18e-03 | 73 |
| hsa030401 | Colorectum | AD | Spliceosome | 73/2092 | 217/8465 | 1.73e-03 | 9.68e-03 | 6.18e-03 | 73 |
| hsa0304018 | Esophagus | HGIN | Spliceosome | 79/1383 | 217/8465 | 3.22e-13 | 7.00e-12 | 5.56e-12 | 79 |
| hsa0304019 | Esophagus | HGIN | Spliceosome | 79/1383 | 217/8465 | 3.22e-13 | 7.00e-12 | 5.56e-12 | 79 |
| hsa0304027 | Esophagus | ESCC | Spliceosome | 128/4205 | 217/8465 | 3.31e-03 | 8.79e-03 | 4.50e-03 | 128 |
| hsa0304037 | Esophagus | ESCC | Spliceosome | 128/4205 | 217/8465 | 3.31e-03 | 8.79e-03 | 4.50e-03 | 128 |
| hsa030407 | Liver | Cirrhotic | Spliceosome | 102/2530 | 217/8465 | 5.69e-08 | 9.47e-07 | 5.84e-07 | 102 |
| hsa0304012 | Liver | Cirrhotic | Spliceosome | 102/2530 | 217/8465 | 5.69e-08 | 9.47e-07 | 5.84e-07 | 102 |
| hsa0304022 | Liver | HCC | Spliceosome | 122/4020 | 217/8465 | 5.55e-03 | 1.60e-02 | 8.91e-03 | 122 |
| hsa0304032 | Liver | HCC | Spliceosome | 122/4020 | 217/8465 | 5.55e-03 | 1.60e-02 | 8.91e-03 | 122 |
| hsa0304016 | Oral cavity | OSCC | Spliceosome | 123/3704 | 217/8465 | 7.21e-05 | 2.74e-04 | 1.40e-04 | 123 |
| hsa0304017 | Oral cavity | OSCC | Spliceosome | 123/3704 | 217/8465 | 7.21e-05 | 2.74e-04 | 1.40e-04 | 123 |
| hsa0304026 | Oral cavity | LP | Spliceosome | 106/2418 | 217/8465 | 1.30e-10 | 2.40e-09 | 1.55e-09 | 106 |
| hsa0304036 | Oral cavity | LP | Spliceosome | 106/2418 | 217/8465 | 1.30e-10 | 2.40e-09 | 1.55e-09 | 106 |
| Page: 1 |
Top |
Cell-cell communication analysis |
| Identification of potential cell-cell interactions between two cell types and their ligand-receptor pairs for different disease states |
| Ligand | Receptor | LRpair | Pathway | Tissue | Disease Stage |
| Page: 1 |
Top |
Single-cell gene regulatory network inference analysis |
| Find out the significant the regulons (TFs) and the target genes of each regulon across cell types for different disease states |
| TF | Cell Type | Tissue | Disease Stage | Target Gene | RSS | Regulon Activity |
| ∗The dot plots of a searched regulon are shown for all cell subpopulations in each disease state of each tissue based on the regulon specific score inferred using pySCENIC and by calculating the average expression. |
| Page: 1 |
Top |
Somatic mutation of malignant transformation related genes |
| Annotation of somatic variants for genes involved in malignant transformation |
| Hugo Symbol | Variant Class | Variant Classification | dbSNP RS | HGVSc | HGVSp | HGVSp Short | SWISSPROT | BIOTYPE | SIFT | PolyPhen | Tumor Sample Barcode | Tissue | Histology | Sex | Age | Stage | Therapy Types | Drugs | Outcome |
| CDC40 | SNV | Missense_Mutation | c.869N>T | p.Gly290Val | p.G290V | O60508 | protein_coding | deleterious(0) | probably_damaging(0.989) | TCGA-A2-A25A-01 | Breast | breast invasive carcinoma | Female | <65 | I/II | Unspecific | Cytoxan | SD | |
| CDC40 | SNV | Missense_Mutation | novel | c.32N>T | p.Ser11Phe | p.S11F | O60508 | protein_coding | tolerated(0.34) | benign(0.006) | TCGA-BH-A0B6-01 | Breast | breast invasive carcinoma | Female | <65 | I/II | Unknown | Unknown | SD |
| CDC40 | SNV | Missense_Mutation | c.666G>C | p.Lys222Asn | p.K222N | O60508 | protein_coding | deleterious(0.05) | possibly_damaging(0.701) | TCGA-EW-A1PB-01 | Breast | breast invasive carcinoma | Female | >=65 | III/IV | Unknown | Unknown | SD | |
| CDC40 | insertion | Frame_Shift_Ins | novel | c.171_172insG | p.Pro58AlafsTer6 | p.P58Afs*6 | O60508 | protein_coding | TCGA-A7-A0CE-01 | Breast | breast invasive carcinoma | Female | <65 | I/II | Chemotherapy | adriamycin | SD | ||
| CDC40 | insertion | Frame_Shift_Ins | novel | c.172_173insGATTGCAGCTCTGGCCGCTTCCTATGGTTCGGGTTCAGGGTCCGAATCGGACT | p.Pro58ArgfsTer100 | p.P58Rfs*100 | O60508 | protein_coding | TCGA-A7-A0CE-01 | Breast | breast invasive carcinoma | Female | <65 | I/II | Chemotherapy | adriamycin | SD | ||
| CDC40 | SNV | Missense_Mutation | novel | c.196N>G | p.Leu66Val | p.L66V | O60508 | protein_coding | tolerated(0.94) | benign(0) | TCGA-EA-A3HU-01 | Cervix | cervical & endocervical cancer | Female | <65 | I/II | Unknown | Unknown | SD |
| CDC40 | SNV | Missense_Mutation | novel | c.1579N>T | p.Asp527Tyr | p.D527Y | O60508 | protein_coding | deleterious(0) | probably_damaging(0.998) | TCGA-VS-A94Z-01 | Cervix | cervical & endocervical cancer | Female | <65 | I/II | Chemotherapy | cisplatin | CR |
| CDC40 | SNV | Missense_Mutation | c.35N>G | p.Tyr12Cys | p.Y12C | O60508 | protein_coding | deleterious(0.01) | benign(0.058) | TCGA-A6-6780-01 | Colorectum | colon adenocarcinoma | Male | >=65 | I/II | Unknown | Unknown | SD | |
| CDC40 | SNV | Missense_Mutation | c.1085N>C | p.Glu362Ala | p.E362A | O60508 | protein_coding | deleterious(0) | probably_damaging(0.994) | TCGA-AA-A01P-01 | Colorectum | colon adenocarcinoma | Female | >=65 | III/IV | Unknown | Unknown | PD | |
| CDC40 | SNV | Missense_Mutation | c.875N>A | p.Ser292Asn | p.S292N | O60508 | protein_coding | tolerated(0.19) | benign(0.445) | TCGA-AD-6964-01 | Colorectum | colon adenocarcinoma | Male | <65 | III/IV | Chemotherapy | folfox | PD |
| Page: 1 2 3 4 5 6 |
Top |
Related drugs of malignant transformation related genes |
| Identification of chemicals and drugs interact with genes involved in malignant transfromation |
| (DGIdb 4.0) |
| Entrez ID | Symbol | Category | Interaction Types | Drug Claim Name | Drug Name | PMIDs |
| Page: 1 |

Copyright 2023-Present -The University of Texas Health Science Center at Houston |